Matplotlib中的Axis.get_picker()函数:轻松获取坐标轴拾取器
参考:Matplotlib.axis.Axis.get_picker() function in Python
Matplotlib是Python中最流行的数据可视化库之一,它提供了丰富的绘图功能和自定义选项。在Matplotlib中,坐标轴(Axis)是图表的重要组成部分,而Axis.get_picker()函数则是与坐标轴交互的一个重要工具。本文将深入探讨Axis.get_picker()函数的用法、特性和应用场景,帮助您更好地理解和使用这个强大的功能。
1. Axis.get_picker()函数简介
Axis.get_picker()是Matplotlib库中axis.Axis类的一个方法。这个函数的主要作用是获取当前坐标轴的拾取器(picker)。拾取器是一个用于确定鼠标事件是否”拾取”了某个艺术家对象(如线条、点或文本)的函数或数值。
1.1 基本语法
import matplotlib.pyplot as plt

fig, ax = plt.subplots()
ax.plot([1, 2, 3, 4], [1, 4, 2, 3], label='how2matplotlib.com')
axis = ax.xaxis  # 或 ax.yaxis

picker = axis.get_picker()
print(f"Current picker: {picker}")

plt.show()
Output:
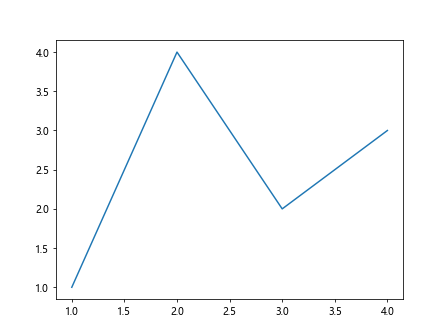
在这个例子中,我们创建了一个简单的图表,然后获取了x轴的拾取器。get_picker()函数返回当前设置的拾取器,可能是一个函数、布尔值或数值。
2. 拾取器的类型
拾取器可以有多种类型,每种类型都有其特定的用途和行为。理解这些类型对于正确使用get_picker()函数至关重要。
2.1 布尔型拾取器
布尔型拾取器是最简单的类型。当设置为True时,它允许对象被拾取;设置为False时,对象不可被拾取。
import matplotlib.pyplot as plt

fig, ax = plt.subplots()
ax.plot([1, 2, 3, 4], [1, 4, 2, 3], label='how2matplotlib.com')
ax.xaxis.set_picker(True)

picker = ax.xaxis.get_picker()
print(f"X-axis picker: {picker}")

plt.show()
Output:
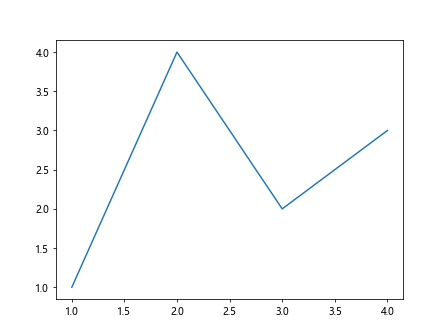
在这个例子中,我们将x轴的拾取器设置为True,然后使用get_picker()获取并打印拾取器的值。
2.2 数值型拾取器
数值型拾取器定义了一个像素距离。如果鼠标点击位置与对象的距离小于这个值,则认为对象被拾取。
import matplotlib.pyplot as plt

fig, ax = plt.subplots()
ax.plot([1, 2, 3, 4], [1, 4, 2, 3], label='how2matplotlib.com')
ax.yaxis.set_picker(5)  # 5像素的拾取距离

picker = ax.yaxis.get_picker()
print(f"Y-axis picker: {picker}")

plt.show()
Output:
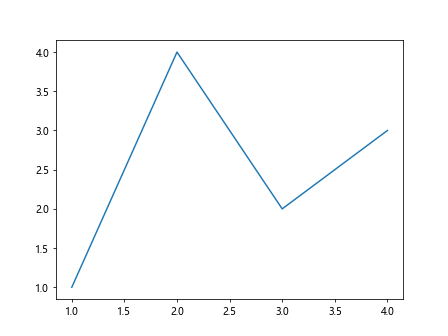
这里我们将y轴的拾取器设置为5像素的距离,然后获取并打印这个值。
2.3 函数型拾取器
函数型拾取器是最灵活的类型。它允许您定义自定义的拾取逻辑。
import matplotlib.pyplot as plt

def custom_picker(axis, mouseevent):
    return mouseevent.xdata is not None and 1 < mouseevent.xdata < 3

fig, ax = plt.subplots()
ax.plot([1, 2, 3, 4], [1, 4, 2, 3], label='how2matplotlib.com')
ax.xaxis.set_picker(custom_picker)

picker = ax.xaxis.get_picker()
print(f"X-axis picker: {picker}")

plt.show()
Output:
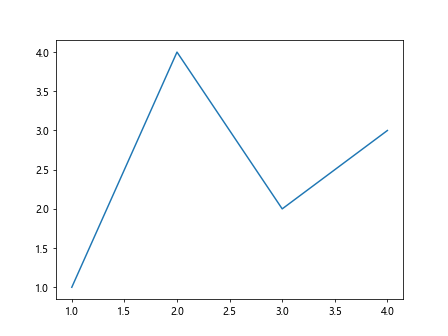
在这个例子中,我们定义了一个自定义的拾取器函数,只有当鼠标x坐标在1到3之间时才触发拾取事件。
3. 使用get_picker()进行交互式可视化
get_picker()函数在创建交互式可视化时特别有用。它允许您检查当前的拾取器设置,并根据需要进行调整。
3.1 动态更改拾取器
import matplotlib.pyplot as plt

fig, ax = plt.subplots()
line, = ax.plot([1, 2, 3, 4], [1, 4, 2, 3], label='how2matplotlib.com')

def on_pick(event):
    if ax.xaxis.get_picker():
        print("X-axis was picked!")
    else:
        print("X-axis is not pickable")

fig.canvas.mpl_connect('pick_event', on_pick)

ax.xaxis.set_picker(True)
plt.title("Click to toggle x-axis picker")

def toggle_picker(event):
    current_picker = ax.xaxis.get_picker()
    ax.xaxis.set_picker(not current_picker)
    plt.title(f"X-axis picker: {'On' if not current_picker else 'Off'}")
    fig.canvas.draw()

fig.canvas.mpl_connect('button_press_event', toggle_picker)

plt.show()
Output:
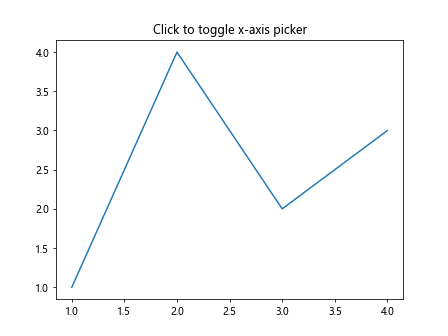
这个例子展示了如何动态更改拾取器。每次点击图表时,x轴的拾取器状态都会切换,并更新标题以反映当前状态。
3.2 多轴拾取器比较
import matplotlib.pyplot as plt

fig, (ax1, ax2) = plt.subplots(1, 2, figsize=(10, 4))

ax1.plot([1, 2, 3, 4], [1, 4, 2, 3], label='how2matplotlib.com')
ax2.plot([1, 2, 3, 4], [3, 1, 4, 2], label='how2matplotlib.com')

ax1.xaxis.set_picker(True)
ax2.xaxis.set_picker(5)

def compare_pickers(event):
    picker1 = ax1.xaxis.get_picker()
    picker2 = ax2.xaxis.get_picker()
    print(f"Left plot x-axis picker: {picker1}")
    print(f"Right plot x-axis picker: {picker2}")

fig.canvas.mpl_connect('button_press_event', compare_pickers)

plt.show()
Output:
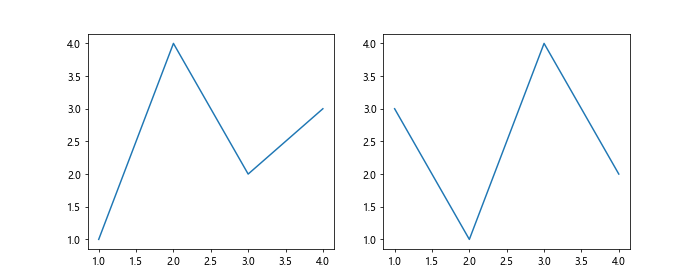
这个例子创建了两个子图,每个子图的x轴都有不同的拾取器设置。点击图表时,会打印出两个x轴的拾取器信息,方便比较。
4. get_picker()与其他Axis方法的结合使用
get_picker()函数通常与其他Axis方法结合使用,以实现更复杂的交互效果。
4.1 结合set_visible()使用
import matplotlib.pyplot as plt

fig, ax = plt.subplots()
ax.plot([1, 2, 3, 4], [1, 4, 2, 3], label='how2matplotlib.com')

def toggle_axis_visibility(event):
    if event.inaxes == ax:
        current_picker = ax.xaxis.get_picker()
        if current_picker:
            ax.xaxis.set_visible(not ax.xaxis.get_visible())
            fig.canvas.draw()

ax.xaxis.set_picker(True)
fig.canvas.mpl_connect('pick_event', toggle_axis_visibility)

plt.show()
Output:
这个例子展示了如何结合get_picker()和set_visible()方法来切换x轴的可见性。当x轴被点击时,它会在可见和不可见状态之间切换。
4.2 结合set_label()使用
import matplotlib.pyplot as plt

fig, ax = plt.subplots()
ax.plot([1, 2, 3, 4], [1, 4, 2, 3], label='how2matplotlib.com')

def update_axis_label(event):
    if event.inaxes == ax:
        current_picker = ax.xaxis.get_picker()
        if current_picker:
            new_label = f"Picked at x={event.xdata:.2f}"
            ax.xaxis.set_label_text(new_label)
            fig.canvas.draw()

ax.xaxis.set_picker(True)
fig.canvas.mpl_connect('pick_event', update_axis_label)

plt.show()
Output:
这个例子展示了如何结合get_picker()和set_label_text()方法来动态更新x轴的标签。当x轴被点击时,标签会更新为点击位置的x坐标。
5. get_picker()在自定义事件处理中的应用
get_picker()函数在自定义事件处理中非常有用,特别是当您需要根据不同的拾取器设置来执行不同的操作时。
5.1 自定义点击事件处理
import matplotlib.pyplot as plt

fig, ax = plt.subplots()
ax.plot([1, 2, 3, 4], [1, 4, 2, 3], label='how2matplotlib.com')

def on_click(event):
    if event.inaxes == ax:
        x_picker = ax.xaxis.get_picker()
        y_picker = ax.yaxis.get_picker()

        if x_picker and event.ydata is None:
            print(f"Clicked on x-axis at x={event.xdata:.2f}")
        elif y_picker and event.xdata is None:
            print(f"Clicked on y-axis at y={event.ydata:.2f}")
        else:
            print(f"Clicked inside plot area at ({event.xdata:.2f}, {event.ydata:.2f})")

ax.xaxis.set_picker(True)
ax.yaxis.set_picker(True)
fig.canvas.mpl_connect('button_press_event', on_click)

plt.show()
Output:
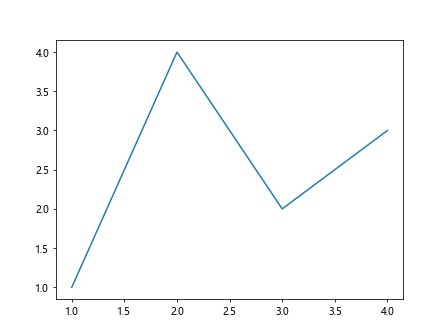
这个例子展示了如何使用get_picker()来创建自定义的点击事件处理器。根据点击的位置和轴的拾取器设置,会打印不同的信息。
5.2 拖拽轴标签
import matplotlib.pyplot as plt

fig, ax = plt.subplots()
ax.plot([1, 2, 3, 4], [1, 4, 2, 3], label='how2matplotlib.com')

drag_start = None

def on_press(event):
    global drag_start
    if ax.xaxis.get_picker() and event.inaxes == ax:
        drag_start = event.xdata

def on_release(event):
    global drag_start
    if drag_start is not None:
        drag_end = event.xdata
        offset = drag_end - drag_start
        current_position = ax.xaxis.get_label().get_position()
        ax.xaxis.get_label().set_position((current_position[0] + offset, current_position[1]))
        fig.canvas.draw()
        drag_start = None

ax.xaxis.set_picker(True)
fig.canvas.mpl_connect('button_press_event', on_press)
fig.canvas.mpl_connect('button_release_event', on_release)

plt.show()
Output:
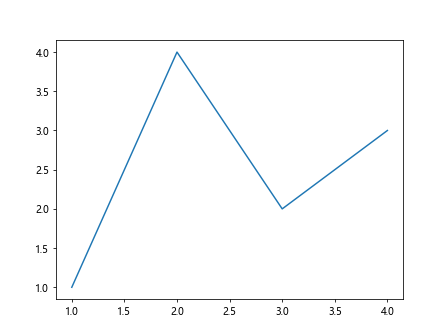
这个例子展示了如何使用get_picker()来实现x轴标签的拖拽功能。当x轴可被拾取时,用户可以通过拖拽来移动x轴标签的位置。
6. get_picker()在动画中的应用
get_picker()函数也可以在动画中发挥作用,允许您创建交互式的动画效果。
6.1 动画轴标记
import matplotlib.pyplot as plt
import matplotlib.animation as animation

fig, ax = plt.subplots()
ax.plot([1, 2, 3, 4], [1, 4, 2, 3], label='how2matplotlib.com')

highlight = plt.axvline(x=1, color='r', linestyle='--', visible=False)

def animate(frame):
    if ax.xaxis.get_picker():
        highlight.set_xdata(frame)
        highlight.set_visible(True)
    else:
        highlight.set_visible(False)
    return highlight,

def toggle_animation(event):
    current_picker = ax.xaxis.get_picker()
    ax.xaxis.set_picker(not current_picker)

ax.xaxis.set_picker(True)
fig.canvas.mpl_connect('button_press_event', toggle_animation)

ani = animation.FuncAnimation(fig, animate, frames=np.linspace(1, 4, 100),
                              interval=50, blit=True)

plt.show()
这个例子展示了如何使用get_picker()来控制动画效果。当x轴可被拾取时,一个红色的垂直线会在x轴上来回移动。点击图表可以切换动画的开启和关闭。
6.2 交互式数据更新
import matplotlib.pyplot as plt
import matplotlib.animation as animation
import numpy as np

fig, ax = plt.subplots()
line, = ax.plot([], [], label='how2matplotlib.com')
ax.set_xlim(0, 10)
ax.set_ylim(-1, 1)

def animate(frame):
    if ax.xaxis.get_picker():
        x = np.linspace(0, 10, 100)
        y = np.sin(x + frame/10)
        line.set_data(x, y)
    return line,

def toggle_animation(event):
    current_picker = ax.xaxis.get_picker()
    ax.xaxis.set_picker(not current_picker)
    if current_picker:
        line.set_data([], [])

ax.xaxis.set_picker(True)
fig.canvas.mpl_connect('button_press_event', toggle_animation)

ani = animation.FuncAnimation(fig, animate, frames=100, interval=50, blit=True)

plt.show()
Output:
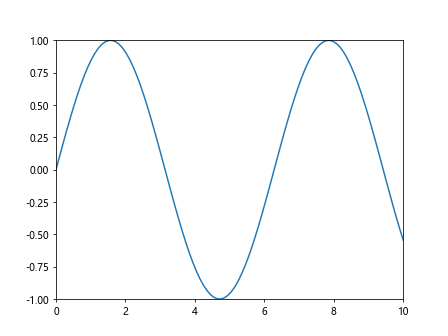
这个例子展示了如何使用get_picker()来控制数据的动态更新。当x轴可被拾取时,正弦波会动态更新。点击图表可以暂停或继续动画。
7. get_picker()在多图表环境中的应用
在复杂的可视化场景中,我们经常需要处理多个图表。get_picker()函数在这种情况下也能发挥重要作用。
7.1 多子图拾取器同步
import matplotlib.pyplot as plt

fig, (ax1, ax2) = plt.subplots(1, 2, figsize=(10, 4))
ax1.plot([1, 2, 3, 4], [1, 4, 2, 3], label='how2matplotlib.com')
ax2.plot([1, 2, 3, 4], [3, 1, 4, 2], label='how2matplotlib.com')

def sync_pickers(event):
    if event.inaxes in (ax1, ax2):
        current_picker = event.inaxes.xaxis.get_picker()
        new_picker = not current_picker
        ax1.xaxis.set_picker(new_picker)
        ax2.xaxis.set_picker(new_picker)
        print(f"All x-axis pickers set to: {new_picker}")
        fig.canvas.draw()

ax1.xaxis.set_picker(True)
ax2.xaxis.set_picker(True)
fig.canvas.mpl_connect('button_press_event', sync_pickers)

plt.show()
Output:
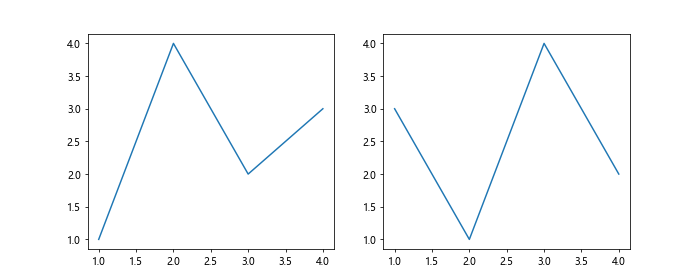
这个例子展示了如何在多个子图之间同步拾取器状态。点击任一子图都会同时切换两个子图的x轴拾取器状态。
7.2 不同子图不同拾取器行为
import matplotlib.pyplot as plt

fig, (ax1, ax2) = plt.subplots(1, 2, figsize=(10, 4))
ax1.plot([1, 2, 3, 4], [1, 4, 2, 3], label='how2matplotlib.com')
ax2.plot([1, 2, 3, 4], [3, 1, 4, 2], label='how2matplotlib.com')

def on_pick(event):
    if event.artist == ax1.xaxis:
        print("Left plot x-axis picked")
        ax1.set_facecolor('lightgray')
    elif event.artist == ax2.xaxis:
        print("Right plot x-axis picked")
        ax2.set_facecolor('lightblue')
    fig.canvas.draw()

ax1.xaxis.set_picker(True)
ax2.xaxis.set_picker(5)  # 5像素的拾取距离
fig.canvas.mpl_connect('pick_event', on_pick)

plt.show()
Output:
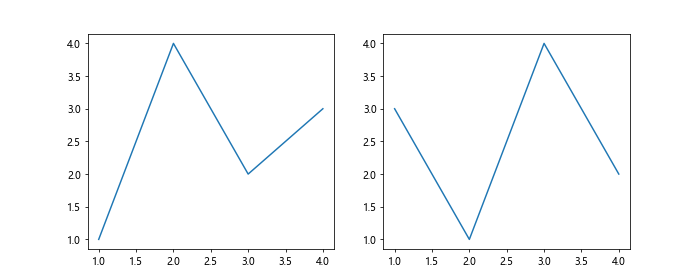
这个例子展示了如何为不同的子图设置不同的拾取器行为。左侧子图的x轴使用布尔型拾取器,右侧子图的x轴使用数值型拾取器。
8. get_picker()与其他Matplotlib组件的交互
get_picker()函数不仅可以用于坐标轴,还可以与Matplotlib的其他组件结合使用,创造出更丰富的交互效果。
8.1 与Legend的交互
import matplotlib.pyplot as plt

fig, ax = plt.subplots()
line, = ax.plot([1, 2, 3, 4], [1, 4, 2, 3], label='how2matplotlib.com')
legend = ax.legend()

def on_pick(event):
    if event.artist == legend:
        if ax.xaxis.get_picker():
            ax.xaxis.set_visible(not ax.xaxis.get_visible())
            fig.canvas.draw()

legend.set_picker(True)
ax.xaxis.set_picker(True)
fig.canvas.mpl_connect('pick_event', on_pick)

plt.show()
Output:
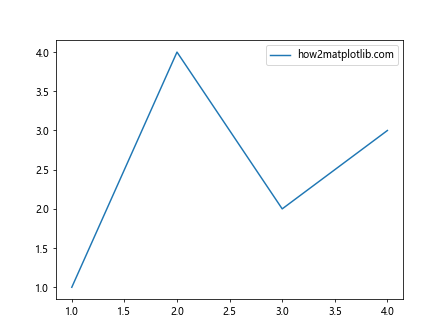
这个例子展示了如何结合使用图例的拾取器和x轴的拾取器。当图例被点击时,如果x轴是可拾取的,则会切换x轴的可见性。
8.2 与Toolbar的交互
import matplotlib.pyplot as plt
from matplotlib.backends.backend_tkagg import NavigationToolbar2Tk

fig, ax = plt.subplots()
ax.plot([1, 2, 3, 4], [1, 4, 2, 3], label='how2matplotlib.com')

def on_tool_clicked(event):
    if event.tool.name == 'Pan':
        current_picker = ax.xaxis.get_picker()
        ax.xaxis.set_picker(not current_picker)
        print(f"X-axis picker set to: {not current_picker}")

toolbar = fig.canvas.toolbar
toolbar.add_tool_callback('pan', on_tool_clicked)

plt.show()
这个例子展示了如何将get_picker()与Matplotlib的工具栏结合使用。当用户点击”平移”工具时,x轴的拾取器状态会切换。
9. get_picker()在数据分析中的应用
get_picker()函数不仅可以用于图形交互,还可以在数据分析过程中发挥重要作用。
9.1 数据点选择
import matplotlib.pyplot as plt
import numpy as np

fig, ax = plt.subplots()
x = np.linspace(0, 10, 100)
y = np.sin(x)
line, = ax.plot(x, y, 'o', picker=5, label='how2matplotlib.com')

selected_points = []

def on_pick(event):
    if ax.xaxis.get_picker():
        ind = event.ind
        selected_points.extend(list(zip(x[ind], y[ind])))
        print(f"Selected points: {selected_points}")

ax.xaxis.set_picker(True)
fig.canvas.mpl_connect('pick_event', on_pick)

plt.show()
Output:
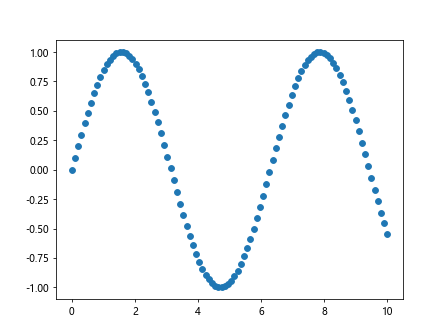
这个例子展示了如何使用get_picker()来实现数据点的选择功能。当x轴可被拾取时,用户可以点击数据点来选择它们。
9.2 区间选择
import matplotlib.pyplot as plt
import numpy as np

fig, ax = plt.subplots()
x = np.linspace(0, 10, 100)
y = np.sin(x)
ax.plot(x, y, label='how2matplotlib.com')

start_x = None
rect = None

def on_press(event):
    global start_x, rect
    if ax.xaxis.get_picker() and event.inaxes == ax:
        start_x = event.xdata
        rect = plt.Rectangle((start_x, ax.get_ylim()[0]), 0, ax.get_ylim()[1] - ax.get_ylim()[0],
                             facecolor='gray', alpha=0.5)
        ax.add_patch(rect)

def on_release(event):
    global start_x, rect
    if start_x is not None:
        end_x = event.xdata
        print(f"Selected interval: [{min(start_x, end_x):.2f}, {max(start_x, end_x):.2f}]")
        rect.remove()
        start_x = None
        fig.canvas.draw()

ax.xaxis.set_picker(True)
fig.canvas.mpl_connect('button_press_event', on_press)
fig.canvas.mpl_connect('button_release_event', on_release)

plt.show()
Output:
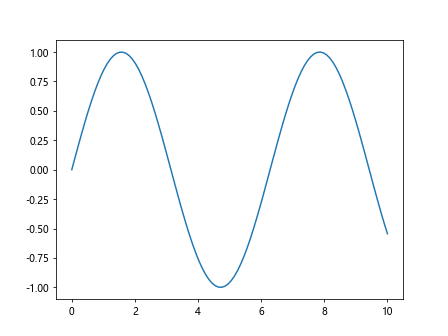
这个例子展示了如何使用get_picker()来实现区间选择功能。当x轴可被拾取时,用户可以通过拖拽来选择一个x轴区间。
10. get_picker()在高级可视化中的应用
get_picker()函数在创建高级可视化效果时也能发挥重要作用,特别是在需要精细控制交互行为的场景中。
10.1 自适应网格线
import matplotlib.pyplot as plt
import numpy as np

fig, ax = plt.subplots()
x = np.linspace(0, 10, 100)
y = np.sin(x)
ax.plot(x, y, label='how2matplotlib.com')

def update_grid(event):
    if ax.xaxis.get_picker():
        current_xticks = ax.get_xticks()
        new_xtick = round(event.xdata, 1)
        if new_xtick not in current_xticks:
            new_xticks = np.sort(np.append(current_xticks, new_xtick))
            ax.set_xticks(new_xticks)
            ax.grid(True)
            fig.canvas.draw()

ax.xaxis.set_picker(True)
fig.canvas.mpl_connect('button_press_event', update_grid)

plt.show()
Output:
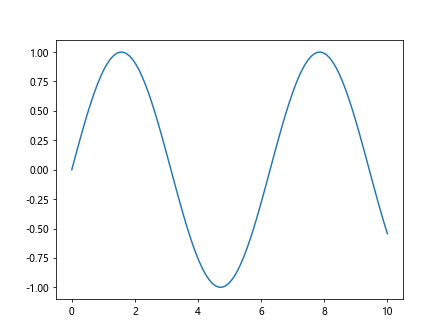
这个例子展示了如何使用get_picker()来创建自适应网格线。当x轴可被拾取时,点击图表会在点击位置添加一个新的网格线。
10.2 动态坐标轴范围调整
import matplotlib.pyplot as plt
import numpy as np

fig, ax = plt.subplots()
x = np.linspace(0, 10, 100)
y = np.sin(x)
ax.plot(x, y, label='how2matplotlib.com')

def adjust_axis_range(event):
    if ax.xaxis.get_picker() and event.inaxes == ax:
        current_xlim = ax.get_xlim()
        new_xlim = (min(current_xlim[0], event.xdata), max(current_xlim[1], event.xdata))
        ax.set_xlim(new_xlim)
        fig.canvas.draw()

ax.xaxis.set_picker(True)
fig.canvas.mpl_connect('button_press_event', adjust_axis_range)

plt.show()
Output:
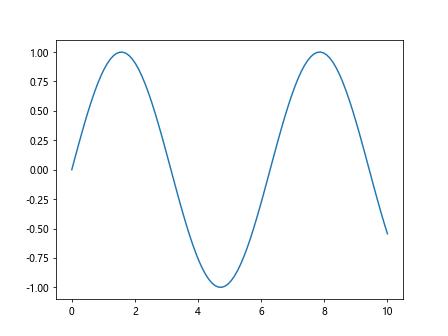
这个例子展示了如何使用get_picker()来实现动态坐标轴范围调整。当x轴可被拾取时,点击图表外的区域会自动扩展x轴的范围。
结论
通过本文的详细介绍和丰富的示例,我们深入探讨了Matplotlib中Axis.get_picker()函数的各种用法和应用场景。这个函数为创建交互式可视化提供了强大的支持,无论是简单的点击事件处理,还是复杂的数据分析工具,get_picker()都能在其中发挥重要作用。
在实际应用中,get_picker()函数常常与其他Matplotlib功能结合使用,如动画、多子图、图例等,以创建更加丰富和动态的可视化效果。通过灵活运用这个函数,开发者可以大大提升用户与图表的交互体验,使数据可视化更加生动和有意义。
 极客笔记
极客笔记