Matplotlib中的Axis.get_children()函数:深入探讨和实践应用
参考:Matplotlib.axis.Axis.get_children() function in Python
Matplotlib是Python中最流行的数据可视化库之一,它提供了丰富的绘图功能和灵活的自定义选项。在Matplotlib的众多功能中,Axis.get_children()函数是一个强大而有用的工具,它允许我们获取轴对象的所有子对象。本文将深入探讨这个函数的用法、应用场景以及相关的实践示例。
1. Axis.get_children()函数简介
Axis.get_children()是Matplotlib库中axis.Axis类的一个方法。这个函数返回一个包含轴对象所有子对象的列表。这些子对象可能包括刻度线、刻度标签、网格线等元素。通过使用这个函数,我们可以轻松地访问和操作这些子对象,从而实现更精细的图表定制。
让我们看一个简单的示例来了解这个函数的基本用法:
import matplotlib.pyplot as plt

# 创建一个简单的图表
fig, ax = plt.subplots()
ax.plot([1, 2, 3, 4], [1, 4, 2, 3], label='how2matplotlib.com')

# 获取x轴的所有子对象
x_axis_children = ax.xaxis.get_children()

# 打印子对象的数量
print(f"X轴子对象数量: {len(x_axis_children)}")

plt.show()
Output:
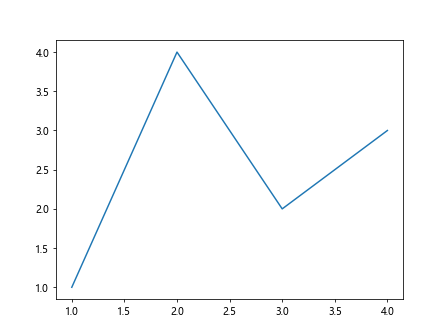
在这个例子中,我们创建了一个简单的线图,然后使用get_children()函数获取了x轴的所有子对象。这个函数返回一个列表,我们可以通过查看列表的长度来了解子对象的数量。
2. 子对象的类型和属性
Axis.get_children()返回的子对象可能包括多种类型,每种类型都有其特定的属性和方法。以下是一些常见的子对象类型:
matplotlib.axis.Tick: 表示轴上的刻度。matplotlib.text.Text: 表示刻度标签或其他文本元素。matplotlib.lines.Line2D: 表示网格线或其他线条元素。
让我们通过一个示例来探索这些子对象:
import matplotlib.pyplot as plt

fig, ax = plt.subplots()
ax.plot([1, 2, 3, 4], [1, 4, 2, 3], label='how2matplotlib.com')

# 获取y轴的所有子对象
y_axis_children = ax.yaxis.get_children()

# 遍历并打印每个子对象的类型
for child in y_axis_children:
    print(f"子对象类型: {type(child).__name__}")

plt.show()
Output:
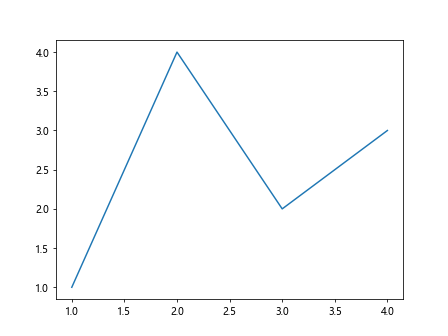
这个例子展示了如何遍历y轴的所有子对象并打印它们的类型。通过这种方式,我们可以更好地理解轴对象的结构和组成。
3. 使用get_children()自定义刻度
Axis.get_children()函数的一个常见应用是自定义轴的刻度。我们可以通过获取刻度对象来修改它们的属性,如颜色、大小或可见性。下面是一个示例:
import matplotlib.pyplot as plt

fig, ax = plt.subplots()
ax.plot([1, 2, 3, 4], [1, 4, 2, 3], label='how2matplotlib.com')

# 获取x轴的所有子对象
x_axis_children = ax.xaxis.get_children()

# 修改刻度的颜色和大小
for child in x_axis_children:
    if isinstance(child, plt.Text):
        child.set_color('red')
        child.set_fontsize(14)

plt.show()
Output:
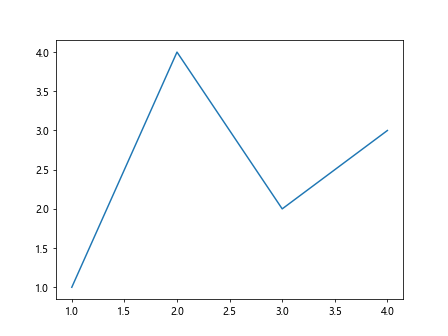
在这个例子中,我们遍历x轴的所有子对象,找出文本对象(刻度标签),然后将它们的颜色设置为红色,字体大小设置为14。这种方法允许我们对特定类型的子对象进行精细的控制。
4. 隐藏特定的刻度标签
有时,我们可能想要隐藏某些特定的刻度标签。Axis.get_children()函数可以帮助我们实现这一目标。以下是一个示例:
import matplotlib.pyplot as plt

fig, ax = plt.subplots()
ax.plot([1, 2, 3, 4, 5], [1, 4, 2, 3, 5], label='how2matplotlib.com')

# 获取x轴的所有子对象
x_axis_children = ax.xaxis.get_children()

# 隐藏偶数位置的刻度标签
for i, child in enumerate(x_axis_children):
    if isinstance(child, plt.Text) and i % 2 == 0:
        child.set_visible(False)

plt.show()
Output:
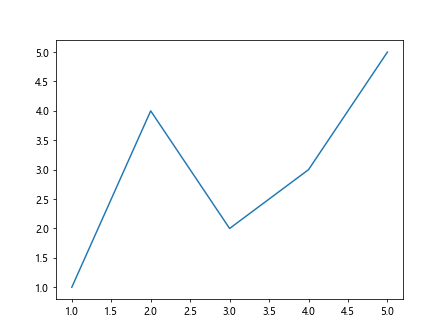
在这个例子中,我们遍历x轴的所有子对象,并将偶数位置的刻度标签设置为不可见。这种技术可以用于减少刻度标签的密度,使图表更加清晰。
5. 自定义网格线
Axis.get_children()函数还可以用于自定义网格线。我们可以通过获取网格线对象来修改它们的样式。下面是一个示例:
import matplotlib.pyplot as plt

fig, ax = plt.subplots()
ax.plot([1, 2, 3, 4], [1, 4, 2, 3], label='how2matplotlib.com')
ax.grid(True)

# 获取所有子对象
all_children = ax.get_children()

# 修改网格线的样式
for child in all_children:
    if isinstance(child, plt.Line2D) and child.get_linestyle() == ':':
        child.set_linestyle('--')
        child.set_color('red')
        child.set_alpha(0.5)

plt.show()
Output:
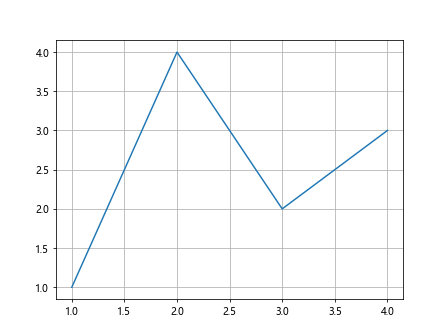
在这个例子中,我们首先启用网格,然后遍历所有子对象。我们找出代表网格线的Line2D对象(通过检查线型是否为点线),然后将它们的样式修改为虚线,颜色设置为红色,并设置透明度。
6. 添加自定义注释
Axis.get_children()函数还可以帮助我们在图表中添加自定义注释。我们可以获取现有的文本对象,并使用它们的位置信息来放置新的注释。以下是一个示例:
import matplotlib.pyplot as plt

fig, ax = plt.subplots()
ax.plot([1, 2, 3, 4], [1, 4, 2, 3], label='how2matplotlib.com')

# 获取y轴的所有子对象
y_axis_children = ax.yaxis.get_children()

# 在每个刻度标签旁添加自定义注释
for child in y_axis_children:
    if isinstance(child, plt.Text):
        x, y = child.get_position()
        ax.annotate(f"Note: {child.get_text()}", (x, y), xytext=(5, 0),
                    textcoords='offset points', fontsize=8, color='green')

plt.show()
Output:
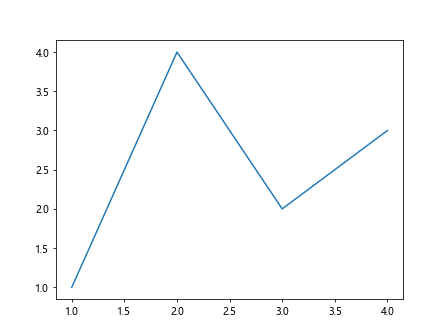
在这个例子中,我们遍历y轴的所有子对象,找出文本对象(刻度标签),然后在每个标签旁边添加一个自定义的注释。这种技术可以用于为图表添加额外的信息或解释。
7. 修改刻度线的属性
除了刻度标签,我们还可以使用Axis.get_children()函数来修改刻度线的属性。以下是一个示例:
import matplotlib.pyplot as plt

fig, ax = plt.subplots()
ax.plot([1, 2, 3, 4], [1, 4, 2, 3], label='how2matplotlib.com')

# 获取x轴的所有子对象
x_axis_children = ax.xaxis.get_children()

# 修改刻度线的长度和宽度
for child in x_axis_children:
    if isinstance(child, plt.Line2D):
        child.set_markersize(20)  # 设置刻度线长度
        child.set_markeredgewidth(2)  # 设置刻度线宽度

plt.show()
Output:
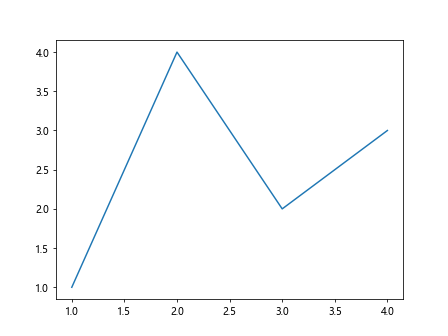
在这个例子中,我们遍历x轴的所有子对象,找出Line2D对象(代表刻度线),然后修改它们的长度和宽度。这种方法可以用于强调某些刻度,或者simply改变图表的整体外观。
8. 创建自定义刻度装饰器
Axis.get_children()函数还可以用于创建自定义的刻度装饰器。我们可以获取现有的刻度对象,并在它们的位置添加自定义的图形元素。以下是一个示例:
import matplotlib.pyplot as plt
import matplotlib.patches as patches

fig, ax = plt.subplots()
ax.plot([1, 2, 3, 4], [1, 4, 2, 3], label='how2matplotlib.com')

# 获取x轴的所有子对象
x_axis_children = ax.xaxis.get_children()

# 在每个刻度位置添加一个小圆圈
for child in x_axis_children:
    if isinstance(child, plt.Text):
        x, y = child.get_position()
        circle = patches.Circle((x, 0), 0.05, fill=False, transform=ax.transAxes)
        ax.add_patch(circle)

plt.show()
Output:
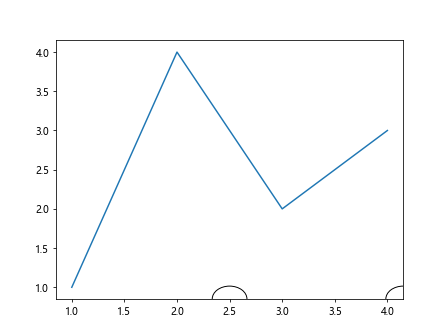
在这个例子中,我们遍历x轴的所有子对象,找出文本对象(刻度标签),然后在每个刻度的位置添加一个小圆圈。这种技术可以用于创建独特的视觉效果或强调某些刻度位置。
9. 动态调整子对象的可见性
Axis.get_children()函数还可以用于动态调整子对象的可见性。这在创建交互式图表时特别有用。以下是一个示例:
import matplotlib.pyplot as plt

fig, ax = plt.subplots()
ax.plot([1, 2, 3, 4], [1, 4, 2, 3], label='how2matplotlib.com')

# 获取y轴的所有子对象
y_axis_children = ax.yaxis.get_children()

# 定义一个函数来切换刻度标签的可见性
def toggle_labels(event):
    for child in y_axis_children:
        if isinstance(child, plt.Text):
            child.set_visible(not child.get_visible())
    fig.canvas.draw()

# 连接鼠标点击事件
fig.canvas.mpl_connect('button_press_event', toggle_labels)

plt.show()
Output:
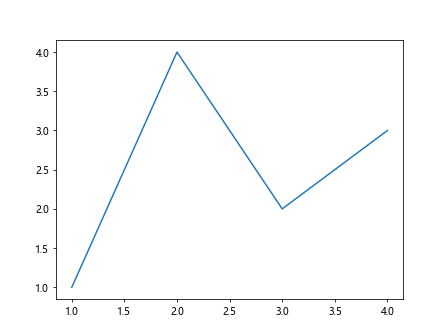
在这个例子中,我们定义了一个函数来切换y轴刻度标签的可见性。每次点击图表时,这个函数都会被调用,从而实现刻度标签的显示和隐藏。这种技术可以用于创建更加交互式的图表。
10. 自定义轴线样式
Axis.get_children()函数还可以用于自定义轴线的样式。我们可以获取代表轴线的对象,并修改其属性。以下是一个示例:
import matplotlib.pyplot as plt

fig, ax = plt.subplots()
ax.plot([1, 2, 3, 4], [1, 4, 2, 3], label='how2matplotlib.com')

# 获取所有子对象
all_children = ax.get_children()

# 修改轴线的样式
for child in all_children:
    if isinstance(child, plt.Spine):
        child.set_linewidth(2)
        child.set_color('red')

plt.show()
在这个例子中,我们遍历所有子对象,找出Spine对象(代表轴线),然后修改它们的宽度和颜色。这种方法可以用于强调轴线或改变图表的整体外观。
11. 创建自定义刻度标记
Axis.get_children()函数还可以用于创建自定义的刻度标记。我们可以获取现有的刻度对象,并在它们的位置添加自定义的图形元素。以下是一个示例:
import matplotlib.pyplot as plt
import matplotlib.patches as patches

fig, ax = plt.subplots()
ax.plot([1, 2, 3, 4], [1, 4, 2, 3], label='how2matplotlib.com')

# 获取x轴的所有子对象
x_axis_children = ax.xaxis.get_children()

# 在每个刻度位置添加一个小三角形
for child in x_axis_children:
    if isinstance(child, plt.Text):
        x, y = child.get_position()
        triangle = patches.RegularPolygon((x, 0), 3, 0.05, fill=False, transform=ax.transAxes)
        ax.add_patch(triangle)

plt.show()
在这个例子中,我们遍历x轴的所有子对象,找出文本对象(刻度标签),然后在每个刻度的位置添加一个小三角形。这种技术可以用于创建独特的刻度标记或强调某些刻度位置。
12. 动态调整子对象的颜色
Axis.get_children()函数还可以用于动态调整子对象的颜色。这在创建响应用户输入的交互式图表时特别有用。以下是一个示例:
import matplotlib.pyplot as plt
import numpy as np

fig, ax = plt.subplots()
ax.plot([1, 2, 3, 4], [1, 4, 2, 3], label='how2matplotlib.com')

# 获取y轴的所有子对象
y_axis_children = ax.yaxis.get_children()

# 定义一个函数来随机改变刻度标签的颜色
def change_colors(event):
    for child in y_axis_children:
        if isinstance(child, plt.Text):
            child.set_color(np.random.rand(3,))
    fig.canvas.draw()

# 连接鼠标点击事件
fig.canvas.mpl_connect('button_press_event', change_colors)

plt.show()
在这个例子中,我们定义了一个函数来随机改变y轴刻度标签的颜色。每次点击图表时,这个函数都会被调用,从而实现刻度标签颜色的动态变化。这种技术可以用于创建更加生动和互动的图表。
13. 自定义刻度标签的旋转
Axis.get_children()函数还可以用于自定义刻度标签的旋转角度。这在处理长文本标签或密集刻度时特别有用。以下是一个示例:
import matplotlib.pyplot as plt

fig, ax = plt.subplots()
ax.plot([1, 2, 3, 4], [1, 4, 2, 3], label='how2matplotlib.com')

# 获取x轴的所有子对象
x_axis_children = ax.xaxis.get_children()

# 旋转刻度标签
for child in x_axis_children:
    if isinstance(child, plt.Text):
        child.set_rotation(45)
        child.set_ha('right')

plt.tight_layout()
plt.show()
在这个例子中,我们遍历x轴的所有子对象,找出文本对象(刻度标签),然后将它们旋转45度。这种技术可以用于改善标签的可读性,特别是当标签文本较长或刻度密集时。
14. 添加自定义刻度线
Axis.get_children()函数还可以用于添加自定义的刻度线。我们可以获取现有的刻度对象的位置信息,然后在这些位置添加自定义的线条。以下是一个示例:
import matplotlib.pyplot as plt

fig, ax = plt.subplots()
ax.plot([1, 2, 3, 4], [1, 4, 2, 3], label='how2matplotlib.com')

# 获取y轴的所有子对象
y_axis_children = ax.yaxis.get_children()

# 添加自定义刻度线
for child in y_axis_children:
    if isinstance(child, plt.Text):
        y = child.get_position()[1]
        ax.axhline(y, color='red', linestyle='--', linewidth=0.5, xmax=0.05)

plt.show()
在这个例子中,我们遍历y轴的所有子对象,找出文本对象(刻度标签),然后在每个刻度的位置添加一条短的水平线。这种技术可以用于强调某些刻度位置或创建自定义的刻度线样式。
15. 创建动态刻度标签
Axis.get_children()函数还可以用于创建动态的刻度标签。我们可以获取现有的刻度对象,并根据某些条件动态更新它们的文本。以下是一个示例:
import matplotlib.pyplot as plt

fig, ax = plt.subplots()
ax.plot([1, 2, 3, 4], [1, 4, 2, 3], label='how2matplotlib.com')

# 获取x轴的所有子对象
x_axis_children = ax.xaxis.get_children()

# 定义一个函数来更新刻度标签
def update_labels(event):
    for child in x_axis_children:
        if isinstance(child, plt.Text):
            value = float(child.get_text())
            child.set_text(f"{value:.2f}")
    fig.canvas.draw()

# 连接鼠标点击事件
fig.canvas.mpl_connect('button_press_event', update_labels)

plt.show()
在这个例子中,我们定义了一个函数来更新x轴刻度标签的格式。每次点击图表时,这个函数都会被调用,将刻度标签更新为保留两位小数的格式。这种技术可以用于创建根据用户交互动态变化的刻度标签。
16. 自定义刻度标签的字体样式
Axis.get_children()函数还可以用于自定义刻度标签的字体样式。我们可以获取文本对象并修改它们的字体属性。以下是一个示例:
import matplotlib.pyplot as plt

fig, ax = plt.subplots()
ax.plot([1, 2, 3, 4], [1, 4, 2, 3], label='how2matplotlib.com')

# 获取y轴的所有子对象
y_axis_children = ax.yaxis.get_children()

# 自定义刻度标签的字体样式
for child in y_axis_children:
    if isinstance(child, plt.Text):
        child.set_fontname('Times New Roman')
        child.set_fontweight('bold')
        child.set_fontstyle('italic')

plt.show()
在这个例子中,我们遍历y轴的所有子对象,找出文本对象(刻度标签),然后修改它们的字体名称、粗细和样式。这种技术可以用于创建更加个性化的图表样式。
结论
通过本文的详细探讨,我们可以看到Axis.get_children()函数在Matplotlib中的强大功能和灵活应用。这个函数允许我们访问和操作轴对象的各种子元素,包括刻度线、刻度标签、网格线等。通过结合其他Matplotlib功能,我们可以实现高度自定义的图表设计,包括动态交互、自定义样式和精细控制。
Axis.get_children()函数的应用范围非常广泛,从简单的样式调整到复杂的交互式图表设计都可以实现。它为数据可视化提供了更多的可能性,使得我们能够创建更加丰富、直观和个性化的图表。
在实际应用中,我们可以根据具体需求,灵活运用Axis.get_children()函数来实现各种图表定制。无论是科学研究、数据分析还是商业报告,这个函数都能帮助我们创建出更加专业和吸引人的可视化效果。
总之,掌握Axis.get_children()函数的使用,将极大地提升我们使用Matplotlib进行数据可视化的能力,让我们能够创造出更加精美和富有表现力的图表。
 极客笔记
极客笔记