Matplotlib中Axes对象属性的全面探索与应用
参考:Matplotlib.axes.Axes.properties() in Python
Matplotlib是Python中最流行的数据可视化库之一,而Axes对象是Matplotlib中最核心的组件之一。本文将深入探讨Matplotlib中Axes对象的属性,通过Axes.properties()方法来全面了解和应用这些属性,帮助读者更好地掌握Matplotlib的图表定制能力。
1. Axes对象简介
在Matplotlib中,Axes对象代表了一个独立的坐标系统,它包含了绘图区域、坐标轴、标题等元素。理解和掌握Axes对象的属性对于创建精确、美观的图表至关重要。
让我们首先创建一个简单的Axes对象:
import matplotlib.pyplot as plt

fig, ax = plt.subplots()
ax.set_title("Welcome to how2matplotlib.com")
plt.show()
Output:

这段代码创建了一个包含单个Axes对象的图形。我们使用set_title()方法为Axes添加了一个标题。
2. Axes.properties()方法介绍
Axes.properties()是一个强大的方法,它返回一个包含Axes对象所有属性的字典。这个方法对于了解Axes对象的当前状态、调试和复制Axes对象非常有用。
让我们看一个简单的例子:
import matplotlib.pyplot as plt

fig, ax = plt.subplots()
ax.set_title("Exploring Axes properties at how2matplotlib.com")
props = ax.properties()
print(props)
plt.show()
Output:
这段代码会打印出Axes对象的所有属性。输出可能会很长,因为Axes对象有许多属性。
3. 常用Axes属性探索
3.1 标题属性
Axes对象的标题可以通过title属性访问和修改:
import matplotlib.pyplot as plt

fig, ax = plt.subplots()
ax.set_title("Original Title from how2matplotlib.com")
props = ax.properties()
print(f"Original title: {props['title']}")

ax.set_title("Updated Title from how2matplotlib.com", fontsize=16, color='red')
props = ax.properties()
print(f"Updated title: {props['title']}")

plt.show()
Output:
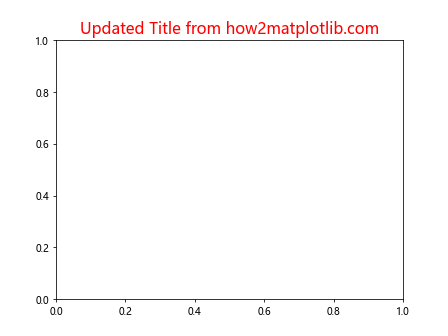
这个例子展示了如何设置和更新Axes的标题,并通过properties()方法查看更改。
3.2 坐标轴属性
Axes对象包含x轴和y轴,每个轴都有自己的一系列属性:
import matplotlib.pyplot as plt

fig, ax = plt.subplots()
ax.set_xlim(0, 10)
ax.set_ylim(0, 100)
ax.set_xlabel("X-axis label from how2matplotlib.com")
ax.set_ylabel("Y-axis label from how2matplotlib.com")

props = ax.properties()
print(f"X-axis limits: {props['xlim']}")
print(f"Y-axis limits: {props['ylim']}")
print(f"X-axis label: {props['xlabel']}")
print(f"Y-axis label: {props['ylabel']}")

plt.show()
Output:
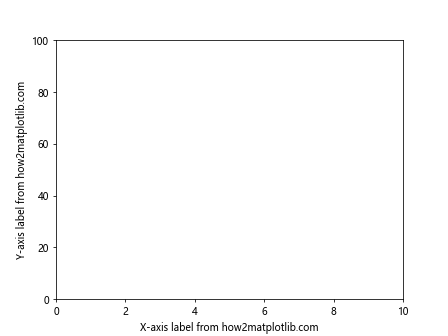
这个例子展示了如何设置坐标轴的范围和标签,并通过properties()方法查看这些属性。
3.3 网格属性
Axes对象的网格可以通过grid属性控制:
import matplotlib.pyplot as plt

fig, ax = plt.subplots()
ax.grid(True, linestyle='--', alpha=0.7)
ax.set_title("Grid properties demo from how2matplotlib.com")

props = ax.properties()
print(f"Grid visible: {props['xgrid']['grid_lines'].get_visible()}")
print(f"Grid line style: {props['xgrid']['grid_lines'].get_linestyle()}")

plt.show()
这个例子展示了如何设置网格的可见性、线型和透明度,并通过properties()方法查看这些属性。
4. 高级Axes属性应用
4.1 图例属性
图例是Axes对象的重要组成部分,可以通过legend属性进行控制:
import matplotlib.pyplot as plt

fig, ax = plt.subplots()
ax.plot([1, 2, 3], [1, 4, 9], label="Curve 1")
ax.plot([1, 2, 3], [1, 2, 3], label="Curve 2")
ax.legend(title="Legend from how2matplotlib.com")

props = ax.properties()
print(f"Legend visible: {props['legend'].get_visible()}")
print(f"Legend title: {props['legend'].get_title().get_text()}")

plt.show()
Output:
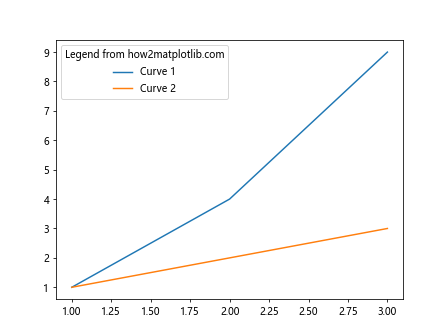
这个例子展示了如何添加图例并设置图例标题,然后通过properties()方法查看图例的属性。
4.2 刻度属性
坐标轴的刻度是Axes对象的重要组成部分,可以通过多种方式进行自定义:
import matplotlib.pyplot as plt

fig, ax = plt.subplots()
ax.set_xticks([0, 0.5, 1])
ax.set_yticks([0, 50, 100])
ax.set_xticklabels(['Low', 'Medium', 'High'])
ax.set_yticklabels(['0%', '50%', '100%'])
ax.set_title("Tick properties demo from how2matplotlib.com")

props = ax.properties()
print(f"X-axis ticks: {props['xticks']}")
print(f"Y-axis ticks: {props['yticks']}")
print(f"X-axis tick labels: {[label.get_text() for label in props['xaxis'].get_ticklabels()]}")
print(f"Y-axis tick labels: {[label.get_text() for label in props['yaxis'].get_ticklabels()]}")

plt.show()
Output:
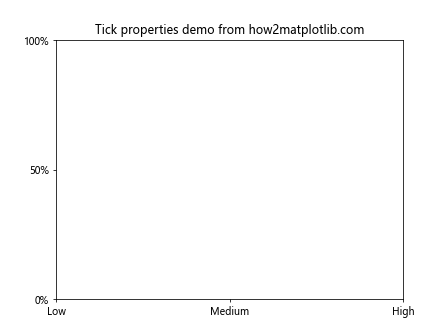
这个例子展示了如何自定义坐标轴的刻度位置和标签,并通过properties()方法查看这些属性。
4.3 样式属性
Axes对象的样式可以通过多种方式进行自定义,包括背景色、边框等:
import matplotlib.pyplot as plt

fig, ax = plt.subplots()
ax.set_facecolor('#f0f0f0')
ax.spines['top'].set_visible(False)
ax.spines['right'].set_visible(False)
ax.set_title("Style properties demo from how2matplotlib.com")

props = ax.properties()
print(f"Axes face color: {props['facecolor']}")
print(f"Top spine visible: {props['spines']['top'].get_visible()}")
print(f"Right spine visible: {props['spines']['right'].get_visible()}")

plt.show()
这个例子展示了如何设置Axes的背景色和隐藏上方和右侧的边框,并通过properties()方法查看这些属性。
5. 动态修改Axes属性
Axes对象的属性可以在创建后动态修改,这对于创建交互式图表或动画非常有用:
import matplotlib.pyplot as plt
import numpy as np

fig, ax = plt.subplots()
x = np.linspace(0, 10, 100)
line, = ax.plot(x, np.sin(x))
ax.set_title("Dynamic property change demo from how2matplotlib.com")

for i in range(5):
    ax.set_ylim(-1 - i*0.2, 1 + i*0.2)
    props = ax.properties()
    print(f"Iteration {i+1}, Y-axis limits: {props['ylim']}")
    plt.pause(1)

plt.show()
Output:
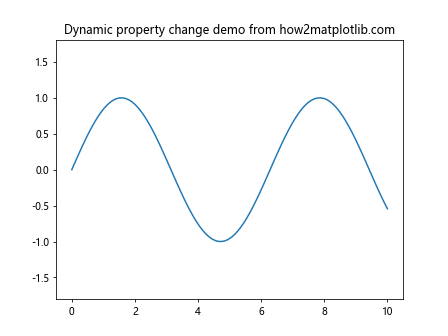
这个例子展示了如何动态修改Y轴的范围,并在每次修改后通过properties()方法查看更新后的属性。
6. 子图属性管理
当创建多个子图时,管理每个Axes对象的属性变得更加重要:
import matplotlib.pyplot as plt

fig, (ax1, ax2) = plt.subplots(1, 2, figsize=(10, 5))
ax1.set_title("Subplot 1 from how2matplotlib.com")
ax2.set_title("Subplot 2 from how2matplotlib.com")

for i, ax in enumerate([ax1, ax2], 1):
    props = ax.properties()
    print(f"Subplot {i} title: {props['title']}")

plt.tight_layout()
plt.show()
Output:

这个例子创建了两个子图,并展示了如何访问和打印每个子图的标题属性。
7. 使用properties()进行Axes对象的复制
properties()方法返回的字典可以用于创建Axes对象的精确副本:
import matplotlib.pyplot as plt
import numpy as np

fig, (ax1, ax2) = plt.subplots(1, 2, figsize=(10, 5))

x = np.linspace(0, 10, 100)
ax1.plot(x, np.sin(x))
ax1.set_title("Original plot from how2matplotlib.com")
ax1.set_xlabel("X-axis")
ax1.set_ylabel("Y-axis")
ax1.grid(True)

props = ax1.properties()
for key, value in props.items():
    try:
        setattr(ax2, key, value)
    except:
        pass

ax2.set_title("Copied plot from how2matplotlib.com")
ax2.plot(x, np.cos(x))

plt.tight_layout()
plt.show()
这个例子展示了如何使用properties()方法复制一个Axes对象的属性到另一个Axes对象。
8. 使用properties()进行调试
properties()方法在调试过程中非常有用,可以帮助我们理解Axes对象的当前状态:
import matplotlib.pyplot as plt
import numpy as np

fig, ax = plt.subplots()
x = np.linspace(0, 10, 100)
ax.plot(x, np.sin(x))
ax.set_title("Debugging with properties() from how2matplotlib.com")

props = ax.properties()
print("Axes properties for debugging:")
for key, value in props.items():
    print(f"{key}: {value}")

plt.show()
这个例子展示了如何使用properties()方法打印出Axes对象的所有属性,这在调试复杂图表时非常有用。
9. 属性的批量修改
使用properties()方法,我们可以批量修改多个Axes对象的属性:
import matplotlib.pyplot as plt
import numpy as np

fig, axes = plt.subplots(2, 2, figsize=(10, 10))
axes = axes.flatten()

for ax in axes:
    x = np.linspace(0, 10, 100)
    ax.plot(x, np.random.rand(100))

template_ax = axes[0]
template_ax.set_title("Template from how2matplotlib.com")
template_ax.set_xlabel("X-axis")
template_ax.set_ylabel("Y-axis")
template_ax.grid(True)

props = template_ax.properties()

for ax in axes[1:]:
    for key, value in props.items():
        try:
            setattr(ax, key, value)
        except:
            pass
    ax.set_title(f"Copied plot {axes.tolist().index(ax)+1}")

plt.tight_layout()
plt.show()
这个例子展示了如何使用一个模板Axes对象的属性来批量设置其他Axes对象的属性。
10. 自定义属性与properties()方法
虽然properties()方法主要用于访问Axes对象的内置属性,但我们也可以添加自定义属性:
import matplotlib.pyplot as plt

fig, ax = plt.subplots()
ax.set_title("Custom properties demo from how2matplotlib.com")

# 添加自定义属性
ax.custom_property = "This is a custom property"

# 使用properties()方法
props = ax.properties()
print("Built-in properties:")
for key, value in props.items():
    print(f"{key}: {value}")

print("\nCustom property:")
print(f"custom_property: {ax.custom_property}")

plt.show()
Output:
这个例子展示了如何添加自定义属性到Axes对象,并说明了properties()方法不会返回这些自定义属性。
结论
通过本文的详细探讨,我们深入了解了Matplotlib中Axes对象的属性以及properties()方法的强大功能。从基本的标题和坐标轴设置,到高级的图例和刻度定制,再到动态修改和批量管理,properties()方法为我们提供了一个全面了解和控制Axes对象的工具。
掌握这些知识将使你能够创建更精确、更美观的图表,并在调试和开发过程中更有效地管理Axes对象的属性。无论是简单的数据可视化还是复杂的科学绘图,深入理解Axes对象的属性都将大大提升你的Matplotlib使用技能。
记住,虽然properties()方法提供了对Axes对象属性的全面访问,但在实际应用中,直接使用专门的方法(如set_title()、set_xlabel()等)来修改特定属性通常更为方便和直观。properties()方法的真正威力在于它提供了一种查看和复制Axes对象完整状态的方式,这在创建模板、调试和高级定制时特别有用。
继续探索和实践,你将发现Matplotlib及其Axes对象还有更多令人兴奋的特性等待你去发掘!
 极客笔记
极客笔记