Matplotlib中使用get_figure()方法获取Figure对象的完整指南
参考:Matplotlib.axes.Axes.get_figure() in Python
Matplotlib是Python中最流行的数据可视化库之一,它提供了丰富的绘图功能和灵活的API。在Matplotlib中,Figure和Axes是两个核心概念。Figure代表整个图形窗口,而Axes则是图形中的一个绘图区域。本文将详细介绍Matplotlib中的Axes.get_figure()方法,这是一个非常有用的工具,可以帮助我们从Axes对象获取其所属的Figure对象。
1. get_figure()方法简介
get_figure()是Matplotlib库中Axes类的一个方法。这个方法的主要作用是返回包含当前Axes对象的Figure对象。换句话说,它允许我们从一个Axes实例获取其父级Figure实例。
这个方法的语法非常简单:
figure = axes.get_figure()
其中,axes是一个Axes对象,figure是返回的Figure对象。
让我们通过一个简单的例子来看看如何使用get_figure()方法:
import matplotlib.pyplot as plt

# 创建一个Figure和一个Axes
fig, ax = plt.subplots()

# 在Axes上绘制一些数据
ax.plot([1, 2, 3, 4], [1, 4, 2, 3], label='Data from how2matplotlib.com')

# 使用get_figure()方法获取Figure对象
figure = ax.get_figure()

# 设置Figure的标题
figure.suptitle('Figure created using how2matplotlib.com')

plt.show()
Output:
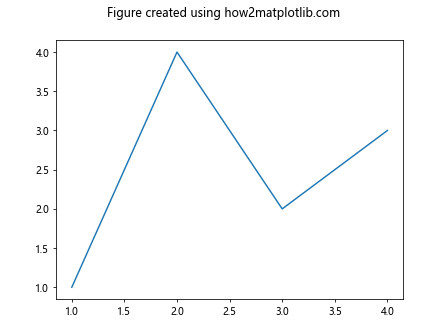
在这个例子中,我们首先创建了一个Figure和一个Axes,然后在Axes上绘制了一些数据。接着,我们使用get_figure()方法从Axes对象获取了Figure对象,并设置了Figure的标题。
2. get_figure()方法的应用场景
get_figure()方法在许多情况下都非常有用。以下是一些常见的应用场景:
2.1 设置Figure属性
当我们只有Axes对象的引用,但需要设置整个Figure的属性时,get_figure()方法就派上用场了。例如:
import matplotlib.pyplot as plt

# 创建子图
fig, (ax1, ax2) = plt.subplots(1, 2, figsize=(10, 5))

# 在子图上绘制数据
ax1.plot([1, 2, 3, 4], [1, 4, 2, 3], label='Data 1 from how2matplotlib.com')
ax2.plot([1, 2, 3, 4], [3, 2, 4, 1], label='Data 2 from how2matplotlib.com')

# 使用get_figure()获取Figure对象并设置属性
figure = ax1.get_figure()
figure.suptitle('Data Comparison - how2matplotlib.com')
figure.tight_layout()

plt.show()
Output:
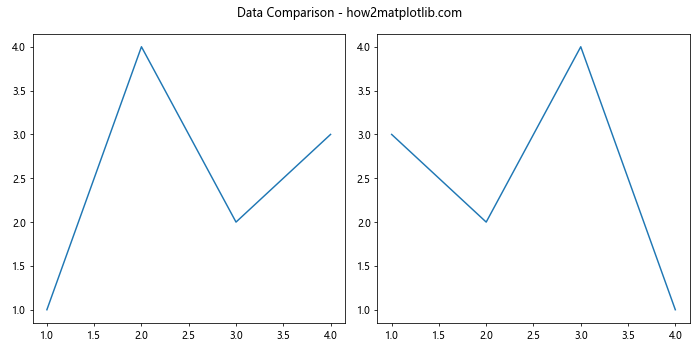
在这个例子中,我们创建了两个子图,并在每个子图上绘制了不同的数据。然后,我们使用get_figure()方法获取Figure对象,并设置了Figure的标题和布局。
2.2 保存图形
当我们需要保存图形时,通常需要调用Figure对象的savefig()方法。如果我们只有Axes对象的引用,可以使用get_figure()方法获取Figure对象,然后保存图形:
import matplotlib.pyplot as plt
import numpy as np

# 创建数据
x = np.linspace(0, 10, 100)
y = np.sin(x)

# 创建图形和轴
fig, ax = plt.subplots()

# 绘制数据
ax.plot(x, y, label='Sine wave from how2matplotlib.com')
ax.set_title('Sine Wave Plot')
ax.legend()

# 使用get_figure()获取Figure对象并保存图形
figure = ax.get_figure()
figure.savefig('sine_wave_how2matplotlib.png')

plt.show()
Output:
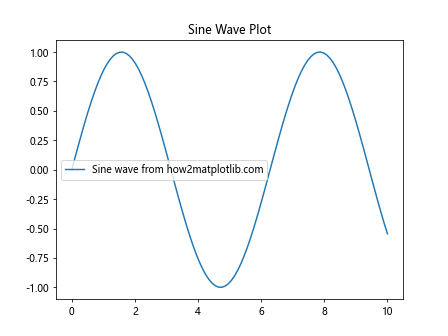
在这个例子中,我们创建了一个正弦波图形,然后使用get_figure()方法获取Figure对象,并调用其savefig()方法保存图形。
2.3 添加colorbar
当我们需要为图形添加colorbar时,通常需要使用Figure对象。如果我们只有Axes对象的引用,可以使用get_figure()方法获取Figure对象:
import matplotlib.pyplot as plt
import numpy as np

# 创建数据
x = np.linspace(-3, 3, 100)
y = np.linspace(-3, 3, 100)
X, Y = np.meshgrid(x, y)
Z = np.sin(X) * np.cos(Y)

# 创建图形和轴
fig, ax = plt.subplots()

# 绘制等高线图
c = ax.contourf(X, Y, Z, cmap='viridis')

# 使用get_figure()获取Figure对象并添加colorbar
figure = ax.get_figure()
figure.colorbar(c, ax=ax, label='Value from how2matplotlib.com')

ax.set_title('Contour Plot with Colorbar')

plt.show()
Output:
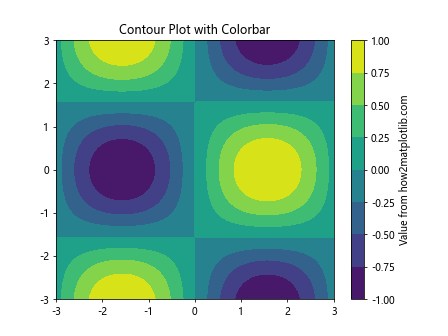
在这个例子中,我们创建了一个等高线图,然后使用get_figure()方法获取Figure对象,并为图形添加了一个colorbar。
3. get_figure()方法与其他Matplotlib函数的结合使用
get_figure()方法可以与Matplotlib的其他函数结合使用,以实现更复杂的图形定制。以下是一些例子:
3.1 结合tight_layout()使用
tight_layout()函数可以自动调整子图参数,以给定的填充适应图形区域。我们可以结合get_figure()方法使用它:
import matplotlib.pyplot as plt
import numpy as np

# 创建数据
x = np.linspace(0, 10, 100)
y1 = np.sin(x)
y2 = np.cos(x)

# 创建子图
fig, (ax1, ax2) = plt.subplots(2, 1, figsize=(8, 10))

# 在子图上绘制数据
ax1.plot(x, y1, label='Sine from how2matplotlib.com')
ax1.set_title('Sine Wave')
ax1.legend()

ax2.plot(x, y2, label='Cosine from how2matplotlib.com')
ax2.set_title('Cosine Wave')
ax2.legend()

# 使用get_figure()获取Figure对象并应用tight_layout
figure = ax1.get_figure()
figure.tight_layout()

plt.show()
Output:
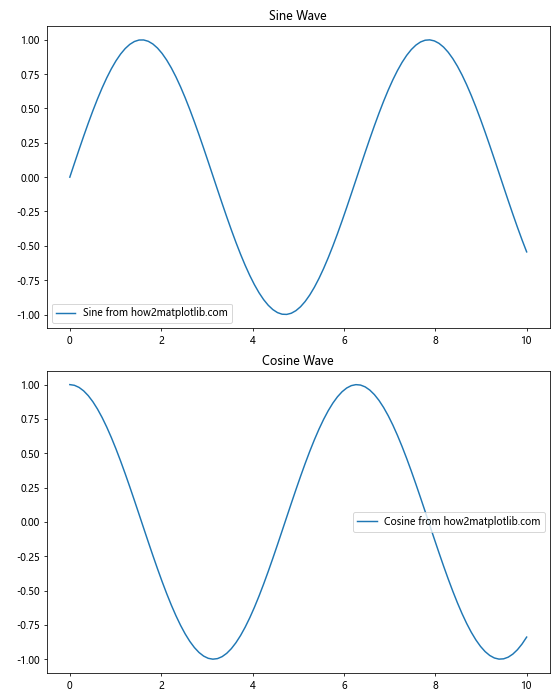
在这个例子中,我们创建了两个子图,分别绘制了正弦波和余弦波。然后,我们使用get_figure()方法获取Figure对象,并调用tight_layout()方法来自动调整子图布局。
3.2 结合suptitle()使用
suptitle()函数可以为整个Figure添加一个主标题。我们可以结合get_figure()方法使用它:
import matplotlib.pyplot as plt
import numpy as np

# 创建数据
categories = ['A', 'B', 'C', 'D', 'E']
values1 = [4, 7, 2, 5, 3]
values2 = [3, 6, 4, 2, 5]

# 创建子图
fig, (ax1, ax2) = plt.subplots(1, 2, figsize=(12, 5))

# 在子图上绘制数据
ax1.bar(categories, values1)
ax1.set_title('Data Set 1')
ax1.set_ylabel('Values from how2matplotlib.com')

ax2.bar(categories, values2)
ax2.set_title('Data Set 2')
ax2.set_ylabel('Values from how2matplotlib.com')

# 使用get_figure()获取Figure对象并添加主标题
figure = ax1.get_figure()
figure.suptitle('Comparison of Two Data Sets - how2matplotlib.com', fontsize=16)

plt.show()
Output:
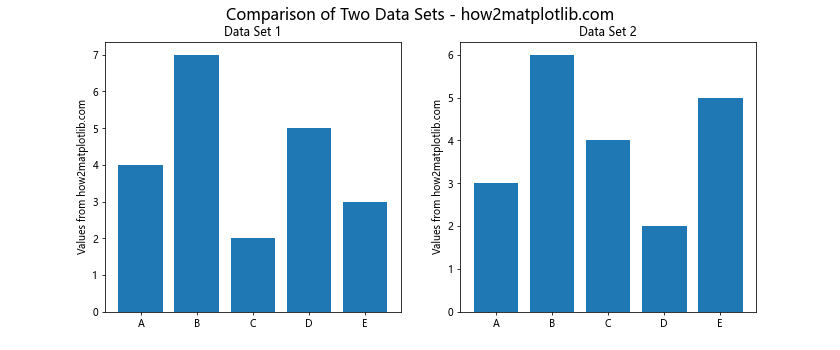
在这个例子中,我们创建了两个并排的柱状图,然后使用get_figure()方法获取Figure对象,并调用suptitle()方法为整个Figure添加了一个主标题。
3.3 结合subplots_adjust()使用
subplots_adjust()函数可以调整子图的布局参数。我们可以结合get_figure()方法使用它:
import matplotlib.pyplot as plt
import numpy as np

# 创建数据
x = np.linspace(0, 10, 100)
y1 = np.sin(x)
y2 = np.cos(x)
y3 = np.tan(x)

# 创建子图
fig, (ax1, ax2, ax3) = plt.subplots(3, 1, figsize=(8, 12))

# 在子图上绘制数据
ax1.plot(x, y1, label='Sine from how2matplotlib.com')
ax1.set_title('Sine Wave')
ax1.legend()

ax2.plot(x, y2, label='Cosine from how2matplotlib.com')
ax2.set_title('Cosine Wave')
ax2.legend()

ax3.plot(x, y3, label='Tangent from how2matplotlib.com')
ax3.set_title('Tangent Wave')
ax3.legend()

# 使用get_figure()获取Figure对象并调整子图布局
figure = ax1.get_figure()
figure.subplots_adjust(hspace=0.4)

plt.show()
Output:
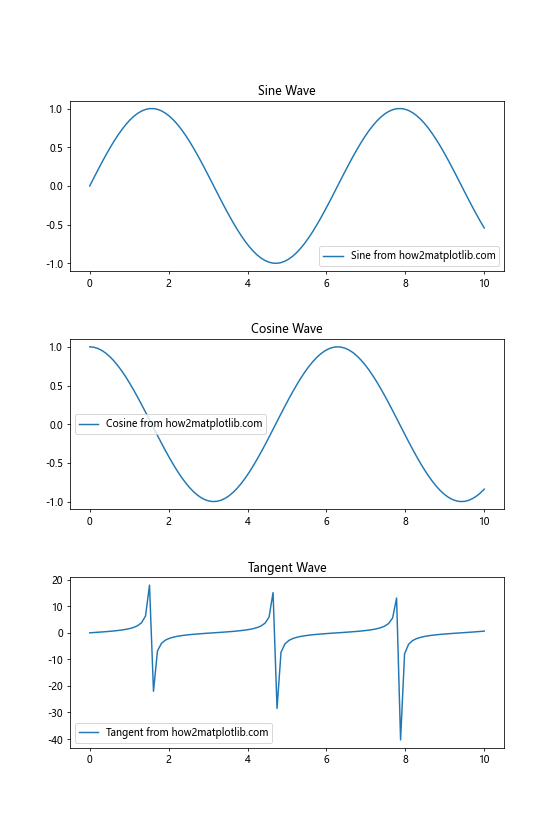
在这个例子中,我们创建了三个垂直排列的子图,分别绘制了正弦波、余弦波和正切波。然后,我们使用get_figure()方法获取Figure对象,并调用subplots_adjust()方法来增加子图之间的垂直间距。
4. get_figure()方法在自定义Axes类中的应用
当我们创建自定义的Axes类时,get_figure()方法也可以派上用场。例如,我们可以创建一个自定义的Axes类,它可以自动添加一个标题和一个脚注:
import matplotlib.pyplot as plt
from matplotlib.axes import Axes

class CustomAxes(Axes):
    def __init__(self, *args, **kwargs):
        super().__init__(*args, **kwargs)

    def plot(self, *args, **kwargs):
        super().plot(*args, **kwargs)
        self.set_title('Plot from CustomAxes - how2matplotlib.com')

        # 使用get_figure()获取Figure对象并添加脚注
        figure = self.get_figure()
        figure.text(0.5, 0.02, 'Created with CustomAxes', ha='center')

# 使用自定义Axes类创建图形
fig, ax = plt.subplots(subplot_kw={'projection': 'CustomAxes'})

# 绘制数据
ax.plot([1, 2, 3, 4], [1, 4, 2, 3])

plt.show()
在这个例子中,我们创建了一个名为CustomAxes的自定义Axes类。这个类重写了plot方法,在绘图时自动添加一个标题。此外,它还使用get_figure()方法获取Figure对象,并添加了一个脚注。
5. get_figure()方法在动画中的应用
get_figure()方法在创建动画时也非常有用。例如,我们可以使用它来获取Figure对象,然后创建一个动画:
import matplotlib.pyplot as plt
import matplotlib.animation as animation
import numpy as np

# 创建图形和轴
fig, ax = plt.subplots()

# 初始化空列表来存储线条
line, = ax.plot([], [])

# 设置坐标轴范围
ax.set_xlim(0, 2*np.pi)
ax.set_ylim(-1, 1)

# 初始化函数
def init():
    line.set_data([], [])
    return line,

# 动画函数
def animate(i):
    x = np.linspace(0, 2*np.pi, 100)
    y = np.sin(x + i/10.0)
    line.set_data(x, y)
    return line,

# 使用get_figure()获取Figure对象并创建动画
figure = ax.get_figure()
anim = animation.FuncAnimation(figure, animate, init_func=init,
                               frames=200, interval=20, blit=True)

ax.set_title('Animated Sine Wave - how2matplotlib.com')

plt.show()
Output:
在这个例子中,我们创建了一个动画,展示了一个移动的正弦波。我们使用get_figure()方法获取Figure对象,然后将其传递给animation.FuncAnimation()函数来创建动画。
6. get_figure()方法在多图布局中的应用
当我们使用GridSpec创建复杂的多图布局时,get_figure()方法也可以派上用场:
import matplotlib.pyplot as plt
from matplotlib.gridspec import GridSpec
import numpy as np

# 创建Figure
fig = plt.figure(figsize=(12, 8))

# 创建GridSpec
gs = GridSpec(2, 3, figure=fig)

# 创建子图
ax1 = fig.add_subplot(gs[0, 0])
ax2 = fig.add_subplot(gs[0, 1:])
ax3 = fig.add_subplot(gs[1, :])

# 在子图上绘制数据
x = np.linspace(0, 10, 100)
ax1.plot(x, np.sin(x), label='Sine from how2matplotlib.com')
ax1.set_title('Sine Wave')
ax1.legend()

ax2.plot(x, np.cos(x), label='Cosine from how2matplotlib.com')
ax2.set_title('CosineWave')
ax2.legend()

ax3.plot(x, np.tan(x), label='Tangent from how2matplotlib.com')
ax3.set_title('Tangent Wave')
ax3.legend()

# 使用get_figure()获取Figure对象并调整布局
figure = ax1.get_figure()
figure.tight_layout()

plt.show()
Output:
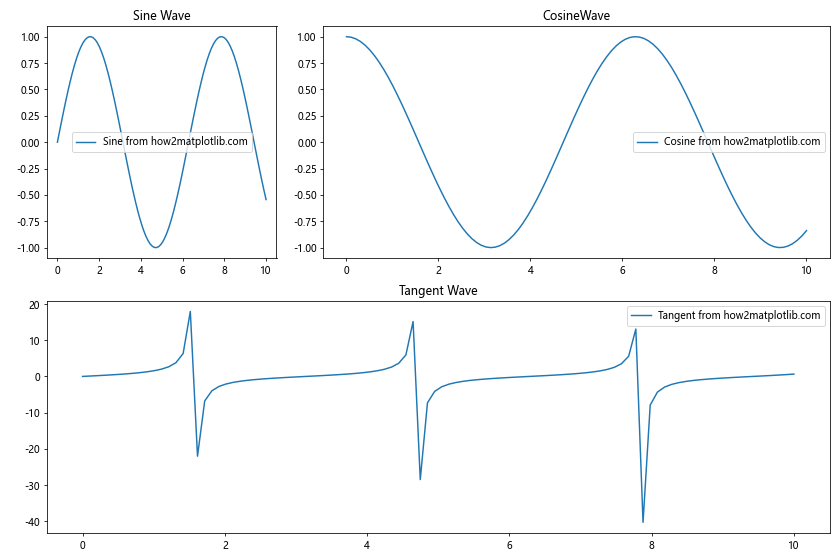
在这个例子中,我们使用GridSpec创建了一个复杂的多图布局,包含三个子图。然后,我们使用get_figure()方法获取Figure对象,并调用tight_layout()方法来自动调整子图布局。
7. get_figure()方法在交互式绘图中的应用
get_figure()方法在创建交互式绘图时也非常有用。例如,我们可以使用它来获取Figure对象,然后添加一个滑动条来动态调整图形:
import matplotlib.pyplot as plt
from matplotlib.widgets import Slider
import numpy as np

# 创建数据
x = np.linspace(0, 10, 100)
y = np.sin(x)

# 创建图形和轴
fig, ax = plt.subplots()
line, = ax.plot(x, y)

# 创建滑动条的轴
slider_ax = plt.axes([0.2, 0.02, 0.6, 0.03])
slider = Slider(slider_ax, 'Frequency', 0.1, 10.0, valinit=1)

# 更新函数
def update(val):
    freq = slider.val
    line.set_ydata(np.sin(freq * x))

    # 使用get_figure()获取Figure对象并重绘
    figure = ax.get_figure()
    figure.canvas.draw_idle()

# 连接滑动条到更新函数
slider.on_changed(update)

ax.set_title('Interactive Sine Wave - how2matplotlib.com')

plt.show()
Output:
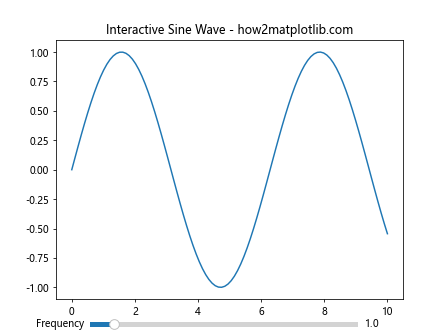
在这个例子中,我们创建了一个交互式的正弦波图形,用户可以通过滑动条来调整波的频率。我们使用get_figure()方法获取Figure对象,并在更新函数中调用canvas.draw_idle()方法来重绘图形。
8. get_figure()方法在自定义Figure类中的应用
我们还可以创建一个自定义的Figure类,并在其中使用get_figure()方法。这可以让我们为Figure添加一些自定义的功能:
import matplotlib.pyplot as plt
from matplotlib.figure import Figure

class CustomFigure(Figure):
    def __init__(self, *args, **kwargs):
        super().__init__(*args, **kwargs)
        self.text(0.5, 0.98, 'Custom Figure - how2matplotlib.com',
                  ha='center', va='top', transform=self.transFigure)

    def add_watermark(self):
        self.text(0.5, 0.5, 'how2matplotlib.com',
                  ha='center', va='center', alpha=0.2, fontsize=40,
                  transform=self.transFigure)

# 创建自定义Figure
fig = plt.figure(FigureClass=CustomFigure)

# 添加子图并绘制数据
ax = fig.add_subplot(111)
ax.plot([1, 2, 3, 4], [1, 4, 2, 3])

# 使用get_figure()获取Figure对象并添加水印
custom_fig = ax.get_figure()
custom_fig.add_watermark()

plt.show()
Output:
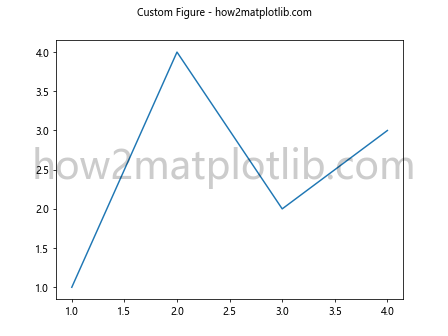
在这个例子中,我们创建了一个名为CustomFigure的自定义Figure类。这个类在初始化时会自动添加一个标题,并提供了一个add_watermark()方法来添加水印。我们使用get_figure()方法获取这个自定义Figure对象,并调用其add_watermark()方法。
9. get_figure()方法在3D绘图中的应用
get_figure()方法在3D绘图中也同样适用。我们可以使用它来获取Figure对象,然后对3D图形进行进一步的定制:
import matplotlib.pyplot as plt
from mpl_toolkits.mplot3d import Axes3D
import numpy as np

# 创建数据
x = np.linspace(-5, 5, 50)
y = np.linspace(-5, 5, 50)
X, Y = np.meshgrid(x, y)
Z = np.sin(np.sqrt(X**2 + Y**2))

# 创建3D图形
fig = plt.figure(figsize=(10, 8))
ax = fig.add_subplot(111, projection='3d')

# 绘制3D表面
surf = ax.plot_surface(X, Y, Z, cmap='viridis')

# 使用get_figure()获取Figure对象并添加colorbar
figure = ax.get_figure()
figure.colorbar(surf, ax=ax, shrink=0.5, aspect=5, label='Value from how2matplotlib.com')

ax.set_title('3D Surface Plot')

plt.show()
Output:
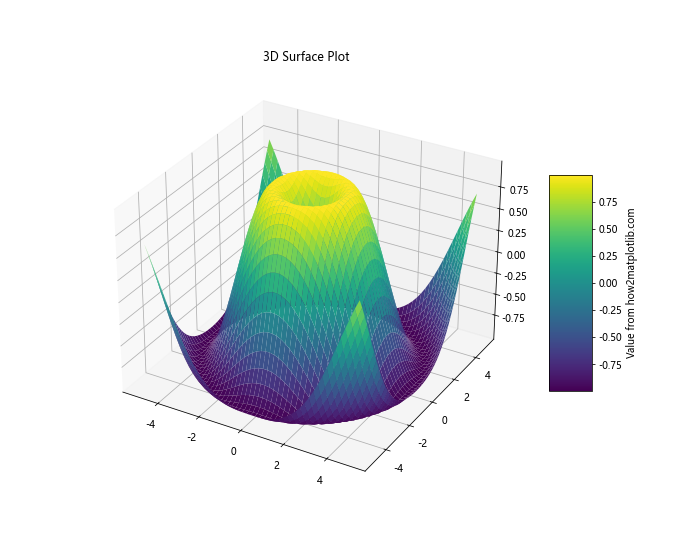
在这个例子中,我们创建了一个3D表面图。我们使用get_figure()方法获取Figure对象,然后为3D图形添加了一个colorbar。
10. get_figure()方法在子图网格中的应用
当我们使用subplot2grid创建不规则的子图网格时,get_figure()方法也可以派上用场:
import matplotlib.pyplot as plt
import numpy as np

# 创建Figure
fig = plt.figure(figsize=(12, 8))

# 创建子图
ax1 = plt.subplot2grid((3, 3), (0, 0), colspan=2)
ax2 = plt.subplot2grid((3, 3), (0, 2), rowspan=2)
ax3 = plt.subplot2grid((3, 3), (1, 0), colspan=2, rowspan=2)

# 在子图上绘制数据
x = np.linspace(0, 10, 100)
ax1.plot(x, np.sin(x), label='Sine from how2matplotlib.com')
ax1.set_title('Sine Wave')
ax1.legend()

ax2.plot(x, np.cos(x), label='Cosine from how2matplotlib.com')
ax2.set_title('Cosine Wave')
ax2.legend()

ax3.plot(x, np.tan(x), label='Tangent from how2matplotlib.com')
ax3.set_title('Tangent Wave')
ax3.legend()

# 使用get_figure()获取Figure对象并调整布局
figure = ax1.get_figure()
figure.tight_layout()

plt.show()
Output:
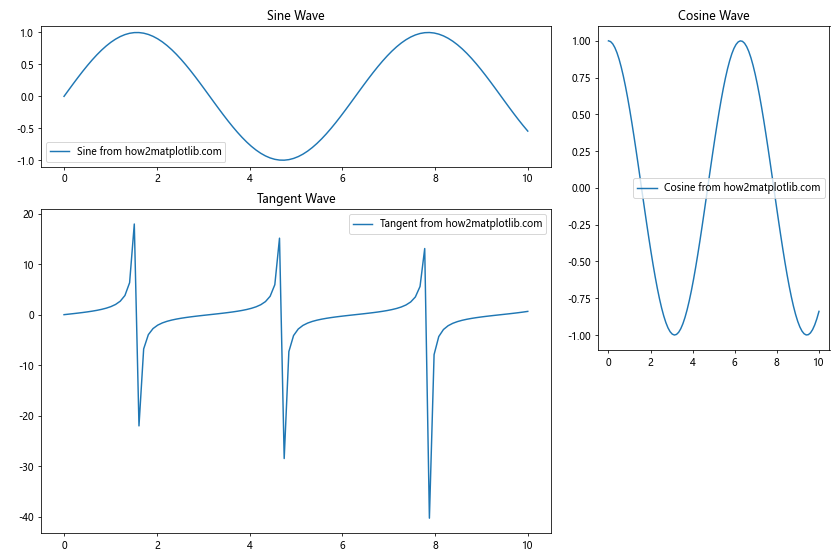
在这个例子中,我们使用subplot2grid创建了一个不规则的子图网格。然后,我们使用get_figure()方法获取Figure对象,并调用tight_layout()方法来自动调整子图布局。
总结
通过以上详细的介绍和丰富的示例,我们可以看到Axes.get_figure()方法在Matplotlib中的重要性和广泛应用。这个方法为我们提供了一种从Axes对象获取Figure对象的简单方式,使我们能够更灵活地控制和定制我们的图形。
无论是设置Figure属性、保存图形、添加colorbar,还是在自定义类、动画、交互式绘图、3D绘图等高级应用中,get_figure()方法都展现出了其强大的功能和灵活性。通过掌握这个方法,我们可以更好地利用Matplotlib的强大功能,创建出更加精美和专业的数据可视化图形。
在实际的数据可视化项目中,我们常常需要对图形进行各种调整和定制。get_figure()方法为我们提供了一个便捷的途径,使我们能够在任何时候获取Figure对象,从而进行全局的调整和控制。这大大增强了我们创建复杂图形的能力,使我们能够更好地展示和传达数据中的信息。
总之,Axes.get_figure()方法是Matplotlib库中一个简单但非常有用的工具,掌握它将使你的数据可视化工作更加得心应手。
 极客笔记
极客笔记