Matplotlib中使用get_default_bbox_extra_artists()方法获取默认额外艺术家对象
参考:Matplotlib.axes.Axes.get_default_bbox_extra_artists() in Python
Matplotlib是Python中最流行的数据可视化库之一,它提供了丰富的绘图功能和灵活的自定义选项。在Matplotlib中,Axes对象是绘图的核心,它代表了图表的绘图区域。get_default_bbox_extra_artists()是Axes类的一个重要方法,用于获取与当前轴相关的默认额外艺术家对象列表。本文将深入探讨这个方法的用法、应用场景以及相关的高级技巧。
1. get_default_bbox_extra_artists()方法简介
get_default_bbox_extra_artists()方法是Matplotlib库中Axes类的一个成员函数。它的主要作用是返回一个包含与当前轴相关的默认额外艺术家对象的列表。这些额外的艺术家对象通常包括图例、标题、x轴标签、y轴标签等元素,它们可能会影响图表的边界框(bounding box)计算。
让我们来看一个简单的示例,了解如何使用这个方法:
import matplotlib.pyplot as plt

fig, ax = plt.subplots()
ax.plot([1, 2, 3, 4], [1, 4, 2, 3], label='Data from how2matplotlib.com')
ax.set_title('Example Plot')
ax.set_xlabel('X-axis')
ax.set_ylabel('Y-axis')
ax.legend()

extra_artists = ax.get_default_bbox_extra_artists()
print(f"Number of extra artists: {len(extra_artists)}")
print(f"Types of extra artists: {[type(artist).__name__ for artist in extra_artists]}")

plt.show()
Output:
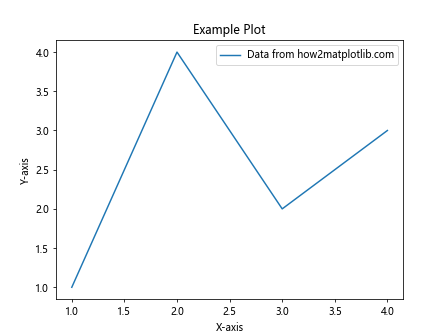
在这个例子中,我们创建了一个简单的折线图,并添加了标题、坐标轴标签和图例。然后,我们调用get_default_bbox_extra_artists()方法获取额外的艺术家对象,并打印出它们的数量和类型。
2. 理解额外艺术家对象
额外艺术家对象是指那些不直接属于主要绘图元素(如线条、散点等),但仍然是图表重要组成部分的对象。这些对象通常包括:
- 图例(Legend)
- 标题(Title)
- 坐标轴标签(Axis labels)
- 文本注释(Text annotations)
- 箭头(Arrows)
- 表格(Tables)
了解这些额外艺术家对象对于正确计算图表的边界框和保存图像时确保所有元素都被包含在内非常重要。
让我们通过一个更复杂的例子来展示这些额外艺术家对象:
import matplotlib.pyplot as plt
import numpy as np

fig, ax = plt.subplots(figsize=(10, 6))

x = np.linspace(0, 10, 100)
y1 = np.sin(x)
y2 = np.cos(x)

ax.plot(x, y1, label='Sin(x) - how2matplotlib.com')
ax.plot(x, y2, label='Cos(x) - how2matplotlib.com')

ax.set_title('Trigonometric Functions')
ax.set_xlabel('X-axis')
ax.set_ylabel('Y-axis')
ax.legend()

ax.annotate('Important point', xy=(np.pi, 0), xytext=(4, 0.5),
            arrowprops=dict(facecolor='black', shrink=0.05))

extra_artists = ax.get_default_bbox_extra_artists()
for i, artist in enumerate(extra_artists):
    print(f"Artist {i+1}: {type(artist).__name__}")

plt.tight_layout()
plt.show()
Output:
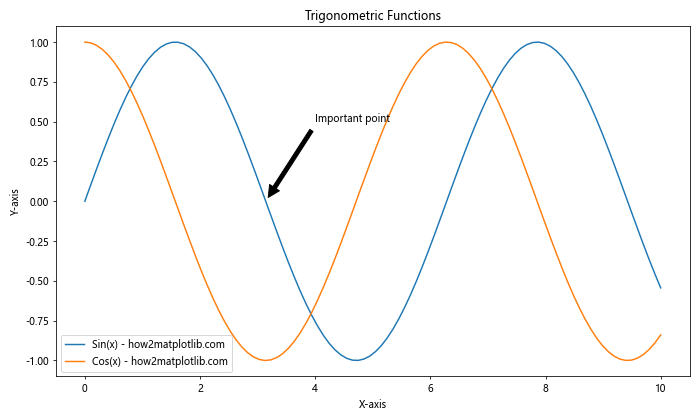
在这个例子中,我们创建了一个包含正弦和余弦函数的图表,并添加了标题、坐标轴标签、图例和一个带箭头的注释。通过调用get_default_bbox_extra_artists()方法,我们可以获取并打印出所有额外艺术家对象的类型。
3. get_default_bbox_extra_artists()方法的应用场景
3.1 保存图像时包含所有元素
当保存Matplotlib图像时,默认情况下可能会裁剪掉一些额外的艺术家对象。使用get_default_bbox_extra_artists()方法可以确保所有元素都被包含在保存的图像中。
import matplotlib.pyplot as plt
import numpy as np

fig, ax = plt.subplots(figsize=(8, 6))

x = np.linspace(0, 10, 100)
y = np.exp(-x/10) * np.sin(x)

ax.plot(x, y, label='Damped oscillation - how2matplotlib.com')
ax.set_title('Damped Sine Wave')
ax.set_xlabel('Time')
ax.set_ylabel('Amplitude')
ax.legend(loc='upper right')

ax.annotate('Peak', xy=(1.5, 0.9), xytext=(3, 0.8),
            arrowprops=dict(facecolor='red', shrink=0.05))

extra_artists = ax.get_default_bbox_extra_artists()
plt.savefig('damped_sine_wave.png', bbox_inches='tight',
            bbox_extra_artists=extra_artists)

plt.show()
Output:
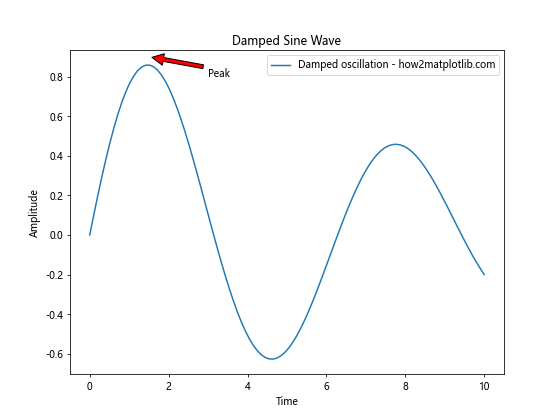
在这个例子中,我们创建了一个衰减正弦波的图表,并添加了一个注释。在保存图像时,我们使用get_default_bbox_extra_artists()方法获取额外的艺术家对象,并将其传递给savefig()函数的bbox_extra_artists参数,以确保所有元素都被包含在保存的图像中。
3.2 自定义布局调整
在某些情况下,你可能需要手动调整图表的布局,以避免元素重叠或确保所有元素都可见。get_default_bbox_extra_artists()方法可以帮助你识别需要考虑的所有元素。
import matplotlib.pyplot as plt
import numpy as np

fig, ax = plt.subplots(figsize=(10, 6))

x = np.linspace(0, 10, 100)
y1 = np.sin(x)
y2 = np.cos(x)

ax.plot(x, y1, label='Sin(x) - how2matplotlib.com')
ax.plot(x, y2, label='Cos(x) - how2matplotlib.com')

ax.set_title('Trigonometric Functions with Custom Layout')
ax.set_xlabel('X-axis')
ax.set_ylabel('Y-axis')
ax.legend(loc='upper right')

ax.text(5, 0.5, 'Custom text\nMultiple lines\nhow2matplotlib.com',
        bbox=dict(facecolor='yellow', alpha=0.5))

extra_artists = ax.get_default_bbox_extra_artists()

# 手动调整布局
fig.tight_layout()
plt.subplots_adjust(top=0.9, right=0.8)

# 确保所有元素都在图表范围内
fig.canvas.draw()
bbox = ax.get_tightbbox(fig.canvas.get_renderer())
fig.savefig('custom_layout.png', bbox_inches=bbox.transformed(fig.dpi_scale_trans.inverted()))

plt.show()
Output:
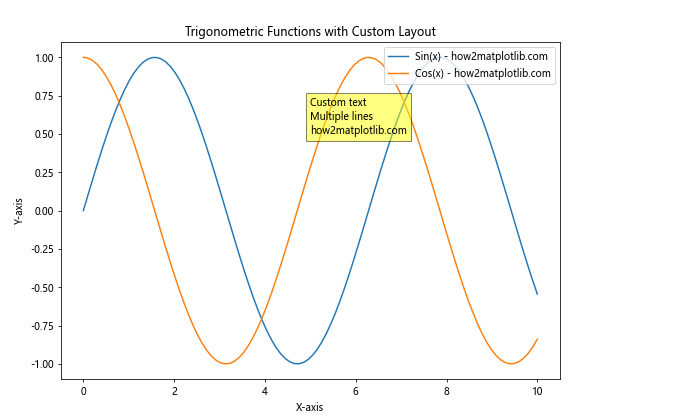
在这个例子中,我们创建了一个包含正弦和余弦函数的图表,并添加了一个自定义文本框。我们使用get_default_bbox_extra_artists()方法获取所有额外的艺术家对象,然后手动调整布局并保存图像,确保所有元素都被包含在内。
4. 高级技巧和注意事项
4.1 处理重叠的艺术家对象
有时,额外的艺术家对象可能会相互重叠。在这种情况下,你可能需要手动调整它们的位置或大小。以下是一个处理重叠图例和注释的例子:
import matplotlib.pyplot as plt
import numpy as np

fig, ax = plt.subplots(figsize=(10, 6))

x = np.linspace(0, 10, 100)
y1 = np.sin(x)
y2 = np.cos(x)

ax.plot(x, y1, label='Sin(x) - how2matplotlib.com')
ax.plot(x, y2, label='Cos(x) - how2matplotlib.com')

ax.set_title('Handling Overlapping Artists')
ax.set_xlabel('X-axis')
ax.set_ylabel('Y-axis')

# 添加可能重叠的图例和注释
legend = ax.legend(loc='upper right')
annotation = ax.annotate('Important point', xy=(8, 0.5), xytext=(6, 0.8),
                         arrowprops=dict(facecolor='black', shrink=0.05))

# 获取额外的艺术家对象
extra_artists = ax.get_default_bbox_extra_artists()

# 检查并调整重叠
legend_bbox = legend.get_window_extent(fig.canvas.get_renderer())
annotation_bbox = annotation.get_window_extent(fig.canvas.get_renderer())

if legend_bbox.overlaps(annotation_bbox):
    # 移动注释
    annotation.set_position((5, 0.6))

plt.tight_layout()
plt.show()
Output:
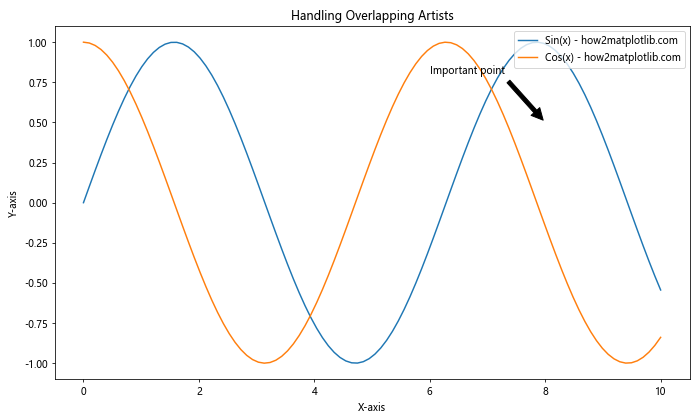
在这个例子中,我们检查图例和注释是否重叠,如果重叠,则调整注释的位置。这种方法可以帮助你避免重要信息被遮挡。
4.2 动态添加和移除艺术家对象
在某些情况下,你可能需要在绘图过程中动态添加或移除艺术家对象。以下是一个演示如何动态管理艺术家对象的例子:
import matplotlib.pyplot as plt
import numpy as np

fig, ax = plt.subplots(figsize=(10, 6))

x = np.linspace(0, 10, 100)
y = np.sin(x)

line, = ax.plot(x, y, label='Sin(x) - how2matplotlib.com')
ax.set_title('Dynamic Artist Management')
ax.set_xlabel('X-axis')
ax.set_ylabel('Y-axis')

# 初始状态
print("Initial extra artists:")
print([type(artist).__name__ for artist in ax.get_default_bbox_extra_artists()])

# 添加图例
legend = ax.legend()
print("\nAfter adding legend:")
print([type(artist).__name__ for artist in ax.get_default_bbox_extra_artists()])

# 添加文本注释
text = ax.text(5, 0.5, 'Dynamic text - how2matplotlib.com')
print("\nAfter adding text:")
print([type(artist).__name__ for artist in ax.get_default_bbox_extra_artists()])

# 移除图例
legend.remove()
print("\nAfter removing legend:")
print([type(artist).__name__ for artist in ax.get_default_bbox_extra_artists()])

plt.tight_layout()
plt.show()
Output:
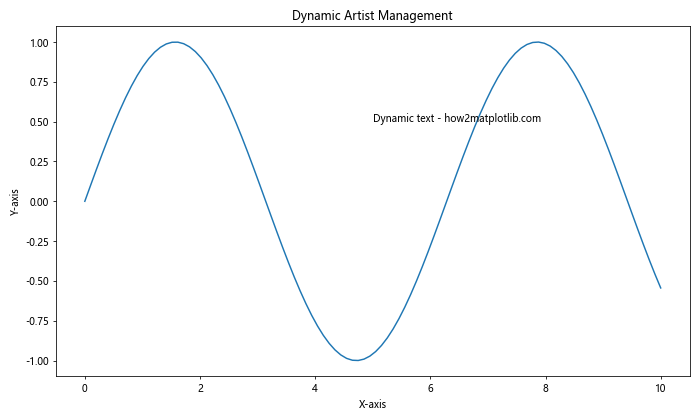
这个例子展示了如何动态添加和移除艺术家对象,并在每个步骤后使用get_default_bbox_extra_artists()方法检查当前的额外艺术家对象列表。
4.3 自定义艺术家对象的边界框
有时,你可能需要自定义某些艺术家对象的边界框计算方式。以下是一个演示如何为自定义艺术家对象定义边界框的例子:
import matplotlib.pyplot as plt
import matplotlib.patches as patches
import numpy as np

class CustomArtist(patches.Rectangle):
    def __init__(self, *args, **kwargs):
        super().__init__(*args, **kwargs)
        self.set_bbox_extra_artists = True

    def get_window_extent(self, renderer):
        bbox = super().get_window_extent(renderer)
        # 扩大边界框
        return bbox.expanded(1.1, 1.1)

fig, ax = plt.subplots(figsize=(10, 6))

x = np.linspace(0, 10, 100)
y = np.sin(x)

ax.plot(x, y, label='Sin(x) - how2matplotlib.com')
ax.set_title('Custom Artist with Modified Bounding Box')
ax.set_xlabel('X-axis')
ax.set_ylabel('Y-axis')

# 添加自定义艺术家对象
custom_artist = CustomArtist((4, -0.5), 2, 1, facecolor='red', alpha=0.5)
ax.add_artist(custom_artist)

extra_artists = ax.get_default_bbox_extra_artists()
print("Extra artists:")
print([type(artist).__name__ for artist in extra_artists])

plt.tight_layout()
plt.show()
Output:
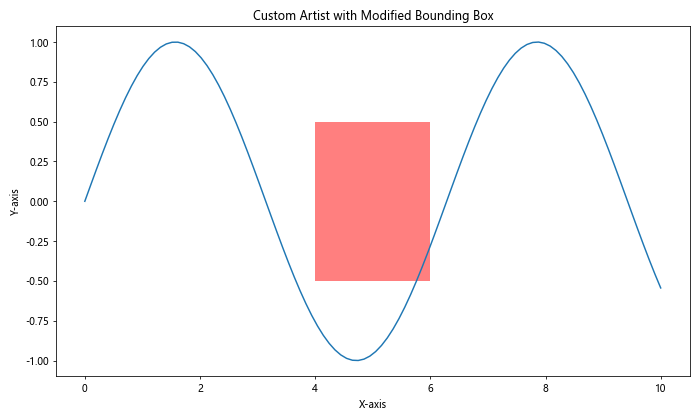
在这个例子中,我们创建了一个自定义的CustomArtist类,它继承自Rectangle类并重写了get_window_extent()方法以提供一个扩大的边界框。这种方法可以用于确保某些特殊的艺术家对象在保存或显示图表时有足够的空间。
5. 常见问题和解决方案
5.1 额外艺术家对象未被包含在保存的图像中
如果你发现某些额外的艺术家对象(如图例或注释)在保存的图像中被裁剪掉了,可以尝试以下解决方案:
import matplotlib.pyplot as plt
import numpy as np

fig, ax = plt.subplots(figsize=(10, 6))

x = np.linspace(0, 10, 100)
y = np.sin(x) * np.exp(-x/10)

ax.plot(x, y, label='Damped sine wave - how2matplotlib.com')
ax.set_title('Ensuring All Artists are Included')
ax.set_xlabel('X-axis')
ax.set_ylabel('Y-axis')

ax.legend(loc='upper right')
ax.annotate('Peak', xy=(0.5, 1), xytext=(2, 0.8),arrowprops=dict(facecolor='red', shrink=0.05))

# 获取所有额外的艺术家对象
extra_artists = ax.get_default_bbox_extra_artists()

# 保存图像,确保包含所有额外的艺术家对象
plt.savefig('all_artists_included.png', bbox_inches='tight',
            bbox_extra_artists=extra_artists, dpi=300)

plt.show()
Output:
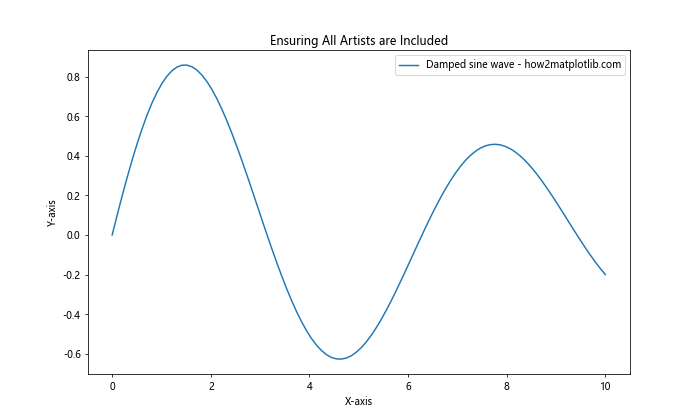
在这个例子中,我们使用bbox_inches='tight'和bbox_extra_artists=extra_artists参数来确保所有的额外艺术家对象都被包含在保存的图像中。
5.2 处理大量额外艺术家对象
当图表中包含大量的额外艺术家对象时,可能会影响性能或导致布局问题。以下是一个处理大量艺术家对象的示例:
import matplotlib.pyplot as plt
import numpy as np

fig, ax = plt.subplots(figsize=(12, 8))

x = np.linspace(0, 10, 100)
y = np.sin(x)

ax.plot(x, y, label='Sin(x) - how2matplotlib.com')
ax.set_title('Handling Many Extra Artists')
ax.set_xlabel('X-axis')
ax.set_ylabel('Y-axis')

# 添加多个文本注释
for i in range(20):
    ax.text(np.random.rand()*10, np.random.rand()*2-1,
            f'Text {i+1}\nhow2matplotlib.com',
            bbox=dict(facecolor='yellow', alpha=0.5))

extra_artists = ax.get_default_bbox_extra_artists()
print(f"Number of extra artists: {len(extra_artists)}")

# 手动调整布局以适应所有艺术家对象
plt.tight_layout()
plt.subplots_adjust(top=0.9, right=0.9, left=0.1, bottom=0.1)

# 保存图像,确保包含所有额外的艺术家对象
plt.savefig('many_artists.png', bbox_inches='tight',
            bbox_extra_artists=extra_artists, dpi=300)

plt.show()
Output:
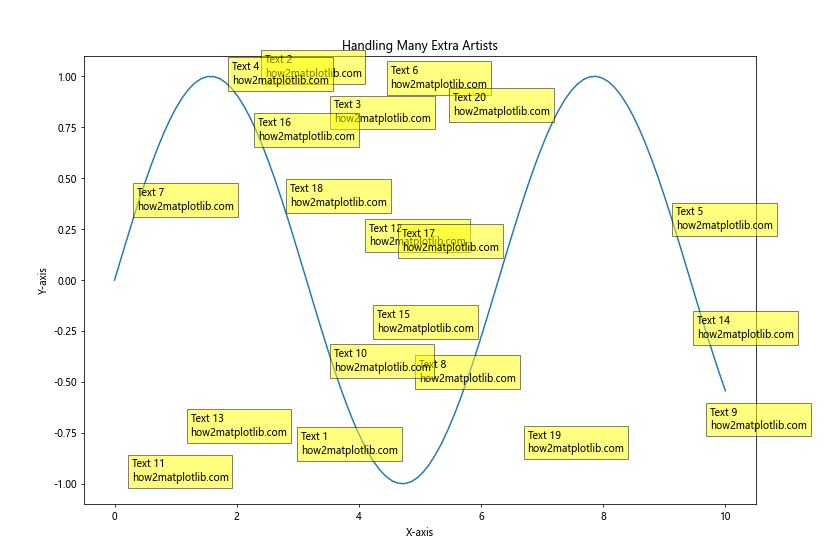
在这个例子中,我们添加了多个文本注释,然后使用tight_layout()和subplots_adjust()来手动调整布局,以确保所有的艺术家对象都能被正确显示和保存。
6. get_default_bbox_extra_artists()方法的内部工作原理
为了更好地理解get_default_bbox_extra_artists()方法的工作原理,让我们深入探讨一下它的内部实现:
- 收集艺术家对象:该方法首先收集与当前轴相关的所有艺术家对象,包括标题、坐标轴标签、刻度标签等。
-
过滤可见对象:只有可见的艺术家对象才会被包含在返回的列表中。
-
考虑特殊属性:某些艺术家对象可能有特殊的属性(如
set_bbox_extra_artists),这些属性会影响它们是否被包含在返回的列表中。 -
递归处理:对于某些复合艺术家对象(如图例),该方法会递归地处理其子对象。
以下是一个模拟get_default_bbox_extra_artists()方法工作原理的简化示例:
import matplotlib.pyplot as plt
import numpy as np

def simulate_get_default_bbox_extra_artists(ax):
    extra_artists = []

    # 检查标题
    if ax.get_title():
        extra_artists.append(ax.title)

    # 检查坐标轴标签
    if ax.get_xlabel():
        extra_artists.append(ax.xaxis.label)
    if ax.get_ylabel():
        extra_artists.append(ax.yaxis.label)

    # 检查图例
    if ax.get_legend():
        extra_artists.append(ax.get_legend())

    # 检查文本注释
    for artist in ax.get_children():
        if isinstance(artist, plt.Text) and artist.get_visible():
            extra_artists.append(artist)

    return extra_artists

# 创建示例图表
fig, ax = plt.subplots(figsize=(10, 6))

x = np.linspace(0, 10, 100)
y = np.sin(x)

ax.plot(x, y, label='Sin(x) - how2matplotlib.com')
ax.set_title('Simulating get_default_bbox_extra_artists()')
ax.set_xlabel('X-axis')
ax.set_ylabel('Y-axis')
ax.legend()

ax.text(5, 0.5, 'Custom text\nhow2matplotlib.com',
        bbox=dict(facecolor='yellow', alpha=0.5))

# 使用模拟的方法获取额外艺术家对象
simulated_extra_artists = simulate_get_default_bbox_extra_artists(ax)
print("Simulated extra artists:")
for artist in simulated_extra_artists:
    print(f"- {type(artist).__name__}")

# 使用实际的方法获取额外艺术家对象
actual_extra_artists = ax.get_default_bbox_extra_artists()
print("\nActual extra artists:")
for artist in actual_extra_artists:
    print(f"- {type(artist).__name__}")

plt.tight_layout()
plt.show()
Output:
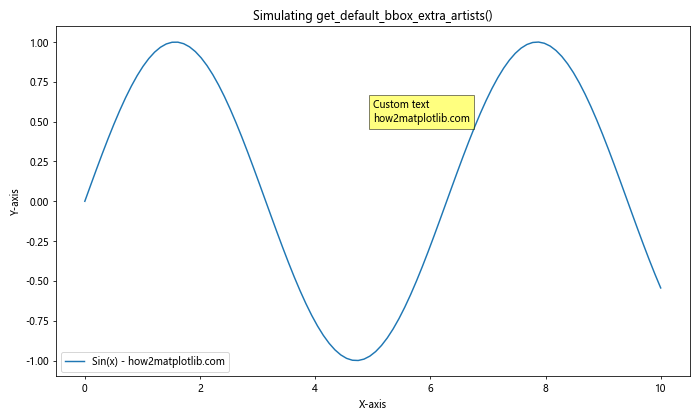
这个例子展示了一个简化版的get_default_bbox_extra_artists()方法实现,并将其结果与实际方法的结果进行了比较。这有助于理解该方法的工作原理。
7. 结合其他Matplotlib功能使用get_default_bbox_extra_artists()
get_default_bbox_extra_artists()方法可以与其他Matplotlib功能结合使用,以创建更复杂和精细的可视化。以下是一些示例:
7.1 与子图结合使用
import matplotlib.pyplot as plt
import numpy as np

fig, (ax1, ax2) = plt.subplots(1, 2, figsize=(12, 5))

x = np.linspace(0, 10, 100)
y1 = np.sin(x)
y2 = np.cos(x)

ax1.plot(x, y1, label='Sin(x) - how2matplotlib.com')
ax1.set_title('Sine Wave')
ax1.set_xlabel('X-axis')
ax1.set_ylabel('Y-axis')
ax1.legend()

ax2.plot(x, y2, label='Cos(x) - how2matplotlib.com')
ax2.set_title('Cosine Wave')
ax2.set_xlabel('X-axis')
ax2.set_ylabel('Y-axis')
ax2.legend()

extra_artists1 = ax1.get_default_bbox_extra_artists()
extra_artists2 = ax2.get_default_bbox_extra_artists()

print("Extra artists in subplot 1:")
print([type(artist).__name__ for artist in extra_artists1])
print("\nExtra artists in subplot 2:")
print([type(artist).__name__ for artist in extra_artists2])

plt.tight_layout()
plt.show()
Output:
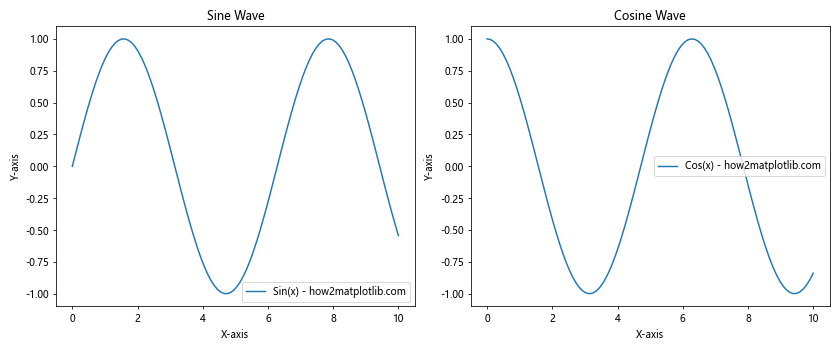
这个例子展示了如何在包含多个子图的图表中使用get_default_bbox_extra_artists()方法。
7.2 与动画结合使用
import matplotlib.pyplot as plt
import matplotlib.animation as animation
import numpy as np

fig, ax = plt.subplots(figsize=(10, 6))

x = np.linspace(0, 2*np.pi, 100)
line, = ax.plot(x, np.sin(x))

ax.set_title('Animated Sine Wave - how2matplotlib.com')
ax.set_xlabel('X-axis')
ax.set_ylabel('Y-axis')

text = ax.text(np.pi, 0, 'Phase: 0', ha='center', va='center')

def animate(frame):
    line.set_ydata(np.sin(x + frame/10))
    text.set_text(f'Phase: {frame/10:.2f}')
    return line, text

anim = animation.FuncAnimation(fig, animate, frames=100, interval=50, blit=True)

extra_artists = ax.get_default_bbox_extra_artists()
print("Extra artists in animation:")
print([type(artist).__name__ for artist in extra_artists])

plt.tight_layout()
plt.show()
Output:
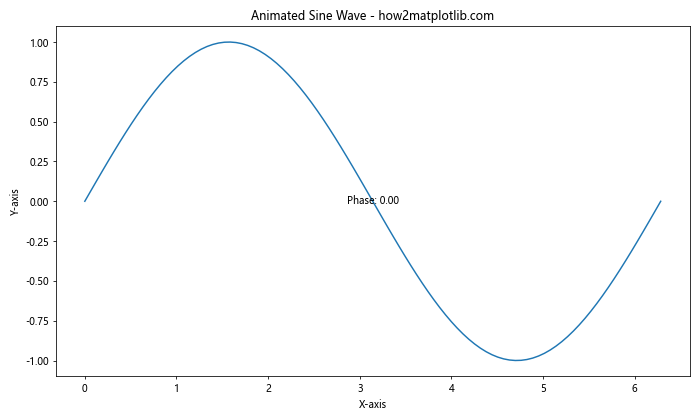
这个例子展示了如何在创建动画时使用get_default_bbox_extra_artists()方法,以确保所有动态更新的元素都被正确考虑。
8. 性能考虑和优化
虽然get_default_bbox_extra_artists()方法本身通常不会对性能产生显著影响,但在处理大量艺术家对象或频繁调用该方法时,仍然需要考虑性能问题。以下是一些优化建议:
- 缓存结果:如果图表结构不经常变化,可以缓存
get_default_bbox_extra_artists()的结果,而不是每次都重新计算。 -
限制艺术家对象数量:尽量避免创建过多的额外艺术家对象,特别是在大型或复杂的图表中。
-
使用blitting技术:在创建动画时,使用blitting可以提高性能,只重绘发生变化的部分。
-
按需更新:只在必要时更新额外艺术家对象列表,而不是在每一帧或每次交互时都更新。
以下是一个结合这些优化建议的示例:
import matplotlib.pyplot as plt
import matplotlib.animation as animation
import numpy as np

class OptimizedPlot:
    def __init__(self):
        self.fig, self.ax = plt.subplots(figsize=(10, 6))
        self.x = np.linspace(0, 2*np.pi, 100)
        self.line, = self.ax.plot(self.x, np.sin(self.x))

        self.ax.set_title('Optimized Animated Plot - how2matplotlib.com')
        self.ax.set_xlabel('X-axis')
        self.ax.set_ylabel('Y-axis')

        self.text = self.ax.text(np.pi, 0, 'Phase: 0', ha='center', va='center')

        self.extra_artists = None
        self.update_extra_artists()

    def update_extra_artists(self):
        self.extra_artists = self.ax.get_default_bbox_extra_artists()

    def animate(self, frame):
        self.line.set_ydata(np.sin(self.x + frame/10))
        self.text.set_text(f'Phase: {frame/10:.2f}')
        return self.line, self.text

    def run_animation(self):
        anim = animation.FuncAnimation(self.fig, self.animate, frames=100, interval=50, blit=True)
        plt.tight_layout()
        plt.show()

# 创建和运行优化后的动画
optimized_plot = OptimizedPlot()
print("Cached extra artists:")
print([type(artist).__name__ for artist in optimized_plot.extra_artists])
optimized_plot.run_animation()
在这个优化后的例子中,我们创建了一个OptimizedPlot类,它只在初始化时计算一次额外艺术家对象列表,并将其缓存以供后续使用。这种方法可以在处理复杂图表或长时间运行的动画时提高性能。
9. 总结
get_default_bbox_extra_artists()方法是Matplotlib中一个强大而灵活的工具,它允许我们获取与轴相关的所有额外艺术家对象。通过本文的详细介绍和多个示例,我们了解了该方法的用法、应用场景以及相关的高级技巧。
主要要点包括:
- 该方法返回一个包含额外艺术家对象的列表,这些对象通常包括图例、标题、坐标轴标签等。
- 在保存图像或调整布局时,使用这个方法可以确保所有重要元素都被包含在内。
- 它可以与其他Matplotlib功能(如子图和动画)结合使用,以创建更复杂的可视化。
- 在处理大量艺术家对象时,需要考虑性能优化,如缓存结果和限制对象数量。
通过掌握get_default_bbox_extra_artists()方法,你可以更好地控制Matplotlib图表的布局和外观,创建出更专业、更精确的数据可视化作品。无论是在科学研究、数据分析还是商业报告中,这个方法都能帮助你制作出高质量的图表,确保所有重要信息都被正确展示。
 极客笔记
极客笔记