Matplotlib中使用Artist.set_visible()方法控制图形元素可见性
参考:Matplotlib.artist.Artist.set_visible() in Python
Matplotlib是Python中最流行的数据可视化库之一,它提供了丰富的绘图功能和灵活的自定义选项。在Matplotlib中,几乎所有可见的图形元素都是Artist对象的实例。Artist类是Matplotlib中的基础类,它定义了许多通用的属性和方法,用于控制图形元素的外观和行为。其中,set_visible()方法是Artist类的一个重要方法,它允许我们动态地控制图形元素的可见性。本文将深入探讨Artist.set_visible()方法的使用,并通过多个示例来展示如何灵活地应用这个方法来创建交互式和动态的可视化效果。
1. Artist.set_visible()方法简介
Artist.set_visible()方法是Matplotlib中Artist类的一个方法,用于设置图形元素的可见性。这个方法接受一个布尔值参数:
- 当参数为
True时,图形元素将被显示。 - 当参数为
False时,图形元素将被隐藏。
通过调用这个方法,我们可以在不删除图形元素的情况下,动态地控制其是否显示在图表中。这为创建交互式图表和动态可视化提供了强大的支持。
下面是一个简单的示例,展示了如何使用set_visible()方法:
import matplotlib.pyplot as plt

fig, ax = plt.subplots()
line, = ax.plot([1, 2, 3, 4], [1, 4, 2, 3], label='how2matplotlib.com')

# 隐藏线条
line.set_visible(False)

plt.title('Demonstration of set_visible() - how2matplotlib.com')
plt.legend()
plt.show()
Output:
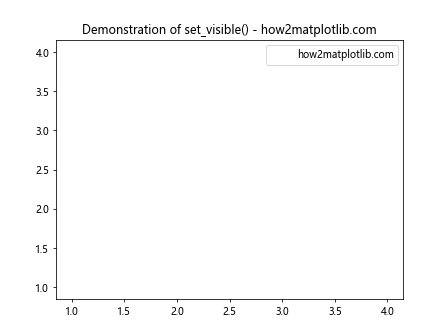
在这个例子中,我们首先创建了一个简单的线图。然后,通过调用line.set_visible(False),我们将线条隐藏。虽然线条在图例中仍然可见,但实际的线条不会显示在图表中。
2. 使用set_visible()控制不同类型的Artist对象
Matplotlib中的许多对象都继承自Artist类,因此都可以使用set_visible()方法。以下是一些常见的Artist对象及如何控制它们的可见性:
2.1 控制线条(Line2D)的可见性
import matplotlib.pyplot as plt

fig, ax = plt.subplots()
line1, = ax.plot([1, 2, 3, 4], [1, 4, 2, 3], label='Line 1 - how2matplotlib.com')
line2, = ax.plot([1, 2, 3, 4], [2, 3, 4, 1], label='Line 2 - how2matplotlib.com')

# 隐藏第二条线
line2.set_visible(False)

plt.title('Controlling Line Visibility - how2matplotlib.com')
plt.legend()
plt.show()
Output:
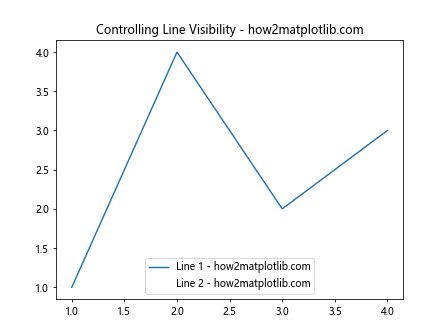
在这个例子中,我们创建了两条线,然后使用set_visible(False)隐藏了第二条线。这样,图表中只会显示第一条线,但图例中仍会显示两条线的信息。
2.2 控制文本(Text)的可见性
import matplotlib.pyplot as plt

fig, ax = plt.subplots()
ax.plot([1, 2, 3, 4], [1, 4, 2, 3])

text = ax.text(2, 3, 'Important Note - how2matplotlib.com', fontsize=12)

# 隐藏文本
text.set_visible(False)

plt.title('Controlling Text Visibility - how2matplotlib.com')
plt.show()
Output:
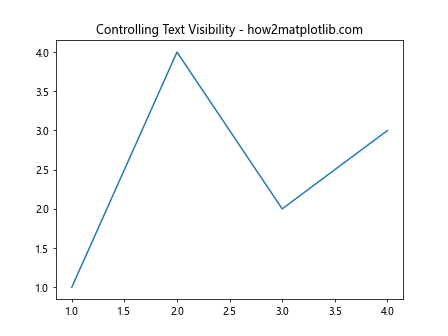
这个例子展示了如何控制文本对象的可见性。我们首先在图表中添加了一个文本对象,然后通过set_visible(False)将其隐藏。
2.3 控制图例(Legend)的可见性
import matplotlib.pyplot as plt

fig, ax = plt.subplots()
ax.plot([1, 2, 3, 4], [1, 4, 2, 3], label='Data - how2matplotlib.com')

legend = ax.legend()

# 隐藏图例
legend.set_visible(False)

plt.title('Controlling Legend Visibility - how2matplotlib.com')
plt.show()
Output:
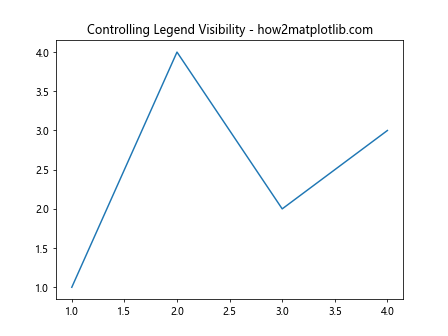
在这个例子中,我们创建了一个带有图例的简单图表,然后使用set_visible(False)来隐藏整个图例。
2.4 控制刻度标签(Tick Labels)的可见性
import matplotlib.pyplot as plt

fig, ax = plt.subplots()
ax.plot([1, 2, 3, 4], [1, 4, 2, 3])

# 隐藏x轴刻度标签
ax.xaxis.get_ticklabels()[1].set_visible(False)
ax.xaxis.get_ticklabels()[3].set_visible(False)

plt.title('Controlling Tick Label Visibility - how2matplotlib.com')
plt.show()
Output:
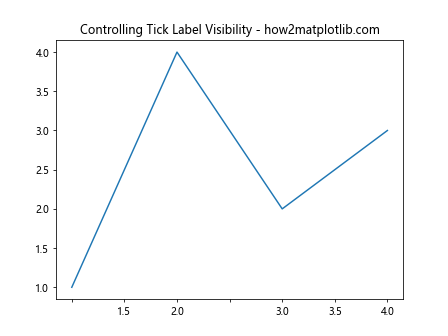
这个例子展示了如何控制个别刻度标签的可见性。我们隐藏了x轴上的第二个和第四个刻度标签。
3. 动态控制可见性
set_visible()方法的一个强大特性是它可以在运行时动态调用,这使得创建交互式和动画效果成为可能。
3.1 使用按钮控制可见性
import matplotlib.pyplot as plt
from matplotlib.widgets import Button

fig, ax = plt.subplots()
line, = ax.plot([1, 2, 3, 4], [1, 4, 2, 3], label='Data - how2matplotlib.com')

def toggle_visibility(event):
    line.set_visible(not line.get_visible())
    fig.canvas.draw()

ax_button = plt.axes([0.81, 0.05, 0.1, 0.075])
button = Button(ax_button, 'Toggle')
button.on_clicked(toggle_visibility)

plt.title('Dynamic Visibility Control - how2matplotlib.com')
plt.show()
Output:
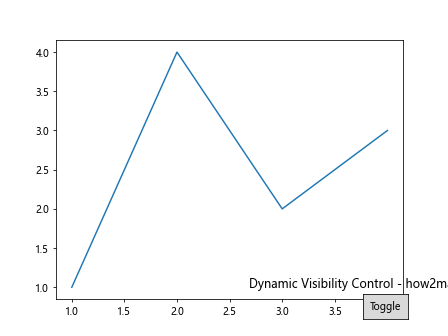
这个例子创建了一个带有切换按钮的图表。点击按钮可以切换线条的可见性。
3.2 使用滑块控制多个元素的可见性
import matplotlib.pyplot as plt
from matplotlib.widgets import Slider

fig, ax = plt.subplots()
lines = [ax.plot([1, 2, 3, 4], [i, i+3, i+1, i+2], label=f'Line {i} - how2matplotlib.com')[0] for i in range(1, 6)]

ax_slider = plt.axes([0.2, 0.02, 0.6, 0.03])
slider = Slider(ax_slider, 'Visible Lines', 0, 5, valinit=5, valstep=1)

def update(val):
    num_visible = int(slider.val)
    for i, line in enumerate(lines):
        line.set_visible(i < num_visible)
    fig.canvas.draw()

slider.on_changed(update)

plt.title('Controlling Multiple Lines Visibility - how2matplotlib.com')
plt.legend()
plt.show()
这个例子使用滑块来控制多条线的可见性。滑动滑块可以动态地显示或隐藏不同数量的线条。
4. 高级应用
4.1 创建动画效果
import matplotlib.pyplot as plt
import matplotlib.animation as animation
import numpy as np

fig, ax = plt.subplots()
x = np.linspace(0, 2*np.pi, 100)
line, = ax.plot(x, np.sin(x))

def animate(i):
    line.set_ydata(np.sin(x + i/10))
    line.set_visible(i % 20 < 10)  # 每10帧切换一次可见性
    return line,

ani = animation.FuncAnimation(fig, animate, frames=200, interval=50, blit=True)

plt.title('Animated Visibility Control - how2matplotlib.com')
plt.show()
Output:
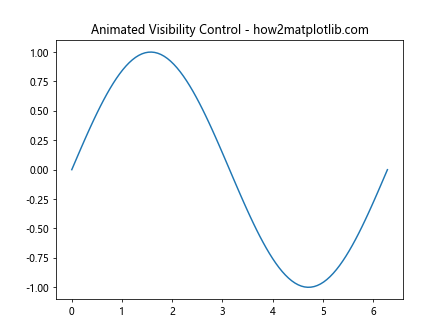
这个例子创建了一个简单的动画,其中正弦波的可见性每10帧切换一次,创造出闪烁的效果。
4.2 分层显示图表元素
import matplotlib.pyplot as plt
import numpy as np

fig, ax = plt.subplots()

# 创建多个图层
layers = []
for i in range(5):
    x = np.linspace(0, 10, 100)
    y = np.sin(x + i*np.pi/5) + i
    layer, = ax.plot(x, y, label=f'Layer {i+1} - how2matplotlib.com')
    layers.append(layer)
    layer.set_visible(False)

# 逐层显示
for i, layer in enumerate(layers):
    plt.pause(1)  # 暂停1秒
    layer.set_visible(True)
    plt.title(f'Showing Layer {i+1} - how2matplotlib.com')
    fig.canvas.draw()

plt.legend()
plt.show()
Output:
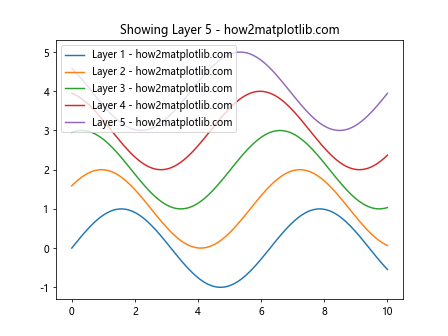
这个例子展示了如何创建一个分层的图表,并逐层显示每个元素。这种技术可以用于创建复杂的演示或教学材料。
4.3 交互式图例
import matplotlib.pyplot as plt

fig, ax = plt.subplots()

lines = []
for i in range(3):
    line, = ax.plot([1, 2, 3, 4], [i, i+1, i+2, i+3], label=f'Line {i+1} - how2matplotlib.com')
    lines.append(line)

leg = ax.legend(fancybox=True, shadow=True)

lined = {}  # 将图例文本映射到线条
for legline, origline in zip(leg.get_lines(), lines):
    legline.set_picker(5)  # 启用鼠标点击事件
    lined[legline] = origline

def onpick(event):
    legline = event.artist
    origline = lined[legline]
    vis = not origline.get_visible()
    origline.set_visible(vis)
    legline.set_alpha(1.0 if vis else 0.2)
    fig.canvas.draw()

fig.canvas.mpl_connect('pick_event', onpick)

plt.title('Interactive Legend - how2matplotlib.com')
plt.show()
Output:
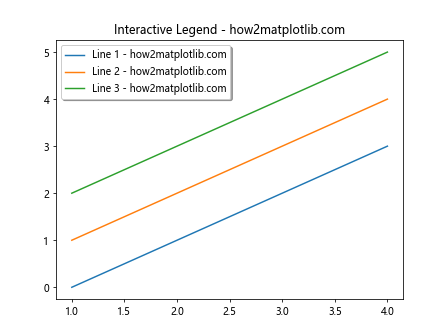
这个例子创建了一个交互式图例,用户可以通过点击图例中的项目来切换相应线条的可见性。
5. 性能考虑
虽然set_visible()方法提供了一种方便的方式来控制图形元素的可见性,但在处理大量元素或频繁更新时,需要考虑性能问题。以下是一些优化建议:
5.1 批量更新
当需要更新多个元素的可见性时,可以考虑批量更新,而不是逐个调用set_visible():
import matplotlib.pyplot as plt
import numpy as np

fig, ax = plt.subplots()

lines = [ax.plot(np.random.rand(10), label=f'Line {i} - how2matplotlib.com')[0] for i in range(100)]

def batch_update(visible_indices):
    for i, line in enumerate(lines):
        line.set_visible(i in visible_indices)
    fig.canvas.draw()

# 示例:只显示前10条线
batch_update(range(10))

plt.title('Batch Visibility Update - how2matplotlib.com')
plt.legend()
plt.show()
Output:
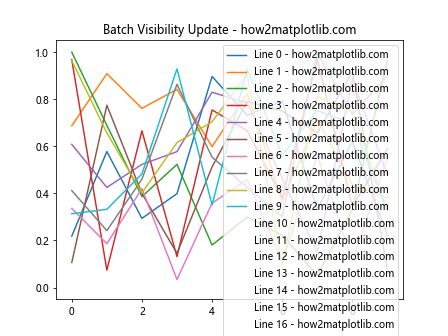
这个例子展示了如何一次性更新多个线条的可见性,而不是逐个调用set_visible()。
5.2 使用blitting技术
对于动画或频繁更新的场景,可以使用blitting技术来提高性能:
import matplotlib.pyplot as plt
import numpy as np

fig, ax = plt.subplots()
ax.set_xlim(0, 2*np.pi)
ax.set_ylim(-1, 1)

line, = ax.plot([], [])
background = fig.canvas.copy_from_bbox(ax.bbox)

def init():
    line.set_data([], [])
    return line,

def animate(i):
    fig.canvas.restore_region(background)
    x = np.linspace(0, 2*np.pi, 100)
    y = np.sin(x + i/10)
    line.set_data(x, y)
    line.set_visible(i % 20 < 10)
    ax.draw_artist(line)
    fig.canvas.blit(ax.bbox)

plt.title('Efficient Animation with Blitting - how2matplotlib.com')
plt.show()

for i in range(200):
    animate(i)
    plt.pause(0.05)
Output:
这个例子使用了blitting技术来创建一个高效的动画,同时还控制了线条的可见性。
6. 常见问题和解决方案
在使用set_visible()方法时,可能会遇到一些常见问题。以下是一些问题及其解决方案:
6.1 更新后图形不刷新
问题:调用set_visible()后,图形没有立即更新。
解决方案:确保在更改可见性后调用fig.canvas.draw()或plt.draw()来刷新图形。
import matplotlib.pyplot as plt

fig, ax = plt.subplots()
line, = ax.plot([1, 2, 3, 4], [1, 4, 2, 3], label='Data - how2matplotlib.com')

line.set_visible(False)
fig.canvas.draw()  # 刷新图形

plt.title('Refreshing After Visibility Change - how2matplotlib.com')
plt.show()
Output:
6.2 图例项目不随元素可见性变化
问题:当隐藏一个图形元素时,其对应的图例项目仍然可见。
解决方案:可以手动更新图例,或者在创建图例时使用特定的参数来自动处理这个问题。
import matplotlib.pyplot as plt

fig, ax = plt.subplots()
line1, = ax.plot([1, 2, 3, 4], [1, 4, 2, 3], label='Line 1 - how2matplotlib.com')
line2, = ax.plot([1, 2, 3, 4], [2, 3, 4, 1], label='Line 2 - how2matplotlib.com')

line2.set_visible(False)

# 使用 handler_map 参数创建图例
plt.legend(handler_map={plt.Line2D: plt.HandlerLine2D(update_func=lambda handle, orig: handle.set_visible(orig.get_visible()))})

plt.title('Legend Updating with Visibility - how2matplotlib.com')
plt.show()
这个例子展示了如何创建一个会自动根据线条可见性更新的图例。
6.3 动画中的闪烁问题
问题:在动画中频繁切换元素的可见性可能导致闪烁。
解决方案:使用双缓冲技术或blitting来减少闪烁。
import matplotlib.pyplot as plt
import matplotlib.animation as animation
import numpy as np

fig, ax = plt.subplots()
ax.set_xlim(0, 2*np.pi)
ax.set_ylim(-1, 1)

line, = ax.plot([], [])

def init():
    line.set_data([], [])
    return line,

def animate(i):
    x = np.linspace(0, 2*np.pi, 100)
    y = np.sin(x + i/10)
    line.set_data(x, y)
    line.set_visible(i % 20 < 10)
    return line,

ani = animation.FuncAnimation(fig, animate, init_func=init, frames=200, interval=50, blit=True)

plt.title('Smooth Animation with Visibility Changes - how2matplotlib.com')
plt.show()
Output:
这个例子使用了FuncAnimation和blit=True来创建一个平滑的动画,即使在频繁切换线条可见性的情况下也不会闪烁。
7. 与其他Artist属性的结合使用
set_visible()方法通常与其他Artist属性和方法结合使用,以创建更复杂和有趣的可视化效果。
7.1 结合透明度控制
import matplotlib.pyplot as plt
import numpy as np

fig, ax = plt.subplots()

x = np.linspace(0, 10, 100)
y1 = np.sin(x)
y2 = np.cos(x)

line1, = ax.plot(x, y1, label='Sin - how2matplotlib.com')
line2, = ax.plot(x, y2, label='Cos - how2matplotlib.com')

def update(event):
    if line1.get_visible():
        line1.set_visible(False)
        line2.set_alpha(1.0)
    else:
        line1.set_visible(True)
        line2.set_alpha(0.3)
    fig.canvas.draw()

fig.canvas.mpl_connect('button_press_event', update)

plt.title('Combining Visibility and Transparency - how2matplotlib.com')
plt.legend()
plt.show()
Output:
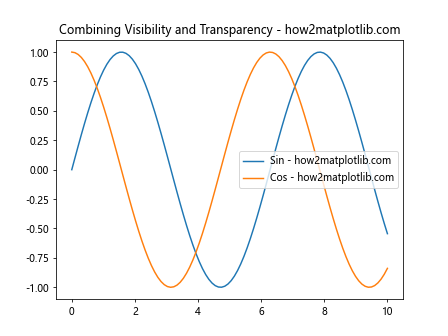
这个例子展示了如何结合使用set_visible()和set_alpha()来创建一个交互式图表,其中一条线的可见性和另一条线的透明度是相互关联的。
7.2 结合样式变化
import matplotlib.pyplot as plt
import numpy as np

fig, ax = plt.subplots()

x = np.linspace(0, 10, 100)
y = np.sin(x)

line, = ax.plot(x, y, label='Sin - how2matplotlib.com')
scatter = ax.scatter(x[::10], y[::10], color='red', label='Points - how2matplotlib.com')

def toggle(event):
    line.set_visible(not line.get_visible())
    if scatter.get_visible():
        scatter.set_visible(False)
    else:
        scatter.set_visible(True)
        scatter.set_color('green')
    fig.canvas.draw()

fig.canvas.mpl_connect('button_press_event', toggle)

plt.title('Toggling Visibility and Changing Style - how2matplotlib.com')
plt.legend()
plt.show()
Output:
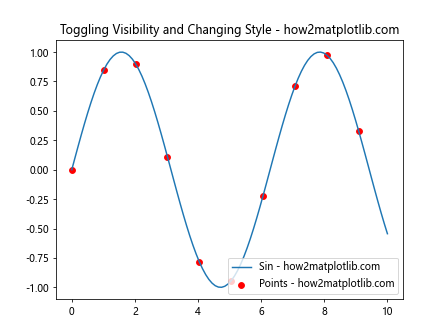
这个例子展示了如何在切换可见性的同时改变图形元素的样式。
8. 在复杂图表中的应用
在复杂的图表中,set_visible()方法可以用来创建分层的可视化效果或交互式探索工具。
8.1 多层热图
import matplotlib.pyplot as plt
import numpy as np

fig, ax = plt.subplots()

data1 = np.random.rand(10, 10)
data2 = np.random.rand(10, 10)

im1 = ax.imshow(data1, cmap='viridis', alpha=0.7)
im2 = ax.imshow(data2, cmap='plasma', alpha=0.7)

im2.set_visible(False)

def toggle(event):
    im1.set_visible(not im1.get_visible())
    im2.set_visible(not im2.get_visible())
    fig.canvas.draw()

fig.canvas.mpl_connect('button_press_event', toggle)

plt.title('Toggling Between Heatmaps - how2matplotlib.com')
plt.colorbar(im1, label='Data 1')
plt.colorbar(im2, label='Data 2')
plt.show()
Output:
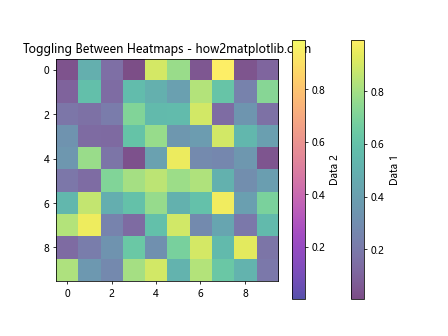
这个例子创建了两个重叠的热图,用户可以通过点击图表来切换它们的可见性。
8.2 交互式数据探索
import matplotlib.pyplot as plt
import numpy as np
from matplotlib.widgets import CheckButtons

fig, ax = plt.subplots()

x = np.linspace(0, 10, 100)
lines = [
    ax.plot(x, np.sin(x), label='Sin - how2matplotlib.com')[0],
    ax.plot(x, np.cos(x), label='Cos - how2matplotlib.com')[0],
    ax.plot(x, np.tan(x), label='Tan - how2matplotlib.com')[0]
]

plt.subplots_adjust(left=0.2)
ax_check = plt.axes([0.05, 0.4, 0.1, 0.15])
check = CheckButtons(ax_check, ['Sin', 'Cos', 'Tan'], [True, True, True])

def func(label):
    index = ['Sin', 'Cos', 'Tan'].index(label)
    lines[index].set_visible(not lines[index].get_visible())
    fig.canvas.draw()

check.on_clicked(func)

plt.title('Interactive Data Exploration - how2matplotlib.com')
plt.legend()
plt.show()
这个例子创建了一个交互式图表,用户可以通过复选框来控制不同函数图像的可见性。
9. 结合其他Matplotlib功能
set_visible()方法可以与Matplotlib的其他高级功能结合使用,以创建更复杂和强大的可视化效果。
9.1 与子图结合
import matplotlib.pyplot as plt
import numpy as np

fig, (ax1, ax2) = plt.subplots(1, 2, figsize=(12, 5))

x = np.linspace(0, 10, 100)
y1 = np.sin(x)
y2 = np.cos(x)

line1, = ax1.plot(x, y1, label='Sin - how2matplotlib.com')
line2, = ax2.plot(x, y2, label='Cos - how2matplotlib.com')

def toggle(event):
    if event.inaxes == ax1:
        line1.set_visible(not line1.get_visible())
    elif event.inaxes == ax2:
        line2.set_visible(not line2.get_visible())
    fig.canvas.draw()

fig.canvas.mpl_connect('button_press_event', toggle)

ax1.set_title('Click to toggle Sin')
ax2.set_title('Click to toggle Cos')
ax1.legend()
ax2.legend()

plt.suptitle('Toggling Visibility in Subplots - how2matplotlib.com')
plt.show()
Output:
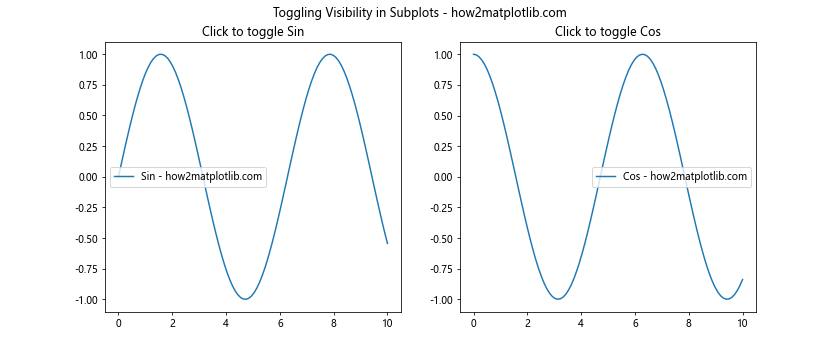
这个例子展示了如何在包含多个子图的图表中使用set_visible()方法。
9.2 与动画结合
import matplotlib.pyplot as plt
import matplotlib.animation as animation
import numpy as np

fig, ax = plt.subplots()

x = np.linspace(0, 2 * np.pi, 100)
line1, = ax.plot(x, np.sin(x), label='Sin - how2matplotlib.com')
line2, = ax.plot(x, np.cos(x), label='Cos - how2matplotlib.com')

def animate(i):
    line1.set_ydata(np.sin(x + i/10))
    line2.set_ydata(np.cos(x + i/10))
    line1.set_visible(i % 20 < 10)
    line2.set_visible(i % 20 >= 10)
    return line1, line2

ani = animation.FuncAnimation(fig, animate, frames=200, interval=50, blit=True)

plt.title('Animated Visibility Toggle - how2matplotlib.com')
plt.legend()
plt.show()
Output:
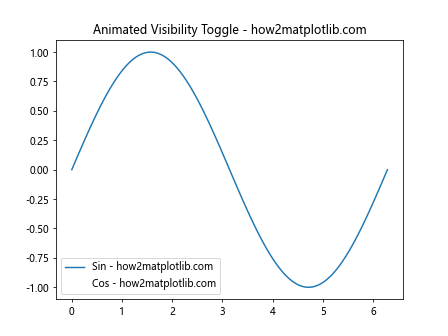
这个例子创建了一个动画,其中两条线的可见性交替变化,创造出一种闪烁的效果。
10. 总结
Matplotlib的Artist.set_visible()方法是一个强大而灵活的工具,可以用来控制图形元素的可见性。通过本文的详细介绍和多个示例,我们可以看到这个方法在创建动态、交互式和复杂的可视化中的重要作用。从简单的线条隐藏到复杂的多层图表交互,set_visible()方法都能提供有效的解决方案。
在实际应用中,set_visible()方法常常与其他Matplotlib功能结合使用,如动画、交互式控件、子图等,以创建更丰富和有吸引力的可视化效果。同时,在处理大量数据或需要频繁更新的场景中,也要注意性能优化,如使用批量更新或blitting技术。
通过掌握set_visible()方法及其相关技巧,开发者可以大大提升其数据可视化能力,创造出更加动态、交互和富有表现力的图表。无论是在数据分析、科学研究还是交互式应用开发中,这个方法都是一个不可或缺的工具。
 极客笔记
极客笔记