Matplotlib中使用Artist.set_url()方法为图形元素添加超链接
参考:Matplotlib.artist.Artist.set_url() in Python
Matplotlib是Python中最流行的数据可视化库之一,它提供了丰富的绘图功能和自定义选项。在Matplotlib中,几乎所有可见的元素都是Artist对象的实例。Artist类是Matplotlib中的基础类,它定义了许多通用属性和方法,其中set_url()方法就是其中之一。本文将详细介绍如何使用Artist.set_url()方法为Matplotlib图形中的各种元素添加超链接,以增强图表的交互性和信息量。
1. Artist.set_url()方法简介
Artist.set_url()是Matplotlib中Artist类的一个方法,用于为图形元素设置URL(统一资源定位符)。这个方法允许我们为图表中的各种元素(如线条、标记、文本等)添加超链接。当图表保存为支持超链接的格式(如SVG或PDF)时,这些链接可以被激活,使用户能够通过点击图表中的元素直接访问相关的网页或资源。
基本语法
artist.set_url(url)
其中,artist是任何Matplotlib Artist对象的实例,url是一个字符串,表示要链接到的URL。
让我们看一个简单的例子,为一条线添加URL:
import matplotlib.pyplot as plt

fig, ax = plt.subplots()
line, = ax.plot([0, 1, 2, 3], [0, 1, 0, 1], label='Line with URL')
line.set_url('https://how2matplotlib.com')
plt.title('Line with URL (SVG format required)')
plt.legend()
plt.savefig('line_with_url.svg')
plt.show()
Output:
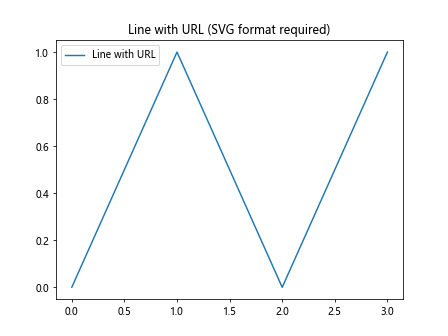
在这个例子中,我们创建了一个简单的线图,然后使用set_url()方法为这条线设置了一个URL。注意,我们将图表保存为SVG格式,因为它支持超链接功能。
2. 为不同类型的Artist对象添加URL
Matplotlib中有多种类型的Artist对象,我们可以为它们中的大多数添加URL。下面我们将探讨如何为不同类型的Artist对象设置URL。
2.1 为文本对象添加URL
文本对象是最常见的需要添加URL的元素之一。我们可以为标题、轴标签、图例等文本元素添加超链接。
import matplotlib.pyplot as plt

fig, ax = plt.subplots()
ax.plot([0, 1, 2, 3], [0, 1, 0, 1])

title = ax.set_title('Click me to visit how2matplotlib.com')
title.set_url('https://how2matplotlib.com')

xlabel = ax.set_xlabel('X-axis (with URL)')
xlabel.set_url('https://how2matplotlib.com/x-axis')

ylabel = ax.set_ylabel('Y-axis (with URL)')
ylabel.set_url('https://how2matplotlib.com/y-axis')

plt.savefig('text_with_urls.svg')
plt.show()
Output:

在这个例子中,我们为标题、x轴标签和y轴标签都添加了不同的URL。
2.2 为散点图中的点添加URL
在散点图中,我们可能希望为每个数据点添加不同的URL,以便用户可以点击查看更多关于该数据点的信息。
import matplotlib.pyplot as plt

fig, ax = plt.subplots()
x = [1, 2, 3, 4, 5]
y = [2, 3, 1, 4, 2]
urls = [f'https://how2matplotlib.com/point/{i}' for i in range(1, 6)]

scatter = ax.scatter(x, y)
for i, (x, y) in enumerate(zip(x, y)):
    point = scatter.get_paths()[i]
    point.set_url(urls[i])

plt.title('Scatter plot with URLs')
plt.savefig('scatter_with_urls.svg')
plt.show()
这个例子展示了如何为散点图中的每个点设置不同的URL。
2.3 为柱状图的每个柱子添加URL
柱状图是另一种常见的图表类型,我们可以为每个柱子添加URL。
import matplotlib.pyplot as plt

fig, ax = plt.subplots()
categories = ['A', 'B', 'C', 'D']
values = [3, 7, 2, 5]
urls = [f'https://how2matplotlib.com/category/{cat}' for cat in categories]

bars = ax.bar(categories, values)
for bar, url in zip(bars, urls):
    bar.set_url(url)

plt.title('Bar chart with URLs')
plt.savefig('bar_chart_with_urls.svg')
plt.show()
Output:
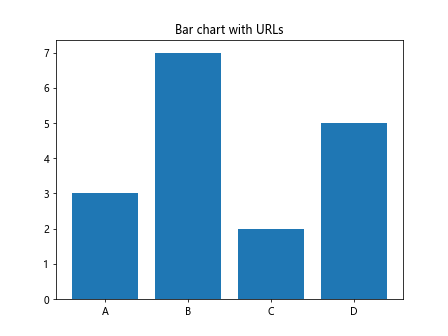
在这个例子中,我们为每个柱子设置了对应类别的URL。
3. 使用set_url()的注意事项
虽然set_url()方法使用起来相对简单,但在实际应用中还是有一些需要注意的地方:
3.1 文件格式的选择
并非所有的图像格式都支持超链接。SVG和PDF是最常用的支持超链接的格式。如果你使用其他格式(如PNG或JPG),URL信息将会丢失。
import matplotlib.pyplot as plt

fig, ax = plt.subplots()
line, = ax.plot([0, 1, 2, 3], [0, 1, 0, 1], label='Line with URL')
line.set_url('https://how2matplotlib.com')
plt.title('Line with URL (SVG format)')
plt.legend()

# 保存为SVG格式
plt.savefig('line_with_url.svg')

# 保存为PNG格式(URL信息会丢失)
plt.savefig('line_with_url.png')

plt.show()
Output:
3.2 URL的可见性
默认情况下,URL是不可见的。这意味着用户可能不知道图表中的哪些元素是可点击的。为了提高可用性,你可能需要通过其他视觉提示(如颜色或标记)来指示可点击的元素。
import matplotlib.pyplot as plt

fig, ax = plt.subplots()
x = [1, 2, 3, 4, 5]
y = [2, 3, 1, 4, 2]

scatter = ax.scatter(x, y, c=['red' if i % 2 == 0 else 'blue' for i in range(5)])
for i, (x, y) in enumerate(zip(x, y)):
    point = scatter.get_paths()[i]
    point.set_url(f'https://how2matplotlib.com/point/{i+1}')

plt.title('Scatter plot with URLs (red points are clickable)')
plt.savefig('scatter_with_visible_urls.svg')
plt.show()
在这个例子中,我们使用红色来标记可点击的点,以提供视觉提示。
3.3 交互性的限制
虽然set_url()可以为静态图像添加超链接,但它并不能提供真正的交互式体验。对于需要更高级交互性的应用,你可能需要考虑使用其他库,如Plotly或Bokeh。
4. 高级应用:结合其他Artist属性
set_url()方法可以与其他Artist属性结合使用,以创建更丰富的用户体验。
4.1 结合悬停文本
我们可以结合使用set_url()和set_gid()(设置图形元素的ID),然后通过自定义JavaScript来实现悬停显示URL的效果。
import matplotlib.pyplot as plt

fig, ax = plt.subplots()
x = [1, 2, 3, 4, 5]
y = [2, 3, 1, 4, 2]

scatter = ax.scatter(x, y)
for i, (x, y) in enumerate(zip(x, y)):
    point = scatter.get_paths()[i]
    url = f'https://how2matplotlib.com/point/{i+1}'
    point.set_url(url)
    point.set_gid(f'point_{i+1}')

plt.title('Scatter plot with URLs and hover effect')

# 添加自定义JavaScript以实现悬停效果
plt.gcf().text(0, 0, '', name='hover_info')
plt.gcf().text(0, 0, """
    <script type="text/javascript">
        var points = document.querySelectorAll('[id^="point_"]');
        var hoverInfo = document.getElementsByName('hover_info')[0];
        points.forEach(function(point) {
            point.addEventListener('mouseover', function() {
                hoverInfo.textContent = this.getAttribute('xlink:href');
            });
            point.addEventListener('mouseout', function() {
                hoverInfo.textContent = '';
            });
        });
    </script>
""", name='hover_script')

plt.savefig('scatter_with_hover_urls.svg')
plt.show()
这个例子展示了如何结合使用set_url()和自定义JavaScript来创建悬停显示URL的效果。
4.2 动态URL生成
在某些情况下,我们可能需要根据数据动态生成URL。这可以通过结合使用set_url()和数据处理来实现。
import matplotlib.pyplot as plt
import numpy as np

fig, ax = plt.subplots()
x = np.linspace(0, 10, 100)
y = np.sin(x)

line, = ax.plot(x, y)
ax.set_title('Sin curve with dynamic URLs')

def generate_url(x, y):
    return f'https://how2matplotlib.com/sin?x={x:.2f}&y={y:.2f}'

for i, (xi, yi) in enumerate(zip(x, y)):
    segment = line.get_segments()[i]
    url = generate_url(xi, yi)
    segment.set_url(url)

plt.savefig('sin_curve_with_dynamic_urls.svg')
plt.show()
这个例子展示了如何为正弦曲线的每个点动态生成URL,URL中包含了该点的x和y坐标信息。
5. 在不同类型的图表中应用set_url()
set_url()方法可以应用于各种类型的图表。让我们探索一些常见图表类型中的应用。
5.1 在折线图中应用set_url()
折线图是最常见的图表类型之一。我们可以为整条线或线上的特定点添加URL。
import matplotlib.pyplot as plt

fig, ax = plt.subplots()
x = [1, 2, 3, 4, 5]
y = [2, 3, 1, 4, 2]

line, = ax.plot(x, y, marker='o')
line.set_url('https://how2matplotlib.com/line-chart')

for i, (xi, yi) in enumerate(zip(x, y)):
    point = plt.plot(xi, yi, 'ro')[0]
    point.set_url(f'https://how2matplotlib.com/point/{i+1}')

plt.title('Line chart with URLs')
plt.savefig('line_chart_with_urls.svg')
plt.show()
Output:
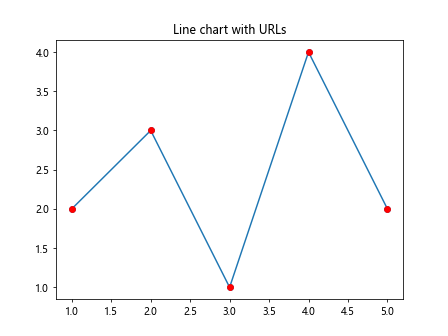
在这个例子中,我们为整条线添加了一个URL,同时为线上的每个点添加了单独的URL。
5.2 在饼图中应用set_url()
饼图是另一种常见的图表类型,我们可以为每个扇形添加URL。
import matplotlib.pyplot as plt

fig, ax = plt.subplots()
sizes = [15, 30, 45, 10]
labels = ['A', 'B', 'C', 'D']
urls = [f'https://how2matplotlib.com/category/{label}' for label in labels]

wedges, texts = ax.pie(sizes, labels=labels)

for wedge, url in zip(wedges, urls):
    wedge.set_url(url)

plt.title('Pie chart with URLs')
plt.savefig('pie_chart_with_urls.svg')
plt.show()
Output:
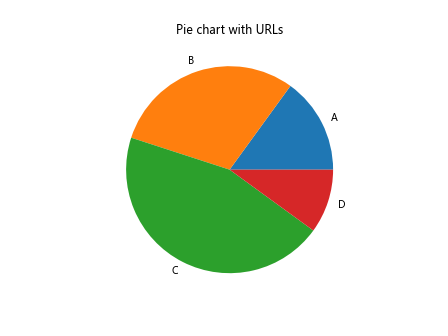
这个例子展示了如何为饼图中的每个扇形添加URL。
5.3 在热力图中应用set_url()
热力图通常用于显示矩阵数据,我们可以为每个单元格添加URL。
import matplotlib.pyplot as plt
import numpy as np

fig, ax = plt.subplots()
data = np.random.rand(5, 5)
im = ax.imshow(data)

for i in range(5):
    for j in range(5):
        text = ax.text(j, i, f'{data[i, j]:.2f}', ha='center', va='center')
        text.set_url(f'https://how2matplotlib.com/cell/{i}/{j}')

plt.title('Heatmap with URLs')
plt.colorbar(im)
plt.savefig('heatmap_with_urls.svg')
plt.show()
Output:
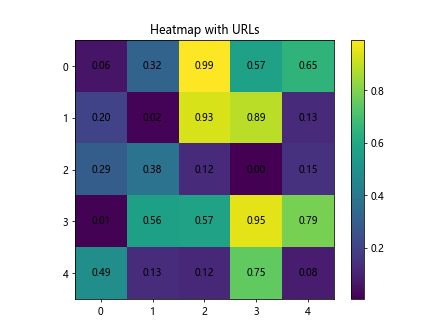
在这个例子中,我们为热力图中的每个单元格添加了URL。
6. set_url()在交互式环境中的应用
虽然set_url()主要用于静态图像,但在某些交互式环境中也可以发挥作用。
6.1 在Jupyter Notebook中使用set_url()
在Jupyter Notebook中,我们可以结合使用set_url()和HTML输出来创建可点击的图表。
import matplotlib.pyplot as plt
from IPython.display import HTML

fig, ax = plt.subplots()
x = [1, 2, 3, 4, 5]
y = [2, 3, 1, 4, 2]

scatter = ax.scatter(x, y)
for i, (xi, yi) in enumerate(zip(x, y)):
    point = scatter.get_paths()[i]
    point.set_url(f'https://how2matplotlib.com/point/{i+1}')

plt.title'Scatter plot with URLs in Jupyter')

# 保存为SVG并嵌入HTML
plt.savefig('jupyter_scatter.svg')
with open('jupyter_scatter.svg', 'r') as f:
    svg = f.read()

HTML(f'<div style="width:600px">{svg}</div>')
这个例子展示了如何在Jupyter Notebook中创建一个带有可点击URL的散点图。
6.2 在Web应用中使用set_url()
当将Matplotlib图表嵌入到Web应用中时,set_url()可以与前端JavaScript结合使用,以实现更丰富的交互体验。
import matplotlib.pyplot as plt
import io
import base64

fig, ax = plt.subplots()
x = [1, 2, 3, 4, 5]
y = [2, 3, 1, 4, 2]

scatter = ax.scatter(x, y)
for i, (xi, yi) in enumerate(zip(x, y)):
    point = scatter.get_paths()[i]
    point.set_url(f'https://how2matplotlib.com/point/{i+1}')

plt.title('Scatter plot with URLs for Web')

# 将图表保存为SVG字符串
buffer = io.StringIO()
plt.savefig(buffer, format='svg')
svg_str = buffer.getvalue()

# 创建HTML和JavaScript代码
html = f"""
<div id="plot-container">{svg_str}</div>
<script>
    document.querySelectorAll('#plot-container a').forEach(function(a) {{
        a.addEventListener('click', function(e) {{
            e.preventDefault();
            alert('You clicked a point with URL: ' + this.getAttribute('xlink:href'));
        }});
    }});
</script>
"""

# 在实际的Web应用中,你会将这个HTML字符串嵌入到你的页面中
print(html)
这个例子展示了如何将带有URL的Matplotlib图表嵌入到Web页面中,并使用JavaScript来处理点击事件。
7. set_url()的性能考虑
当使用set_url()为大量元素添加URL时,可能会对性能产生影响。以下是一些优化建议:
7.1 批量设置URL
对于包含大量元素的图表,可以考虑批量设置URL,而不是逐个设置。
import matplotlib.pyplot as plt
import numpy as np

fig, ax = plt.subplots()
n = 1000
x = np.random.rand(n)
y = np.random.rand(n)

scatter = ax.scatter(x, y)
paths = scatter.get_paths()
urls = [f'https://how2matplotlib.com/point/{i}' for i in range(n)]

for path, url in zip(paths, urls):
    path.set_url(url)

plt.title('Scatter plot with many URLs')
plt.savefig('many_urls_scatter.svg')
plt.show()
这个例子展示了如何为大量散点高效地设置URL。
7.2 使用集合对象
对于大量相似的对象,可以使用Matplotlib的集合对象来提高性能。
import matplotlib.pyplot as plt
import numpy as np
from matplotlib.collections import PathCollection

fig, ax = plt.subplots()
n = 1000
x = np.random.rand(n)
y = np.random.rand(n)

collection = PathCollection([plt.Circle((xi, yi), 0.01) for xi, yi in zip(x, y)])
ax.add_collection(collection)

urls = [f'https://how2matplotlib.com/point/{i}' for i in range(n)]
for path, url in zip(collection.get_paths(), urls):
    path.set_url(url)

ax.autoscale()
plt.title('Efficient URL setting with PathCollection')
plt.savefig('efficient_urls_collection.svg')
plt.show()
这个例子使用PathCollection来高效地为大量圆点设置URL。
8. set_url()的替代方案
虽然set_url()是Matplotlib中添加超链接的标准方法,但在某些情况下,可能需要考虑其他替代方案。
8.1 使用mpld3库
mpld3库可以将Matplotlib图表转换为交互式的D3.js可视化,它提供了更丰富的交互选项。
import matplotlib.pyplot as plt
import mpld3

fig, ax = plt.subplots()
x = [1, 2, 3, 4, 5]
y = [2, 3, 1, 4, 2]

scatter = ax.scatter(x, y)
for i, (xi, yi) in enumerate(zip(x, y)):
    tooltip = mpld3.plugins.PointHTMLTooltip(scatter, [f'<a href="https://how2matplotlib.com/point/{i+1}">Point {i+1}</a>'])
    mpld3.plugins.connect(fig, tooltip)

plt.title('Interactive scatter plot with mpld3')
mpld3.show()
这个例子展示了如何使用mpld3创建带有交互式工具提示和链接的散点图。
8.2 使用Plotly
对于需要更高级交互性的应用,可以考虑使用Plotly库。
import plotly.graph_objects as go

x = [1, 2, 3, 4, 5]
y = [2, 3, 1, 4, 2]
urls = [f'https://how2matplotlib.com/point/{i+1}' for i in range(5)]

fig = go.Figure(data=go.Scatter(
    x=x,
    y=y,
    mode='markers',
    marker=dict(size=10),
    text=[f'<a href="{url}">Point {i+1}</a>' for i, url in enumerate(urls)],
    hoverinfo='text'
))

fig.update_layout(title='Interactive scatter plot with Plotly')
fig.show()
这个例子展示了如何使用Plotly创建带有交互式链接的散点图。
9. 结合其他Matplotlib功能
set_url()方法可以与Matplotlib的其他功能结合使用,以创建更复杂和信息丰富的可视化。
9.1 结合注释使用
我们可以将set_url()与注释功能结合使用,为图表添加更多上下文信息。
import matplotlib.pyplot as plt

fig, ax = plt.subplots()
x = [1, 2, 3, 4, 5]
y = [2, 3, 1, 4, 2]

scatter = ax.scatter(x, y)
for i, (xi, yi) in enumerate(zip(x, y)):
    annotation = ax.annotate(f'Point {i+1}', (xi, yi), xytext=(5, 5), textcoords='offset points')
    annotation.set_url(f'https://how2matplotlib.com/point/{i+1}')

plt.title('Scatter plot with clickable annotations')
plt.savefig('scatter_with_clickable_annotations.svg')
plt.show()
Output:
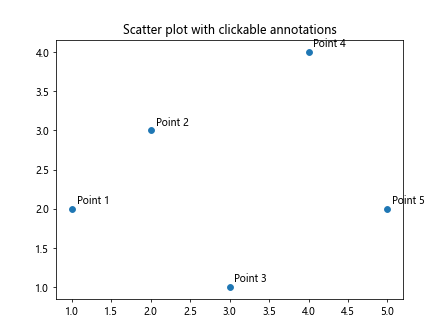
这个例子展示了如何为散点图中的每个点添加可点击的注释。
9.2 在子图中使用set_url()
当使用子图时,我们可以为每个子图中的元素单独设置URL。
import matplotlib.pyplot as plt

fig, (ax1, ax2) = plt.subplots(1, 2, figsize=(10, 5))

# 第一个子图
x1 = [1, 2, 3, 4, 5]
y1 = [2, 3, 1, 4, 2]
scatter1 = ax1.scatter(x1, y1)
for i, (xi, yi) in enumerate(zip(x1, y1)):
    point = scatter1.get_paths()[i]
    point.set_url(f'https://how2matplotlib.com/subplot1/point/{i+1}')
ax1.set_title('Subplot 1')

# 第二个子图
x2 = [1, 2, 3, 4, 5]
y2 = [1, 4, 2, 3, 5]
scatter2 = ax2.scatter(x2, y2)
for i, (xi, yi) in enumerate(zip(x2, y2)):
    point = scatter2.get_paths()[i]
    point.set_url(f'https://how2matplotlib.com/subplot2/point/{i+1}')
ax2.set_title('Subplot 2')

plt.suptitle('Subplots with URLs')
plt.savefig('subplots_with_urls.svg')
plt.show()
这个例子展示了如何在包含多个子图的图表中为每个子图的元素设置URL。
10. 总结
Matplotlib的Artist.set_url()方法为我们提供了一种简单而强大的方式来为图表元素添加超链接。通过本文的详细介绍和多个示例,我们探讨了如何在各种类型的图表和元素中应用这个方法,以及如何将其与其他Matplotlib功能结合使用。
虽然set_url()主要用于静态图像格式(如SVG和PDF),但我们也看到了如何在交互式环境中利用这个功能。对于需要更高级交互性的应用,我们还讨论了一些替代方案。
在实际应用中,set_url()可以大大增强数据可视化的信息量和用户体验。通过为图表元素添加相关链接,我们可以为用户提供更深入的背景信息或相关资源,使数据可视化不仅仅是数据的展示,更成为信息探索的起点。
然而,使用set_url()时也需要注意一些限制和最佳实践。例如,确保选择正确的文件格式,考虑性能影响,以及提供适当的视觉提示来指示可点击的元素。
总的来说,Artist.set_url()是Matplotlib工具箱中一个有价值的工具,能够帮助我们创建更丰富、更有信息量的数据可视化。通过合理使用这个功能,我们可以显著提升数据可视化的价值和用户体验。
 极客笔记
极客笔记