Matplotlib中使用Artist.get_path_effects()方法实现路径效果
参考:Matplotlib.artist.Artist.get_path_effects() in Python
Matplotlib是Python中最流行的数据可视化库之一,它提供了丰富的绘图功能和自定义选项。在Matplotlib中,Artist是所有可视化元素的基类,包括线条、文本、图形等。Artist类中的get_path_effects()方法是一个强大的工具,用于获取和管理应用于艺术家对象的路径效果。本文将深入探讨get_path_effects()方法的使用,并通过多个示例展示如何利用这个方法来增强图表的视觉效果。
1. get_path_effects()方法简介
get_path_effects()方法是Matplotlib中Artist类的一个成员函数,用于返回当前应用于艺术家对象的路径效果列表。路径效果是一种可以改变艺术家渲染方式的技术,例如添加阴影、描边或模糊效果等。
以下是一个简单的示例,展示如何使用get_path_effects()方法:
import matplotlib.pyplot as plt
import matplotlib.patheffects as path_effects

fig, ax = plt.subplots()
text = ax.text(0.5, 0.5, 'how2matplotlib.com', ha='center', va='center', fontsize=20)

# 获取当前的路径效果
current_effects = text.get_path_effects()
print(f"Current path effects: {current_effects}")

plt.show()
Output:
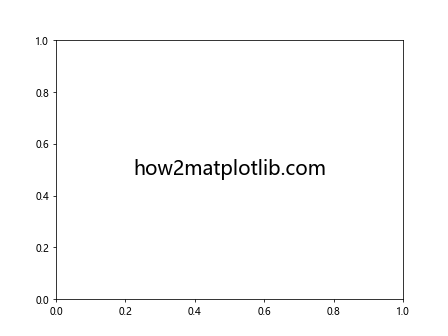
在这个例子中,我们创建了一个文本对象,并使用get_path_effects()方法获取其当前的路径效果。由于我们还没有应用任何效果,所以返回的列表应该是空的。
2. 设置路径效果
在使用get_path_effects()之前,我们通常需要先设置一些路径效果。这可以通过set_path_effects()方法来实现。让我们看一个例子:
import matplotlib.pyplot as plt
import matplotlib.patheffects as path_effects

fig, ax = plt.subplots()
text = ax.text(0.5, 0.5, 'how2matplotlib.com', ha='center', va='center', fontsize=20)

# 设置路径效果
text.set_path_effects([path_effects.withStroke(linewidth=3, foreground='red')])

# 获取并打印路径效果
effects = text.get_path_effects()
print(f"Applied path effects: {effects}")

plt.show()
Output:
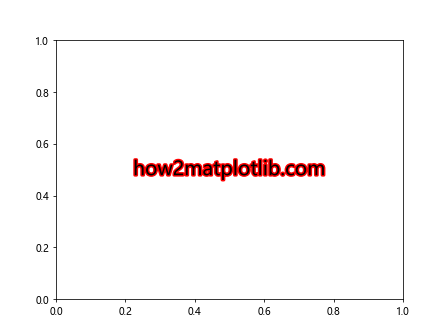
在这个例子中,我们为文本对象设置了一个描边效果,然后使用get_path_effects()方法获取并打印了应用的效果。
3. 常用的路径效果
Matplotlib提供了多种预定义的路径效果,我们可以通过get_path_effects()方法来查看和管理这些效果。以下是一些常用的路径效果:
3.1 描边效果(Stroke)
描边效果可以为艺术家对象添加轮廓。以下是一个使用描边效果的例子:
import matplotlib.pyplot as plt
import matplotlib.patheffects as path_effects

fig, ax = plt.subplots()
text = ax.text(0.5, 0.5, 'how2matplotlib.com', ha='center', va='center', fontsize=20)

# 设置描边效果
text.set_path_effects([path_effects.Stroke(linewidth=3, foreground='blue'),
                       path_effects.Normal()])

# 获取并打印路径效果
effects = text.get_path_effects()
print(f"Applied path effects: {effects}")

plt.show()
Output:
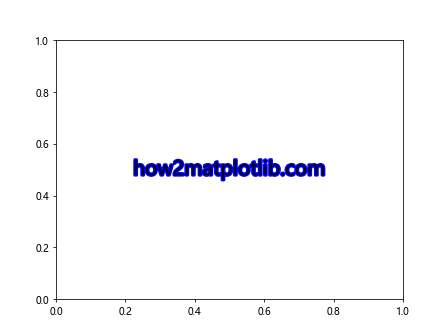
在这个例子中,我们为文本添加了一个蓝色的描边效果,并使用get_path_effects()方法获取了应用的效果。
3.2 阴影效果(Shadow)
阴影效果可以为艺术家对象添加阴影,增加立体感。下面是一个使用阴影效果的例子:
import matplotlib.pyplot as plt
import matplotlib.patheffects as path_effects

fig, ax = plt.subplots()
text = ax.text(0.5, 0.5, 'how2matplotlib.com', ha='center', va='center', fontsize=20)

# 设置阴影效果
text.set_path_effects([path_effects.withSimplePatchShadow()])

# 获取并打印路径效果
effects = text.get_path_effects()
print(f"Applied path effects: {effects}")

plt.show()
Output:
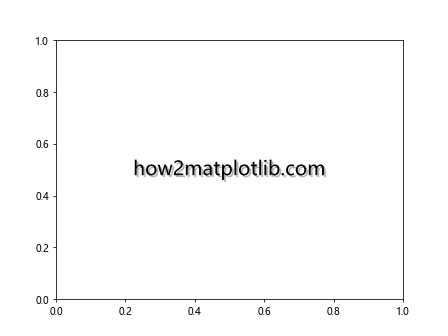
这个例子展示了如何为文本添加简单的阴影效果,并使用get_path_effects()方法获取应用的效果。
3.3 模糊效果(Blur)
模糊效果可以使艺术家对象看起来更柔和。以下是一个使用模糊效果的例子:
import matplotlib.pyplot as plt
import matplotlib.patheffects as path_effects

fig, ax = plt.subplots()
text = ax.text(0.5, 0.5, 'how2matplotlib.com', ha='center', va='center', fontsize=20)

# 设置模糊效果
text.set_path_effects([path_effects.SimpleLineShadow(),
                       path_effects.Normal()])

# 获取并打印路径效果
effects = text.get_path_effects()
print(f"Applied path effects: {effects}")

plt.show()
Output:
在这个例子中,我们为文本添加了一个简单的模糊效果,并使用get_path_effects()方法获取了应用的效果。
4. 组合多个路径效果
get_path_effects()方法允许我们查看应用于艺术家对象的多个路径效果。我们可以组合多个效果来创造更复杂的视觉效果。以下是一个组合描边和阴影效果的例子:
import matplotlib.pyplot as plt
import matplotlib.patheffects as path_effects

fig, ax = plt.subplots()
text = ax.text(0.5, 0.5, 'how2matplotlib.com', ha='center', va='center', fontsize=20)

# 设置组合效果
text.set_path_effects([
    path_effects.Stroke(linewidth=3, foreground='red'),
    path_effects.withSimplePatchShadow(shadow_rgbFace='blue', alpha=0.6),
    path_effects.Normal()
])

# 获取并打印路径效果
effects = text.get_path_effects()
print(f"Applied path effects: {effects}")

plt.show()
Output:
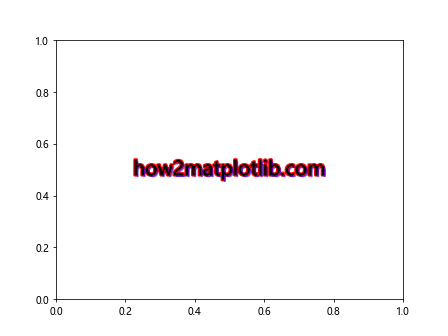
在这个例子中,我们为文本同时应用了描边和阴影效果,然后使用get_path_effects()方法获取了所有应用的效果。
5. 动态修改路径效果
get_path_effects()方法不仅可以用于查看当前的路径效果,还可以用于动态修改这些效果。以下是一个动态修改路径效果的例子:
import matplotlib.pyplot as plt
import matplotlib.patheffects as path_effects

fig, ax = plt.subplots()
text = ax.text(0.5, 0.5, 'how2matplotlib.com', ha='center', va='center', fontsize=20)

# 初始效果
text.set_path_effects([path_effects.withStroke(linewidth=2, foreground='red')])

# 获取当前效果
current_effects = text.get_path_effects()
print(f"Initial effects: {current_effects}")

# 修改效果
new_effects = current_effects + [path_effects.withSimplePatchShadow()]
text.set_path_effects(new_effects)

# 获取修改后的效果
updated_effects = text.get_path_effects()
print(f"Updated effects: {updated_effects}")

plt.show()
Output:
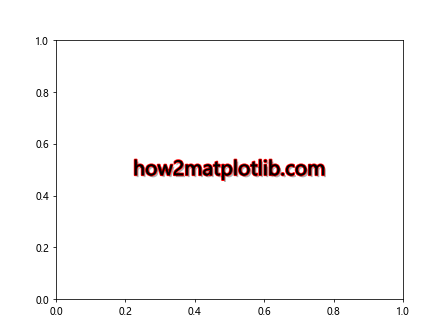
在这个例子中,我们首先设置了一个初始的描边效果,然后使用get_path_effects()获取当前效果。接着,我们添加了一个阴影效果,并再次使用get_path_effects()查看更新后的效果。
6. 应用于不同类型的艺术家对象
get_path_effects()方法不仅可以应用于文本对象,还可以用于其他类型的艺术家对象,如线条、标记等。以下是一些例子:
6.1 应用于线条
import matplotlib.pyplot as plt
import matplotlib.patheffects as path_effects
import numpy as np

fig, ax = plt.subplots()
x = np.linspace(0, 10, 100)
line, = ax.plot(x, np.sin(x), label='how2matplotlib.com')

# 设置线条效果
line.set_path_effects([path_effects.SimpleLineShadow(),
                       path_effects.Normal()])

# 获取并打印路径效果
effects = line.get_path_effects()
print(f"Applied path effects: {effects}")

plt.legend()
plt.show()
Output:
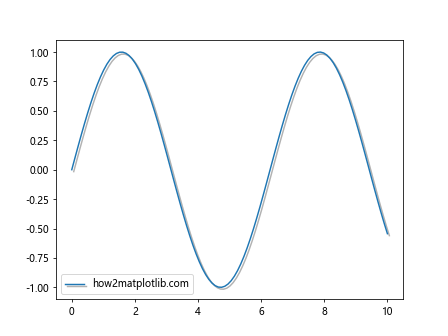
这个例子展示了如何为线条对象添加阴影效果,并使用get_path_effects()方法获取应用的效果。
6.2 应用于散点图
import matplotlib.pyplot as plt
import matplotlib.patheffects as path_effects
import numpy as np

fig, ax = plt.subplots()
x = np.random.rand(50)
y = np.random.rand(50)
scatter = ax.scatter(x, y, s=100, c='red', label='how2matplotlib.com')

# 设置散点效果
scatter.set_path_effects([path_effects.withSimplePatchShadow()])

# 获取并打印路径效果
effects = scatter.get_path_effects()
print(f"Applied path effects: {effects}")

plt.legend()
plt.show()
Output:
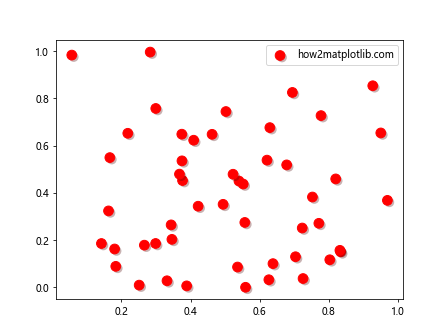
这个例子展示了如何为散点图添加阴影效果,并使用get_path_effects()方法获取应用的效果。
7. 自定义路径效果
除了使用预定义的路径效果,我们还可以创建自定义的路径效果。get_path_effects()方法同样可以用于获取这些自定义效果。以下是一个创建自定义路径效果的例子:
import matplotlib.pyplot as plt
import matplotlib.patheffects as path_effects

class CustomEffect(path_effects.AbstractPathEffect):
    def __init__(self, offset):
        self._offset = offset

    def draw_path(self, renderer, gc, tpath, affine, rgbFace):
        offset_path = tpath.transformed(affine +
                        plt.transforms.Affine2D().translate(*self._offset))
        renderer.draw_path(gc, offset_path, affine, rgbFace)

fig, ax = plt.subplots()
text = ax.text(0.5, 0.5, 'how2matplotlib.com', ha='center', va='center', fontsize=20)

# 设置自定义效果
text.set_path_effects([CustomEffect(offset=(1, 1)), path_effects.Normal()])

# 获取并打印路径效果
effects = text.get_path_effects()
print(f"Applied path effects: {effects}")

plt.show()
在这个例子中,我们创建了一个自定义的路径效果,它可以对文本进行偏移。然后我们使用get_path_effects()方法获取应用的效果。
8. 路径效果的性能考虑
虽然路径效果可以大大增强图表的视觉吸引力,但它们也可能对渲染性能产生影响。使用get_path_effects()方法可以帮助我们检查当前应用的效果,从而在需要时优化性能。以下是一个例子,展示如何根据效果的数量来调整渲染策略:
import matplotlib.pyplot as plt
import matplotlib.patheffects as path_effects

fig, ax = plt.subplots()
text = ax.text(0.5, 0.5, 'how2matplotlib.com', ha='center', va='center', fontsize=20)

# 设置多个效果
text.set_path_effects([
    path_effects.Stroke(linewidth=3, foreground='red'),
    path_effects.withSimplePatchShadow(),
    path_effects.withTickedStroke(angle=45),
    path_effects.Normal()
])

# 获取效果并检查数量
effects = text.get_path_effects()
print(f"Number of applied effects: {len(effects)}")

# 根据效果数量调整渲染策略
if len(effects) > 3:
    print("Warning: Large number of effects may impact performance.")
    # 这里可以添加优化代码,例如降低分辨率或简化某些效果

plt.show()
Output:
在这个例子中,我们使用get_path_effects()方法获取应用的效果,并根据效果的数量来决定是否需要进行性能优化。
9. 在动画中使用get_path_effects()
get_path_effects()方法在创建动画时也非常有用,可以用于动态更新路径效果。以下是一个简单的动画例子:
import matplotlib.pyplot as plt
import matplotlib.patheffects as path_effects
import matplotlib.animation as animation

fig, ax = plt.subplots()
text = ax.text(0.5, 0.5, 'how2matplotlib.com', ha='center', va='center', fontsize=20)

def animate(frame):
    # 根据帧数改变效果
    if frame % 2 == 0:
        text.set_path_effects([path_effects.withStroke(linewidth=3, foreground='red')])
    else:
        text.set_path_effects([path_effects.withSimplePatchShadow()])

    # 获取并打印当前效果
    effects = text.get_path_effects()
    print(f"Frame {frame}: {effects}")
    return text,

ani = animation.FuncAnimation(fig, animate, frames=10, interval=500, blit=True)
plt.show()
Output:
在这个例子中,我们创建了一个简单的动画,文本的路径效果在描边和阴影之间交替。我们使用get_path_effects()方法在每一帧打印当前的效果,这对于调试和理解动画过程非常有用。
10. 路径效果的保存和加载
在某些情况下,我们可能需要保存和加载路径效果配置。虽然Matplotlib没有直接提供这样的功能,但我们可以利用get_path_effects()方法来实现这一目标。以下是一个示例:
import matplotlib.pyplot as plt
import matplotlib.patheffects as path_effects
import pickle

def save_effects(artist, filename):
    effects = artist.get_path_effects()
    with open(filename, 'wb') as f:
        pickle.dump(effects, f)

def load_effects(artist, filename):
    with open(filename, 'rb') as f:
        effects = pickle.load(f)
    artist.set_path_effects(effects)

# 创建和设置文本
fig, ax = plt.subplots()
text = ax.text(0.5, 0.5, 'how2matplotlib.com', ha='center', va='center', fontsize=20)
text.set_path_effects([path_effects.withStroke(linewidth=3, foreground='red'),
                       path_effects.withSimplePatchShadow()])

# 保存效果
save_effects(text, 'text_effects.pkl')

# 清除效果
text.set_path_effects([])

# 加载效果
load_effects(text, 'text_effects.pkl')

# 获取并打印加载的效果
loaded_effects = text.get_path_effects()
print(f"Loaded effects: {loaded_effects}")

plt.show()
Output:
在这个例子中,我们定义了两个函数:save_effects()和load_effects()。save_effects()函数使用get_path_effects()方法获取当前的路径效果,并将其保存到文件中。load_effects()函数则从文件中加载效果并应用到艺术家对象上。
11. 路径效果的调试和故障排除
当使用复杂的路径效果时,可能会遇到一些问题。get_path_effects()方法在这种情况下非常有用,可以帮助我们调试和排除故障。以下是一个示例,展示如何使用get_path_effects()进行调试:
import matplotlib.pyplot as plt
import matplotlib.patheffects as path_effects

def debug_path_effects(artist):
    effects = artist.get_path_effects()
    print(f"Number of effects: {len(effects)}")
    for i, effect in enumerate(effects):
        print(f"Effect {i+1}: {type(effect).__name__}")
        print(f"  Parameters: {effect.__dict__}")

fig, ax = plt.subplots()
text = ax.text(0.5, 0.5, 'how2matplotlib.com', ha='center', va='center', fontsize=20)

# 设置一些复杂的效果
text.set_path_effects([
    path_effects.Stroke(linewidth=3, foreground='red'),
    path_effects.withSimplePatchShadow(shadow_rgbFace='blue', alpha=0.6),
    path_effects.withTickedStroke(spacing=7, angle=45),
    path_effects.Normal()
])

# 调试路径效果
debug_path_effects(text)

plt.show()
Output:
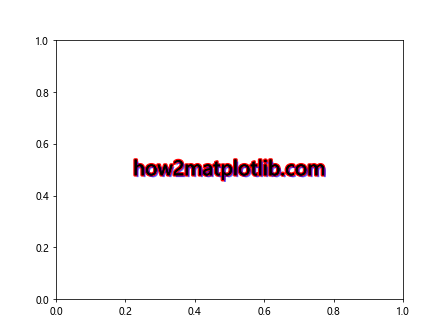
在这个例子中,我们定义了一个debug_path_effects()函数,它使用get_path_effects()方法获取所有应用的效果,然后打印每个效果的类型和参数。这对于理解复杂效果的组成和排查问题非常有帮助。
12. 路径效果与样式表
Matplotlib的样式表功能允许我们定义和应用预设的绘图样式。虽然样式表主要用于设置颜色、线型等基本属性,但我们也可以结合get_path_effects()方法来创建包含路径效果的自定义样式。以下是一个示例:
import matplotlib.pyplot as plt
import matplotlib.patheffects as path_effects

# 定义自定义样式
custom_style = {
    'text.color': 'blue',
    'font.size': 20,
    'path.effects': [path_effects.withStroke(linewidth=2, foreground='red')]
}

# 应用自定义样式
with plt.style.context(custom_style):
    fig, ax = plt.subplots()
    text = ax.text(0.5, 0.5, 'how2matplotlib.com', ha='center', va='center')

    # 获取并打印应用的效果
    effects = text.get_path_effects()
    print(f"Applied effects from style: {effects}")

plt.show()
Output:
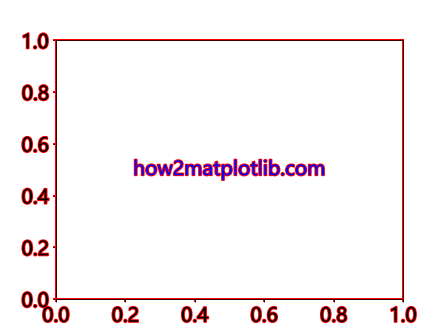
在这个例子中,我们定义了一个包含路径效果的自定义样式,并在创建文本时应用了这个样式。然后,我们使用get_path_effects()方法来验证效果是否正确应用。
13. 路径效果与图例
在创建图例时,我们可能也想应用路径效果。get_path_effects()方法可以帮助我们确保图例中的元素正确应用了效果。以下是一个示例:
import matplotlib.pyplot as plt
import matplotlib.patheffects as path_effects
import numpy as np

fig, ax = plt.subplots()

# 创建带有路径效果的线条
x = np.linspace(0, 10, 100)
line, = ax.plot(x, np.sin(x), label='how2matplotlib.com')
line.set_path_effects([path_effects.Stroke(linewidth=4, foreground='blue'),
                       path_effects.Normal()])

# 创建图例
legend = ax.legend()

# 检查图例中的路径效果
legend_line = legend.get_lines()[0]
effects = legend_line.get_path_effects()
print(f"Legend line effects: {effects}")

plt.show()
Output:
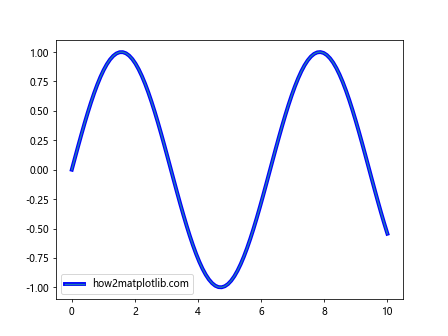
在这个例子中,我们为线条应用了路径效果,然后创建了一个图例。使用get_path_effects()方法,我们可以验证图例中的线条是否正确继承了这些效果。
14. 路径效果与坐标系变换
当我们在不同的坐标系中工作时,路径效果的行为可能会受到影响。get_path_effects()方法可以帮助我们理解在不同坐标系中效果是如何应用的。以下是一个在极坐标系中应用路径效果的例子:
import matplotlib.pyplot as plt
import matplotlib.patheffects as path_effects
import numpy as np

fig, ax = plt.subplots(subplot_kw=dict(projection='polar'))

# 创建极坐标数据
theta = np.linspace(0, 2*np.pi, 100)
r = np.sin(4*theta)

# 绘制带有路径效果的线条
line, = ax.plot(theta, r)
line.set_path_effects([path_effects.Stroke(linewidth=4, foreground='red'),
                       path_effects.Normal()])

# 获取并打印应用的效果
effects = line.get_path_effects()
print(f"Applied effects in polar coordinates: {effects}")

plt.show()
Output:
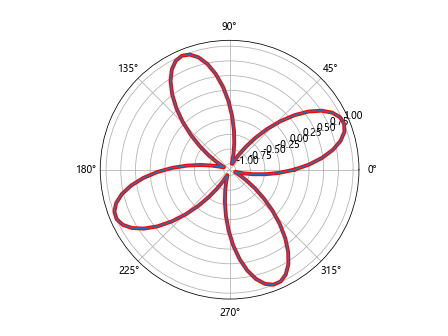
在这个例子中,我们在极坐标系中创建了一个图形,并应用了路径效果。使用get_path_effects()方法,我们可以确认效果是否正确应用,即使在非笛卡尔坐标系中。
15. 路径效果与交互式绘图
在创建交互式绘图时,我们可能需要动态地更新路径效果。get_path_effects()方法在这种情况下非常有用,可以帮助我们跟踪当前的效果状态。以下是一个使用Matplotlib的widgets模块创建交互式绘图的例子:
import matplotlib.pyplot as plt
import matplotlib.patheffects as path_effects
from matplotlib.widgets import Button

fig, ax = plt.subplots()
text = ax.text(0.5, 0.5, 'how2matplotlib.com', ha='center', va='center', fontsize=20)

def toggle_effect(event):
    current_effects = text.get_path_effects()
    if not current_effects:
        text.set_path_effects([path_effects.withStroke(linewidth=3, foreground='red')])
    else:
        text.set_path_effects([])

    # 打印更新后的效果
    updated_effects = text.get_path_effects()
    print(f"Updated effects: {updated_effects}")

    fig.canvas.draw_idle()

# 创建按钮
ax_button = plt.axes([0.4, 0.05, 0.2, 0.075])
button = Button(ax_button, 'Toggle Effect')
button.on_clicked(toggle_effect)

plt.show()
Output:
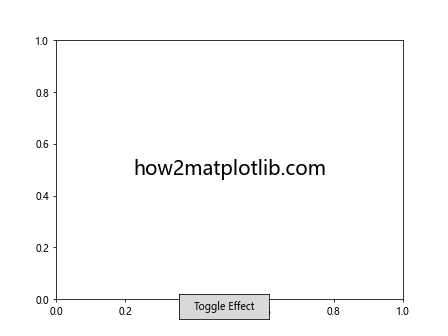
在这个例子中,我们创建了一个按钮,可以切换文本的路径效果。每次点击按钮时,我们都会使用get_path_effects()方法检查当前的效果状态,然后决定是添加还是移除效果。
结论
通过本文的详细探讨,我们深入了解了Matplotlib中Artist.get_path_effects()方法的使用和应用。这个方法不仅允许我们查看当前应用的路径效果,还为我们提供了一种管理和操作这些效果的方式。从简单的文本装饰到复杂的图形增强,get_path_effects()方法都展现出了其强大的功能和灵活性。
我们通过多个示例展示了如何在不同场景下使用get_path_effects()方法,包括基本用法、组合效果、自定义效果、动画创建、调试技巧等。这些例子不仅展示了方法的实际应用,还提供了处理各种可能遇到的问题的思路。
在数据可视化中,视觉效果往往能够极大地增强图表的表现力和吸引力。通过合理使用路径效果,并利用get_path_effects()方法进行管理和优化,我们可以创建出更加生动、专业的图表。无论是在科学研究、数据分析还是商业报告中,这些技巧都能帮助我们更好地传达信息,吸引读者的注意力。
最后,值得注意的是,虽然路径效果可以大大增强图表的视觉效果,但过度使用可能会导致图表变得杂乱或难以理解。因此,在应用这些效果时,我们应该始终牢记可读性和清晰度的重要性,合理使用get_path_effects()方法来管理和优化效果,以创建既美观又有效的数据可视化作品。
 极客笔记
极客笔记