Matplotlib中Artist对象的子元素管理:深入解析get_children()方法
参考:Matplotlib.artist.Artist.get_children() in Python
Matplotlib是Python中最流行的数据可视化库之一,它提供了丰富的绘图功能和灵活的自定义选项。在Matplotlib的架构中,Artist对象扮演着核心角色,它们是构建图形的基本单元。而get_children()方法则是Artist对象中一个非常重要的方法,它允许我们获取并操作Artist对象的子元素。本文将深入探讨get_children()方法的使用,以及它在Matplotlib绘图中的重要性和应用场景。
1. Artist对象简介
在深入了解get_children()方法之前,我们需要先了解Matplotlib中的Artist对象。Artist是Matplotlib中所有可视元素的基类,包括图形、轴、线条、文本等。它们构成了Matplotlib图形的层次结构。
以下是一个简单的示例,展示了如何创建一个包含Artist对象的基本图形:
import matplotlib.pyplot as plt

fig, ax = plt.subplots()
line, = ax.plot([1, 2, 3, 4], [1, 4, 2, 3], label='Data from how2matplotlib.com')
ax.set_title('Simple Plot')
ax.legend()

plt.show()
Output:
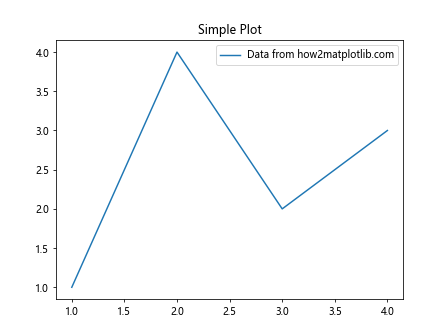
在这个例子中,fig(Figure对象)、ax(Axes对象)和line(Line2D对象)都是Artist的子类。
2. get_children()方法概述
get_children()是Artist类的一个方法,它返回当前Artist对象的直接子元素列表。这个方法对于理解和操作Matplotlib图形的层次结构非常有用。
下面是一个使用get_children()方法的简单示例:
import matplotlib.pyplot as plt

fig, ax = plt.subplots()
line, = ax.plot([1, 2, 3, 4], [1, 4, 2, 3], label='Data from how2matplotlib.com')

# 获取Axes对象的子元素
children = ax.get_children()
print(f"Number of children: {len(children)}")
for child in children:
    print(type(child))

plt.show()
Output:
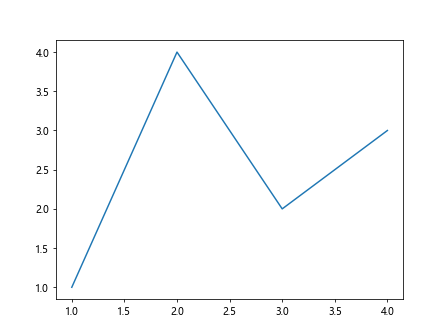
这个例子展示了如何获取Axes对象的子元素,并打印出每个子元素的类型。
3. 使用get_children()遍历图形结构
get_children()方法的一个重要应用是遍历整个图形的结构。通过递归调用这个方法,我们可以访问图形中的所有元素。
下面是一个递归遍历图形结构的示例:
import matplotlib.pyplot as plt

def explore_artist(artist, level=0):
    print("  " * level + str(type(artist)))
    if hasattr(artist, 'get_children'):
        for child in artist.get_children():
            explore_artist(child, level + 1)

fig, ax = plt.subplots()
ax.plot([1, 2, 3, 4], [1, 4, 2, 3], label='Data from how2matplotlib.com')
ax.set_title('Exploring Artist Structure')
ax.legend()

explore_artist(fig)

plt.show()
Output:
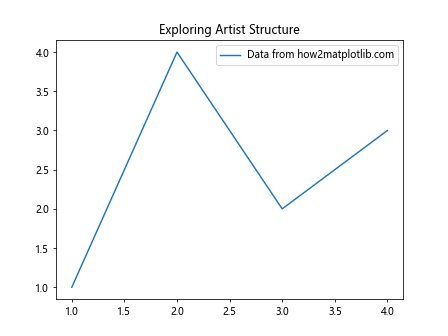
这个例子定义了一个explore_artist函数,它递归地打印出图形中每个Artist对象的类型和层级。
4. 修改子元素属性
get_children()方法不仅可以用于查看图形结构,还可以用于批量修改子元素的属性。这在需要统一调整多个元素的样式时特别有用。
以下是一个修改所有Line2D对象颜色的示例:
import matplotlib.pyplot as plt

fig, ax = plt.subplots()
ax.plot([1, 2, 3, 4], [1, 4, 2, 3], label='Line 1 from how2matplotlib.com')
ax.plot([1, 2, 3, 4], [3, 2, 4, 1], label='Line 2 from how2matplotlib.com')
ax.legend()

# 修改所有Line2D对象的颜色
for child in ax.get_children():
    if isinstance(child, plt.Line2D):
        child.set_color('red')

plt.show()
Output:
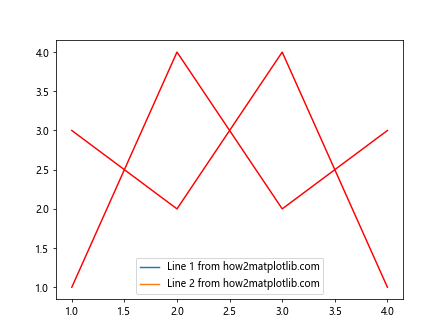
这个例子展示了如何使用get_children()方法找到所有Line2D对象,并将它们的颜色统一设置为红色。
5. 动态添加和删除子元素
get_children()方法还可以用于动态地管理图形中的元素。我们可以获取当前的子元素列表,然后添加新的元素或删除现有的元素。
下面是一个动态添加和删除文本元素的示例:
import matplotlib.pyplot as plt

fig, ax = plt.subplots()
ax.plot([1, 2, 3, 4], [1, 4, 2, 3], label='Data from how2matplotlib.com')

# 添加文本
text = ax.text(2, 3, 'New text from how2matplotlib.com', color='red')

# 显示当前子元素
print("Children before removal:")
for child in ax.get_children():
    print(type(child))

# 删除文本
ax.texts.remove(text)

# 显示删除后的子元素
print("\nChildren after removal:")
for child in ax.get_children():
    print(type(child))

plt.show()
这个例子演示了如何添加一个文本元素,然后使用get_children()方法查看子元素列表,最后删除该文本元素并再次查看子元素列表。
6. 使用get_children()进行自定义绘图
get_children()方法在创建自定义绘图函数时非常有用。它允许我们访问和修改图形中的特定元素,从而实现复杂的自定义效果。
以下是一个自定义绘图函数的示例,它使用get_children()方法来修改特定的元素:
import matplotlib.pyplot as plt
import numpy as np

def custom_plot(x, y, highlight_max=True):
    fig, ax = plt.subplots()
    line, = ax.plot(x, y, label='Data from how2matplotlib.com')
    ax.set_title('Custom Plot')
    ax.legend()

    if highlight_max:
        max_index = np.argmax(y)
        ax.plot(x[max_index], y[max_index], 'ro', markersize=10)

    # 使用get_children()修改特定元素
    for child in ax.get_children():
        if isinstance(child, plt.Line2D) and child != line:
            child.set_label('Max Point')
            break

    ax.legend()
    return fig, ax

x = np.linspace(0, 10, 100)
y = np.sin(x)

custom_plot(x, y)
plt.show()
Output:
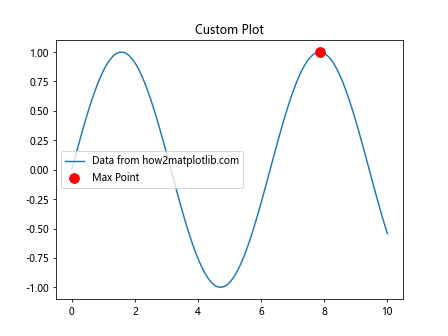
这个例子定义了一个custom_plot函数,它不仅绘制了数据,还标记了最大值点。通过使用get_children()方法,我们能够找到并修改最大值点的标记属性。
7. 在动画中使用get_children()
get_children()方法在创建动画时也非常有用。它允许我们在每一帧更新特定的图形元素,而不是重新绘制整个图形。
下面是一个使用get_children()方法创建简单动画的示例:
import matplotlib.pyplot as plt
import matplotlib.animation as animation
import numpy as np

fig, ax = plt.subplots()
x = np.linspace(0, 2*np.pi, 100)
line, = ax.plot(x, np.sin(x))

def animate(frame):
    y = np.sin(x + frame/10)
    line.set_ydata(y)

    # 使用get_children()更新标题
    for child in ax.get_children():
        if isinstance(child, plt.Text) and child.get_position()[1] > 1:
            child.set_text(f'Frame {frame} from how2matplotlib.com')
            break
    return line,

ani = animation.FuncAnimation(fig, animate, frames=100, interval=50, blit=True)
plt.show()
Output:
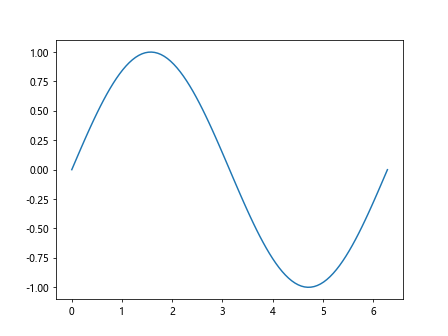
这个例子创建了一个正弦波动画,并使用get_children()方法在每一帧更新标题文本。
8. 使用get_children()进行图形元素的选择性隐藏
get_children()方法还可以用于选择性地隐藏或显示图形中的特定元素。这在创建交互式图形或需要动态调整图形显示内容时特别有用。
以下是一个示例,展示如何使用get_children()方法来隐藏和显示图例:
import matplotlib.pyplot as plt

fig, ax = plt.subplots()
ax.plot([1, 2, 3, 4], [1, 4, 2, 3], label='Line 1 from how2matplotlib.com')
ax.plot([1, 2, 3, 4], [3, 2, 4, 1], label='Line 2 from how2matplotlib.com')
legend = ax.legend()

# 隐藏图例
legend.set_visible(False)

# 使用get_children()找到并显示图例
for child in ax.get_children():
    if isinstance(child, plt.Legend):
        child.set_visible(True)
        break

plt.show()
这个例子首先创建了一个包含两条线的图形和图例,然后隐藏图例,最后使用get_children()方法找到图例并重新显示它。
9. 使用get_children()进行图形元素的分组操作
get_children()方法可以帮助我们对图形中的元素进行分组操作。这在需要同时修改多个相似元素的属性时非常有用。
下面是一个对所有文本元素进行分组操作的示例:
import matplotlib.pyplot as plt

fig, ax = plt.subplots()
ax.plot([1, 2, 3, 4], [1, 4, 2, 3], label='Data from how2matplotlib.com')
ax.set_title('Title')
ax.set_xlabel('X-axis')
ax.set_ylabel('Y-axis')
ax.legend()

# 使用get_children()找到所有文本元素并修改它们的颜色
text_elements = [child for child in ax.get_children() if isinstance(child, plt.Text)]
for text in text_elements:
    text.set_color('red')

plt.show()
Output:
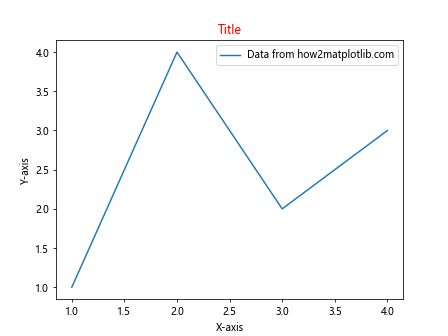
这个例子展示了如何使用get_children()方法找到所有文本元素(包括标题、轴标签和图例),并将它们的颜色统一设置为红色。
10. 在子图中使用get_children()
当处理包含多个子图的复杂图形时,get_children()方法同样适用。我们可以使用它来访问和修改特定子图中的元素。
以下是一个在多个子图中使用get_children()方法的示例:
import matplotlib.pyplot as plt

fig, (ax1, ax2) = plt.subplots(1, 2, figsize=(10, 5))

ax1.plot([1, 2, 3, 4], [1, 4, 2, 3], label='Data 1 from how2matplotlib.com')
ax2.plot([1, 2, 3, 4], [3, 2, 4, 1], label='Data 2 from how2matplotlib.com')

# 修改第一个子图中的线条颜色
for child in ax1.get_children():
    if isinstance(child, plt.Line2D):
        child.set_color('red')

# 修改第二个子图中的背景颜色
for child in ax2.get_children():
    if isinstance(child, plt.Rectangle) and child.get_facecolor() == (1, 1, 1, 1):  # 白色背景
        child.set_facecolor('lightblue')

plt.tight_layout()
plt.show()
Output:
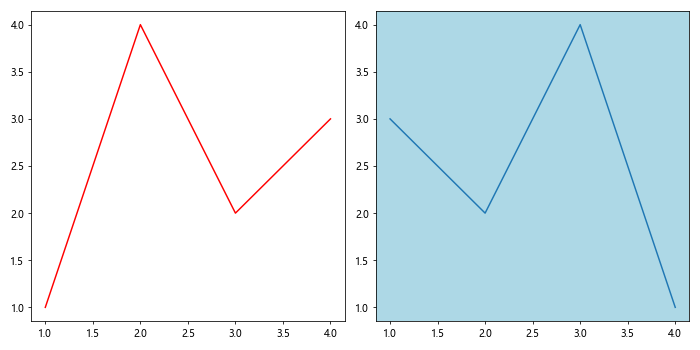
这个例子创建了两个子图,然后使用get_children()方法分别修改了第一个子图中线条的颜色和第二个子图的背景颜色。
11. 使用get_children()进行图形元素的计数
get_children()方法还可以用于统计图形中特定类型元素的数量。这在分析复杂图形结构或调试时特别有用。
下面是一个统计图形中不同类型元素数量的示例:
import matplotlib.pyplot as plt
from collections import Counter

fig, ax = plt.subplots()
ax.plot([1, 2, 3, 4], [1, 4, 2, 3], label='Line 1 from how2matplotlib.com')
ax.plot([1, 2, 3, 4], [3, 2, 4, 1], label='Line 2 from how2matplotlib.com')
ax.set_title('Element Count Example')
ax.legend()

# 使用get_children()统计元素数量
element_types = [type(child).__name__ for child in ax.get_children()]
element_count = Counter(element_types)

for element_type, count in element_count.items():
    print(f"{element_type}: {count}")

plt.show()
Output:
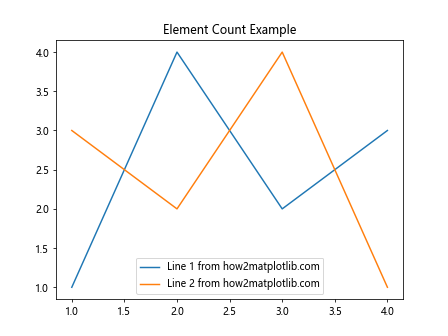
这个例子使用get_children()方法获取所有子元素,然后使用Counter类统计每种类型元素的数量。
12. 使用get_children()进行图形元素的深度搜索
有时,我们需要在图形的深层结构中查找特定的元素。get_children()方法可以用于实现深度优先搜索,以找到符合特定条件的元素。
以下是一个使用深度优先搜索查找特定元素的示例:
import matplotlib.pyplot as plt

def deep_search(artist, condition):
    if condition(artist):
        return artist
    if hasattr(artist, 'get_children'):
        for child in artist.get_children():
            result = deep_search(child, condition)
            if result:
                return result
    return None

fig, ax = plt.subplots()
ax.plot([1, 2, 3, 4], [1, 4, 2, 3], label='Data from how2matplotlib.com')
ax.set_title('Deep Search Example')
ax.legend()

# 搜索标题文本
title = deep_search(fig, lambda x: isinstance(x, plt.Text) and x.get_text() == 'Deep Search Example')

if title:
    title.set_color('red')

plt.show()
Output:
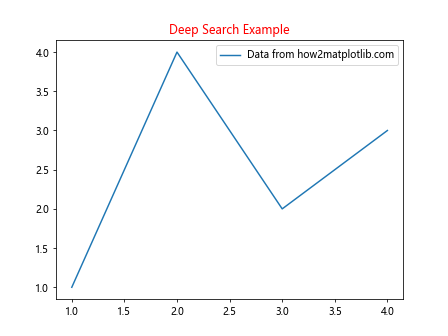
这个例子定义了一个deep_search函数,它递归地搜索图形结构,找到符合特定条件的元素。在这里,我们用它来查找并修改标题文本的颜色。
13. 使用get_children()进行图形元素的批量样式设置
get_children()方法非常适合用于批量设置图形元素的样式。这在需要统一多个元素的外观时特别有用。
下面是一个批量设置线条样式的示例:
import matplotlib.pyplot as plt
import numpy as np

fig, ax = plt.subplots()

# 绘制多条线
for i in range(5):
    x = np.linspace(0, 10, 100)
    y = np.sin(x + i)
    ax.plot(x, y, label=f'Line {i+1} from how2matplotlib.com')

ax.legend()

# 使用get_children()批量设置线条样式
lines = [child for child in ax.get_children() if isinstance(child, plt.Line2D)]
for i, line in enumerate(lines):
    line.set_linestyle(['solid', 'dashed', 'dotted', 'dashdot'][i % 4])
    line.set_linewidth(2)

plt.show()
Output:
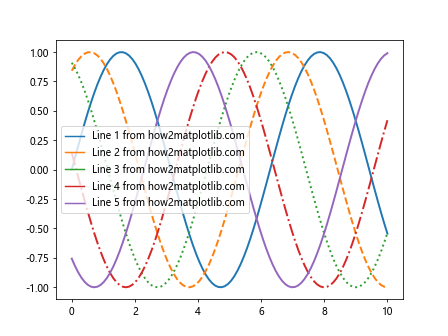
这个例子绘制了多条正弦曲线,然后使用get_children()方法找到所有Line2D对象,并为它们设置不同的线型和线宽。
14. 使用get_children()进行图形元素的动态更新
在创建交互式图形或实时数据可视化时,get_children()方法可以用于动态更新图形元素。这允许我们在不重新绘制整个图形的情况下更新特定元素。
以下是一个动态更新折线图数据的示例:
import matplotlib.pyplot as plt
import numpy as np
from matplotlib.animation import FuncAnimation

fig, ax = plt.subplots()
line, = ax.plot([], [], label='Dynamic data from how2matplotlib.com')
ax.set_xlim(0, 10)
ax.set_ylim(-1, 1)
ax.legend()

def update(frame):
    x = np.linspace(0, 10, 100)
    y = np.sin(x + frame / 10)
    line.set_data(x, y)

    # 使用get_children()更新标题
    for child in ax.get_children():
        if isinstance(child, plt.Text) and child.get_position()[1] > 1:
            child.set_text(f'Frame: {frame}')
            break

    return line,

ani = FuncAnimation(fig, update, frames=100, interval=50, blit=True)
plt.show()
Output:
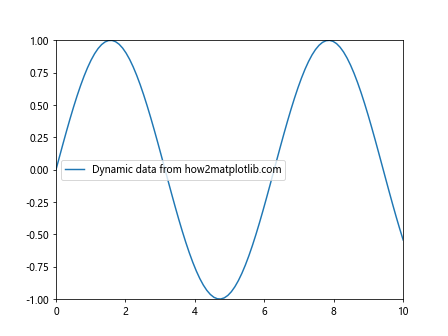
这个例子创建了一个动画,其中折线图的数据和标题文本在每一帧都会更新。get_children()方法用于找到并更新标题文本。
15. 使用get_children()进行图形元素的条件筛选
get_children()方法结合列表推导式或过滤函数,可以方便地对图形元素进行条件筛选。这在需要对特定类型或特定属性的元素进行操作时非常有用。
下面是一个根据条件筛选并修改图形元素的示例:
import matplotlib.pyplot as plt
import numpy as np

fig, ax = plt.subplots()

# 绘制多条线
for i in range(5):
    x = np.linspace(0, 10, 100)
    y = np.sin(x + i)
    ax.plot(x, y, label=f'Line {i+1} from how2matplotlib.com')

ax.legend()

# 使用get_children()筛选并修改特定线条
lines = [child for child in ax.get_children() if isinstance(child, plt.Line2D)]
for line in lines:
    if 'Line 2' in line.get_label() or 'Line 4' in line.get_label():
        line.set_color('red')
        line.set_linewidth(3)

plt.show()
Output:
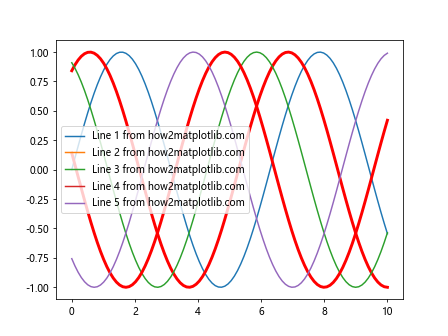
这个例子绘制了多条正弦曲线,然后使用get_children()方法和条件筛选找到标签包含”Line 2″或”Line 4″的线条,并修改它们的颜色和线宽。
结论
通过本文的详细探讨,我们深入了解了Matplotlib中Artist.get_children()方法的强大功能和灵活应用。这个方法不仅允许我们查看和遍历图形的层次结构,还能够进行精细的元素操作、动态更新、条件筛选等高级操作。无论是创建复杂的静态图形,还是开发交互式可视化应用,get_children()方法都是一个不可或缺的工具。
通过掌握get_children()方法,我们可以更好地控制Matplotlib图形的每个细节,实现更加灵活和强大的数据可视化。这不仅提高了我们使用Matplotlib的效率,也为创造更加丰富和个性化的可视化效果打开了新的可能性。
在实际应用中,建议读者根据具体需求灵活运用get_children()方法,结合其他Matplotlib功能,以创建出既美观又富有信息量的数据可视化作品。随着对这个方法的深入理解和熟练应用,您将能够更加得心应手地处理各种复杂的可视化任务,为您的数据分析和展示工作增添新的维度。
 极客笔记
极客笔记