Matplotlib中的Artist.get_animated()方法:动画效果控制详解
参考:Matplotlib.artist.Artist.get_animated() in Python
Matplotlib是Python中最流行的数据可视化库之一,它提供了丰富的绘图功能和灵活的自定义选项。在Matplotlib中,Artist是所有可视化元素的基类,包括线条、文本、图像等。本文将深入探讨Artist类中的get_animated()方法,这是一个用于控制图形元素动画效果的重要方法。
1. Artist类简介
在深入了解get_animated()方法之前,我们先简要介绍一下Artist类。Artist是Matplotlib中所有可绘制对象的基类,它定义了一系列通用属性和方法,用于控制图形元素的外观和行为。
以下是一个简单的示例,展示了如何创建一个Artist对象:
import matplotlib.pyplot as plt
from matplotlib.patches import Rectangle

fig, ax = plt.subplots()
rect = Rectangle((0.1, 0.1), 0.8, 0.8, facecolor='r')
ax.add_patch(rect)
ax.text(0.5, 0.5, 'how2matplotlib.com', ha='center', va='center')
plt.show()
Output:
在这个例子中,我们创建了一个Rectangle对象,它是Artist的子类。我们将矩形添加到坐标轴中,并显示图形。
2. get_animated()方法概述
get_animated()方法是Artist类的一个属性访问器方法,用于获取当前Artist对象的动画状态。这个方法返回一个布尔值,表示该对象是否处于动画模式。
以下是一个简单的示例,展示了如何使用get_animated()方法:
import matplotlib.pyplot as plt
from matplotlib.patches import Circle

fig, ax = plt.subplots()
circle = Circle((0.5, 0.5), 0.2, facecolor='b')
ax.add_patch(circle)
ax.text(0.5, 0.8, 'how2matplotlib.com', ha='center')

print(f"Circle is animated: {circle.get_animated()}")
plt.show()
Output:
在这个例子中,我们创建了一个Circle对象,并使用get_animated()方法检查它的动画状态。默认情况下,Artist对象的动画状态为False。
3. 动画状态的作用
动画状态对于Matplotlib的绘图过程有重要影响。当一个Artist对象的动画状态为True时,Matplotlib会采用特殊的绘制策略来优化性能,特别是在创建动画时。
以下是一个示例,展示了如何设置和获取动画状态:
import matplotlib.pyplot as plt
from matplotlib.patches import Rectangle

fig, ax = plt.subplots()
rect = Rectangle((0.1, 0.1), 0.8, 0.8, facecolor='g')
ax.add_patch(rect)
ax.text(0.5, 0.5, 'how2matplotlib.com', ha='center', va='center')

print(f"Before: Rectangle is animated: {rect.get_animated()}")
rect.set_animated(True)
print(f"After: Rectangle is animated: {rect.get_animated()}")

plt.show()
Output:
在这个例子中,我们首先检查矩形的初始动画状态,然后使用set_animated()方法将其设置为True,最后再次检查动画状态。
4. 动画状态与blitting
动画状态与Matplotlib中的blitting技术密切相关。Blitting是一种优化技术,可以显著提高动画的性能。当使用blitting时,只有标记为动画的Artist对象会被重新绘制,而其他静态元素保持不变。
以下是一个使用blitting创建简单动画的示例:
import matplotlib.pyplot as plt
import numpy as np

fig, ax = plt.subplots()
x = np.linspace(0, 2*np.pi, 100)
line, = ax.plot(x, np.sin(x))
ax.text(np.pi, 0, 'how2matplotlib.com', ha='center')

line.set_animated(True)
fig.canvas.draw()
background = fig.canvas.copy_from_bbox(ax.bbox)

for i in range(100):
    line.set_ydata(np.sin(x + i/10.0))
    fig.canvas.restore_region(background)
    ax.draw_artist(line)
    fig.canvas.blit(ax.bbox)
    plt.pause(0.01)

plt.show()
Output:
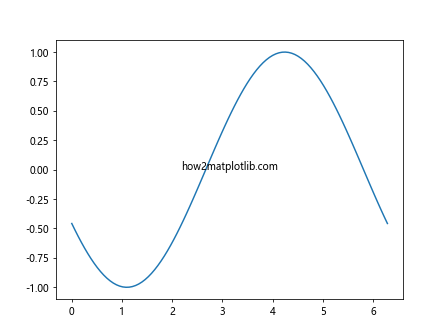
在这个例子中,我们创建了一个正弦波动画。我们将线条对象设置为动画状态,然后使用blitting技术来更新图形。这种方法可以显著提高动画的性能。
5. get_animated()在自定义Artist中的应用
当你创建自定义的Artist子类时,get_animated()方法也会被继承。你可以在自定义类中重写这个方法,以实现特殊的动画行为。
以下是一个自定义Artist的示例:
import matplotlib.pyplot as plt
from matplotlib.artist import Artist

class MyArtist(Artist):
    def __init__(self):
        super().__init__()
        self._animated = False

    def draw(self, renderer):
        # 自定义绘制逻辑
        pass

    def get_animated(self):
        return self._animated

    def set_animated(self, ani):
        self._animated = ani

fig, ax = plt.subplots()
my_artist = MyArtist()
ax.add_artist(my_artist)
ax.text(0.5, 0.5, 'how2matplotlib.com', ha='center', va='center')

print(f"MyArtist is animated: {my_artist.get_animated()}")
my_artist.set_animated(True)
print(f"After setting: MyArtist is animated: {my_artist.get_animated()}")

plt.show()
Output:
在这个例子中,我们创建了一个名为MyArtist的自定义Artist类,并实现了get_animated()和set_animated()方法。这允许我们完全控制对象的动画状态。
6. 动画状态与性能优化
正确使用动画状态可以显著提高Matplotlib动画的性能。当创建复杂的动画时,只将需要频繁更新的元素设置为动画状态,可以减少不必要的重绘,从而提高效率。
以下是一个展示性能优化的示例:
import matplotlib.pyplot as plt
import numpy as np

fig, ax = plt.subplots()
x = np.linspace(0, 2*np.pi, 100)
line, = ax.plot(x, np.sin(x))
static_text = ax.text(np.pi, 1.2, 'Static Text: how2matplotlib.com', ha='center')
dynamic_text = ax.text(np.pi, -1.2, 'Dynamic Text', ha='center')

line.set_animated(True)
dynamic_text.set_animated(True)
fig.canvas.draw()
background = fig.canvas.copy_from_bbox(ax.bbox)

for i in range(100):
    line.set_ydata(np.sin(x + i/10.0))
    dynamic_text.set_text(f'Frame {i}: how2matplotlib.com')

    fig.canvas.restore_region(background)
    ax.draw_artist(line)
    ax.draw_artist(dynamic_text)
    fig.canvas.blit(ax.bbox)
    plt.pause(0.01)

plt.show()
Output:
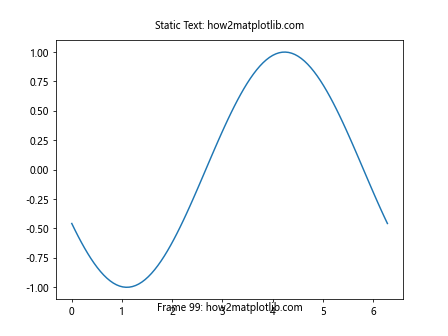
在这个例子中,我们创建了一个包含动态线条和文本的动画。通过将需要更新的元素设置为动画状态,我们可以使用blitting技术来优化性能。
7. 动画状态与事件处理
动画状态还可以影响Matplotlib中的事件处理。当一个Artist对象被设置为动画状态时,某些事件(如鼠标点击)可能不会像预期那样触发。
以下是一个展示动画状态对事件处理影响的示例:
import matplotlib.pyplot as plt
from matplotlib.patches import Circle

def on_click(event):
    if circle.contains(event)[0]:
        print(f"Circle clicked at {event.xdata}, {event.ydata}")

fig, ax = plt.subplots()
circle = Circle((0.5, 0.5), 0.2, facecolor='r')
ax.add_patch(circle)
ax.text(0.5, 0.8, 'how2matplotlib.com', ha='center')

fig.canvas.mpl_connect('button_press_event', on_click)

print(f"Circle is animated: {circle.get_animated()}")
plt.show()

# 设置为动画状态后重新运行
circle.set_animated(True)
print(f"Circle is now animated: {circle.get_animated()}")
plt.show()
在这个例子中,我们创建了一个可点击的圆形。当圆形未设置为动画状态时,点击事件可以正常触发。但当设置为动画状态后,点击事件可能不会被捕获。
8. 动画状态与保存图形
当保存包含动画状态Artist的图形时,需要特别注意。默认情况下,保存的静态图像不会反映动画状态。
以下是一个展示如何正确保存动画图形的示例:
import matplotlib.pyplot as plt
from matplotlib.patches import Rectangle
import numpy as np

fig, ax = plt.subplots()
rect = Rectangle((0.1, 0.1), 0.8, 0.8, facecolor='b', animated=True)
ax.add_patch(rect)
ax.text(0.5, 0.5, 'how2matplotlib.com', ha='center', va='center')

# 绘制动画帧
for i in range(50):
    rect.set_xy((0.1 + i*0.01, 0.1 + i*0.01))
    fig.canvas.draw()
    fig.canvas.flush_events()
    plt.pause(0.1)

# 保存最终帧
plt.savefig('animated_rectangle.png')
print("Figure saved as 'animated_rectangle.png'")

plt.show()
Output:
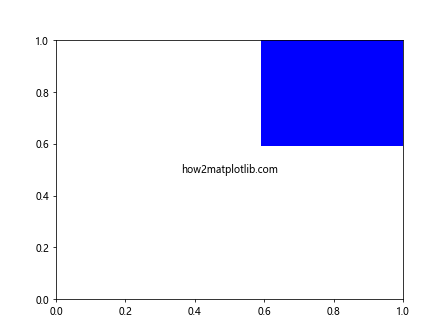
在这个例子中,我们创建了一个移动的矩形动画,并在动画结束时保存了最终帧。这确保了保存的图像反映了动画的最终状态。
9. 动画状态与图层管理
动画状态还可以影响Matplotlib中的图层管理。当使用多个图层时,动画状态可以帮助控制哪些图层需要频繁更新。
以下是一个使用多个图层和动画状态的示例:
import matplotlib.pyplot as plt
from matplotlib.patches import Circle, Rectangle

fig, ax = plt.subplots()

# 背景层
background = Rectangle((0, 0), 1, 1, facecolor='lightgray')
ax.add_patch(background)

# 中间层
middle_circle = Circle((0.5, 0.5), 0.3, facecolor='yellow')
ax.add_patch(middle_circle)

# 前景层
foreground_circle = Circle((0.5, 0.5), 0.1, facecolor='red')
ax.add_patch(foreground_circle)

ax.text(0.5, 0.9, 'how2matplotlib.com', ha='center')

# 设置前景层为动画状态
foreground_circle.set_animated(True)

print(f"Background animated: {background.get_animated()}")
print(f"Middle layer animated: {middle_circle.get_animated()}")
print(f"Foreground animated: {foreground_circle.get_animated()}")

plt.show()
Output:
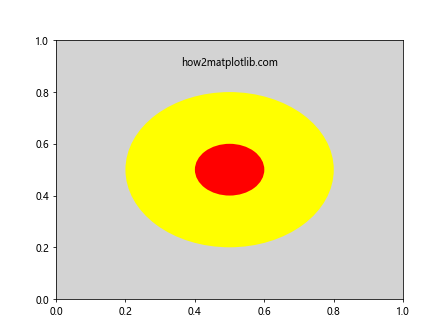
在这个例子中,我们创建了三个图层,并将前景层设置为动画状态。这样,在创建动画时,只有前景层需要频繁更新,从而提高性能。
10. 动画状态与交互式绘图
动画状态在交互式绘图中也扮演着重要角色。当使用Matplotlib的交互式功能时,正确设置动画状态可以提高响应速度和流畅度。
以下是一个交互式绘图的示例:
import matplotlib.pyplot as plt
from matplotlib.widgets import Slider

fig, ax = plt.subplots()
line, = ax.plot([0, 1], [0, 1], lw=2)
ax.text(0.5, 0.9, 'how2matplotlib.com', ha='center')

slider_ax = plt.axes([0.2, 0.02, 0.6, 0.03])
slider = Slider(slider_ax, 'Slope', 0, 2, valinit=1)

line.set_animated(True)
fig.canvas.draw()
background = fig.canvas.copy_from_bbox(ax.bbox)

def update(val):
    slope = slider.val
    line.set_ydata([0, slope])
    fig.canvas.restore_region(background)
    ax.draw_artist(line)
    fig.canvas.blit(ax.bbox)

slider.on_changed(update)

print(f"Line is animated: {line.get_animated()}")

plt.show()
Output:
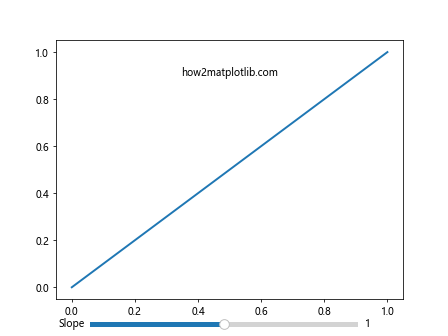
在这个例子中,我们创建了一个带有滑块的交互式图形。通过将线条设置为动画状态,我们可以使用blitting技术来优化更新过程,使交互更加流畅。
11. 动画状态与自定义绘图函数
当创建自定义绘图函数时,考虑动画状态可以帮助你优化绘图过程。你可以根据对象的动画状态来决定是否需要重新绘制某些元素。
以下是一个使用自定义绘图函数的示例:
import matplotlib.pyplot as plt
import numpy as np

class AnimatedScatter:
    def __init__(self, ax):
        self.ax = ax
        self.scatter = ax.scatter([], [], animated=True)
        self.text = ax.text(0.5, 0.9, 'how2matplotlib.com', ha='center', animated=True)

    def update(self, frame):
        x = np.random.rand(20)
        yy = np.random.rand(20)
        self.scatter.set_offsets(np.c_[x, y])
        self.text.set_text(f'Frame: {frame}')
        return self.scatter, self.text

    def init(self):
        self.scatter.set_offsets([])
        return self.scatter, self.text

fig, ax = plt.subplots()
animated_scatter = AnimatedScatter(ax)

ax.set_xlim(0, 1)
ax.set_ylim(0, 1)

def animate(frame):
    return animated_scatter.update(frame)

from matplotlib.animation import FuncAnimation
anim = FuncAnimation(fig, animate, init_func=animated_scatter.init,
                     frames=200, interval=50, blit=True)

print(f"Scatter is animated: {animated_scatter.scatter.get_animated()}")
print(f"Text is animated: {animated_scatter.text.get_animated()}")

plt.show()
在这个例子中,我们创建了一个自定义的AnimatedScatter类,它管理一个动画散点图和文本。通过将散点图和文本设置为动画状态,我们可以使用FuncAnimation来创建高效的动画。
12. 动画状态与多子图
当处理包含多个子图的复杂图形时,正确管理每个子图中Artist对象的动画状态变得尤为重要。这可以帮助你优化整体性能,特别是在创建复杂的动画时。
以下是一个包含多个子图的动画示例:
import matplotlib.pyplot as plt
import numpy as np

fig, (ax1, ax2) = plt.subplots(2, 1, figsize=(6, 8))

# 第一个子图:动画线条
x = np.linspace(0, 2*np.pi, 100)
line, = ax1.plot(x, np.sin(x))
ax1.set_title('Sine Wave')
ax1.text(np.pi, 0, 'how2matplotlib.com', ha='center')

# 第二个子图:动画散点图
scatter = ax2.scatter([], [])
ax2.set_xlim(0, 1)
ax2.set_ylim(0, 1)
ax2.set_title('Random Scatter')
ax2.text(0.5, 0.9, 'how2matplotlib.com', ha='center')

line.set_animated(True)
scatter.set_animated(True)

fig.canvas.draw()
backgrounds = [fig.canvas.copy_from_bbox(ax.bbox) for ax in (ax1, ax2)]

for i in range(100):
    # 更新第一个子图
    line.set_ydata(np.sin(x + i/10.0))

    # 更新第二个子图
    new_data = np.random.rand(20, 2)
    scatter.set_offsets(new_data)

    for ax, background in zip((ax1, ax2), backgrounds):
        fig.canvas.restore_region(background)
        ax.draw_artist(ax.get_children()[-1])  # 绘制最后添加的artist
        fig.canvas.blit(ax.bbox)

    plt.pause(0.1)

print(f"Line is animated: {line.get_animated()}")
print(f"Scatter is animated: {scatter.get_animated()}")

plt.show()
Output:
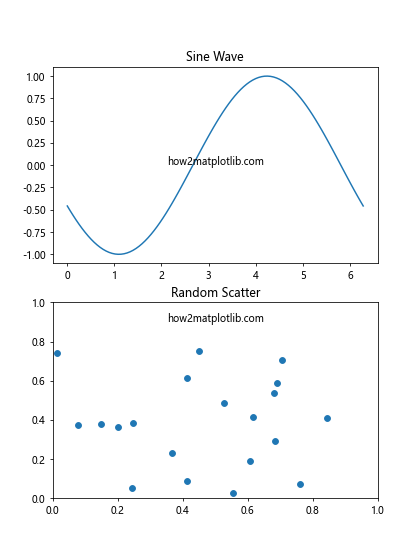
在这个例子中,我们创建了两个子图:一个显示动画正弦波,另一个显示动画散点图。通过将两个图中的主要元素设置为动画状态,我们可以使用blitting技术来优化每个子图的更新过程。
13. 动画状态与颜色映射
动画状态也可以与颜色映射(colormap)结合使用,创建动态变化的色彩效果。这在可视化随时间变化的数据时特别有用。
以下是一个结合动画状态和颜色映射的示例:
import matplotlib.pyplot as plt
import numpy as np
from matplotlib.colors import LinearSegmentedColormap

fig, ax = plt.subplots()

# 创建自定义颜色映射
colors = ['blue', 'green', 'yellow', 'red']
n_bins = 100
cmap = LinearSegmentedColormap.from_list('custom_cmap', colors, N=n_bins)

# 初始化图像
data = np.random.rand(10, 10)
im = ax.imshow(data, cmap=cmap, animated=True)
ax.text(5, -1, 'how2matplotlib.com', ha='center')

fig.colorbar(im)

fig.canvas.draw()
background = fig.canvas.copy_from_bbox(ax.bbox)

for i in range(50):
    # 更新数据
    data = np.random.rand(10, 10)
    im.set_array(data)

    # 使用blitting更新图像
    fig.canvas.restore_region(background)
    ax.draw_artist(im)
    fig.canvas.blit(ax.bbox)

    plt.pause(0.1)

print(f"Image is animated: {im.get_animated()}")

plt.show()
Output:
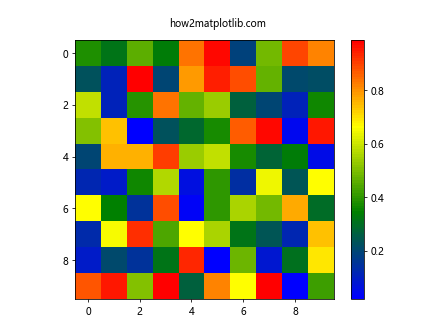
在这个例子中,我们创建了一个动画热图,使用自定义的颜色映射。通过将图像对象设置为动画状态,我们可以高效地更新颜色数据。
14. 动画状态与3D绘图
Matplotlib也支持3D绘图,而动画状态同样适用于3D图形中的Artist对象。这使得创建动态的3D可视化成为可能。
以下是一个3D动画的示例:
import matplotlib.pyplot as plt
import numpy as np
from mpl_toolkits.mplot3d import Axes3D

fig = plt.figure()
ax = fig.add_subplot(111, projection='3d')

# 生成数据
x = np.linspace(-5, 5, 100)
y = np.linspace(-5, 5, 100)
X, Y = np.meshgrid(x, y)

# 初始化曲面
Z = np.sin(np.sqrt(X**2 + Y**2))
surf = ax.plot_surface(X, Y, Z, cmap='viridis')

ax.set_zlim(-1, 1)
ax.text2D(0.5, 0.95, 'how2matplotlib.com', transform=ax.transAxes, ha='center')

surf.set_animated(True)

fig.canvas.draw()
background = fig.canvas.copy_from_bbox(ax.bbox)

for i in range(50):
    # 更新Z数据
    Z = np.sin(np.sqrt(X**2 + Y**2) + i/10.0)

    # 移除旧的曲面
    ax.collections.clear()

    # 绘制新的曲面
    surf = ax.plot_surface(X, Y, Z, cmap='viridis', animated=True)

    # 使用blitting更新图像
    fig.canvas.restore_region(background)
    ax.draw_artist(surf)
    fig.canvas.blit(ax.bbox)

    plt.pause(0.1)

print(f"Surface is animated: {surf.get_animated()}")

plt.show()
在这个例子中,我们创建了一个动画3D曲面图。通过将曲面对象设置为动画状态,我们可以高效地更新3D数据。
15. 动画状态与实时数据可视化
动画状态在实时数据可视化中特别有用,因为它允许我们高效地更新图形以反映不断变化的数据。
以下是一个模拟实时数据可视化的示例:
import matplotlib.pyplot as plt
import numpy as np
from collections import deque

fig, ax = plt.subplots()

max_points = 100
data = deque(maxlen=max_points)
line, = ax.plot(np.arange(max_points), np.ones(max_points, dtype=np.float)*np.nan)

ax.set_ylim(0, 1)
ax.set_xlim(0, max_points)
ax.text(max_points/2, 0.9, 'how2matplotlib.com', ha='center')

line.set_animated(True)
fig.canvas.draw()
background = fig.canvas.copy_from_bbox(ax.bbox)

def update_line(frame):
    data.append(np.random.random())
    line.set_ydata(list(data))
    fig.canvas.restore_region(background)
    ax.draw_artist(line)
    fig.canvas.blit(ax.bbox)

for i in range(200):
    update_line(i)
    plt.pause(0.05)

print(f"Line is animated: {line.get_animated()}")

plt.show()
在这个例子中,我们模拟了一个实时数据流,并使用动画线条来可视化最近的数据点。通过将线条设置为动画状态,我们可以高效地更新图形以反映新的数据。
结论
Matplotlib的Artist.get_animated()方法是控制图形元素动画效果的重要工具。通过正确使用动画状态,我们可以显著提高动画的性能,特别是在处理复杂的可视化或实时数据时。本文详细介绍了get_animated()方法的使用,以及它在各种场景下的应用,包括基本动画、性能优化、事件处理、图层管理、交互式绘图、3D可视化和实时数据可视化等。掌握这些技巧将帮助你创建更高效、更流畅的Matplotlib动画。
 极客笔记
极客笔记