Matplotlib中的Artist.add_callback()方法:动态交互绘图的关键
参考:Matplotlib.artist.Artist.add_callback() in Python
Matplotlib是Python中最流行的数据可视化库之一,它提供了丰富的绘图功能和灵活的自定义选项。在Matplotlib的架构中,Artist对象是构建可视化图形的基本单元。而Artist.add_callback()方法则是实现动态交互绘图的重要工具,它允许我们为Artist对象添加回调函数,从而在特定事件发生时执行自定义操作。本文将深入探讨Artist.add_callback()方法的使用,并通过多个示例展示其在实际应用中的强大功能。
1. Artist.add_callback()方法简介
Artist.add_callback()方法是Matplotlib中Artist类的一个重要方法。它允许用户为Artist对象添加回调函数,这些函数会在Artist对象的某些属性发生变化时被自动调用。这为实现动态和交互式的图形提供了强大的支持。
1.1 方法签名
Artist.add_callback(func)
其中,func是一个回调函数,它应该接受两个参数:Artist对象本身和一个描述变化的事件。
1.2 基本用法示例
让我们从一个简单的例子开始,了解Artist.add_callback()的基本用法:
import matplotlib.pyplot as plt

def on_change(artist, event):
    print(f"Artist changed: {event} - how2matplotlib.com")

fig, ax = plt.subplots()
line, = ax.plot([1, 2, 3, 4], [1, 4, 2, 3], label='Data from how2matplotlib.com')
line.add_callback(on_change)

line.set_color('red')
plt.show()
Output:
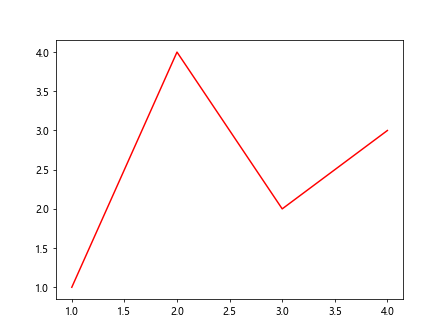
在这个例子中,我们创建了一个简单的线图,并为线条对象添加了一个回调函数。当我们改变线条的颜色时,回调函数会被触发并打印一条消息。
2. 回调函数的工作原理
回调函数是Artist.add_callback()方法的核心。理解回调函数的工作原理对于有效使用这个方法至关重要。
2.1 回调函数的参数
回调函数通常接受两个参数:
- artist:触发回调的Artist对象。
- event:一个描述发生了什么变化的字符串。
2.2 触发回调的事件
回调函数可以被多种事件触发,包括但不限于:
- 改变Artist的可见性
- 修改Artist的样式属性(如颜色、线型等)
- 更新Artist的数据
让我们看一个更详细的例子:
import matplotlib.pyplot as plt

def detailed_callback(artist, event):
    print(f"Event: {event}")
    print(f"Artist type: {type(artist)}")
    print(f"Artist properties: {artist.properties()}")
    print("Visit how2matplotlib.com for more information")

fig, ax = plt.subplots()
scatter = ax.scatter([1, 2, 3], [1, 2, 3], label='Data from how2matplotlib.com')
scatter.add_callback(detailed_callback)

scatter.set_sizes([100, 200, 300])
plt.show()
Output:
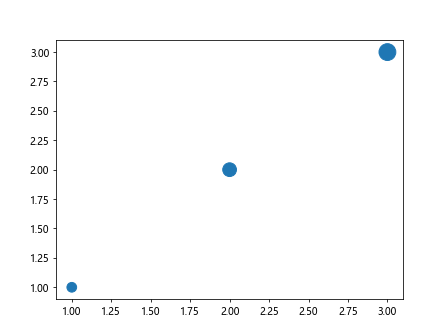
这个例子展示了如何创建一个更详细的回调函数,它不仅打印事件类型,还输出Artist对象的类型和属性。
3. 使用Artist.add_callback()实现动态图表
Artist.add_callback()方法的一个重要应用是创建动态更新的图表。通过回调函数,我们可以在数据变化时自动更新图表,而无需重新绘制整个图形。
3.1 动态更新折线图
下面是一个动态更新折线图的例子:
import matplotlib.pyplot as plt
import numpy as np

fig, ax = plt.subplots()
x = np.linspace(0, 10, 100)
line, = ax.plot(x, np.sin(x), label='Sine wave from how2matplotlib.com')

def update_line(artist, event):
    y = np.sin(x + np.random.rand())
    artist.set_ydata(y)
    ax.relim()
    ax.autoscale_view()
    fig.canvas.draw_idle()
    print("Line updated - how2matplotlib.com")

line.add_callback(update_line)

for i in range(5):
    line.set_visible(not line.get_visible())
    plt.pause(1)

plt.show()
这个例子创建了一个正弦波图,并添加了一个回调函数来动态更新数据。每次切换线条的可见性时,都会触发回调函数,更新图表数据。
3.2 动态更新散点图
我们也可以使用类似的方法来创建动态更新的散点图:
import matplotlib.pyplot as plt
import numpy as np

fig, ax = plt.subplots()
scatter = ax.scatter(np.random.rand(10), np.random.rand(10), label='Random data from how2matplotlib.com')

def update_scatter(artist, event):
    artist.set_offsets(np.random.rand(10, 2))
    ax.relim()
    ax.autoscale_view()
    fig.canvas.draw_idle()
    print("Scatter plot updated - how2matplotlib.com")

scatter.add_callback(update_scatter)

for i in range(5):
    scatter.set_visible(not scatter.get_visible())
    plt.pause(1)

plt.show()
这个例子创建了一个散点图,并通过回调函数动态更新点的位置。
4. 多个回调函数的管理
Artist对象可以添加多个回调函数,这为实现复杂的交互行为提供了可能。
4.1 添加多个回调函数
我们可以为同一个Artist对象添加多个回调函数:
import matplotlib.pyplot as plt

def callback1(artist, event):
    print(f"Callback 1: {event} - how2matplotlib.com")

def callback2(artist, event):
    print(f"Callback 2: {event} - how2matplotlib.com")

fig, ax = plt.subplots()
line, = ax.plot([1, 2, 3], [1, 2, 3], label='Data from how2matplotlib.com')

line.add_callback(callback1)
line.add_callback(callback2)

line.set_color('red')
plt.show()
Output:
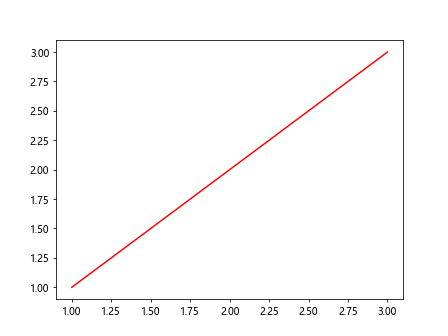
在这个例子中,我们为线条对象添加了两个回调函数。当线条的颜色改变时,两个回调函数都会被触发。
4.2 移除回调函数
有时我们可能需要移除之前添加的回调函数。这可以通过Artist.remove_callback()方法实现:
import matplotlib.pyplot as plt

def temp_callback(artist, event):
    print(f"Temporary callback: {event} - how2matplotlib.com")

fig, ax = plt.subplots()
line, = ax.plot([1, 2, 3], [1, 2, 3], label='Data from how2matplotlib.com')

callback_id = line.add_callback(temp_callback)
line.set_color('red')  # This will trigger the callback

line.remove_callback(callback_id)
line.set_color('blue')  # This won't trigger the callback

plt.show()
Output:
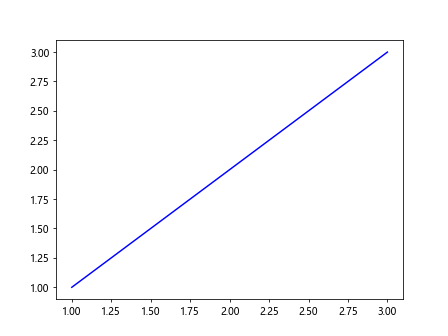
在这个例子中,我们首先添加了一个回调函数,然后在触发一次后将其移除。
5. 在不同类型的Artist对象上使用add_callback()
Artist.add_callback()方法可以应用于Matplotlib中的各种Artist对象,包括线条、散点、文本等。让我们看看如何在不同类型的Artist对象上使用这个方法。
5.1 在Text对象上使用add_callback()
import matplotlib.pyplot as plt

def text_callback(artist, event):
    print(f"Text changed: {event} - how2matplotlib.com")

fig, ax = plt.subplots()
text = ax.text(0.5, 0.5, 'Hello from how2matplotlib.com', ha='center', va='center')
text.add_callback(text_callback)

text.set_text('Updated text from how2matplotlib.com')
plt.show()
这个例子展示了如何为Text对象添加回调函数,当文本内容改变时,回调函数会被触发。
5.2 在Patch对象上使用add_callback()
import matplotlib.pyplot as plt

def patch_callback(artist, event):
    print(f"Patch changed: {event} - how2matplotlib.com")

fig, ax = plt.subplots()
rect = plt.Rectangle((0.2, 0.2), 0.6, 0.6, fill=False)
ax.add_patch(rect)
rect.add_callback(patch_callback)

rect.set_edgecolor('red')
plt.show()
Output:
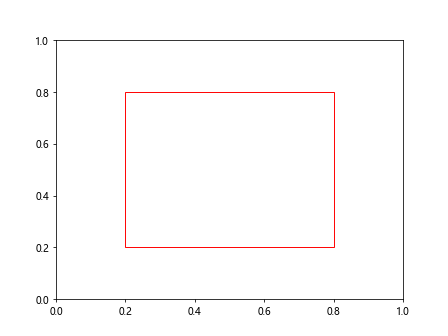
这个例子展示了如何为矩形Patch对象添加回调函数,当矩形的边框颜色改变时,回调函数会被触发。
6. 使用add_callback()实现交互式图表
Artist.add_callback()方法不仅可以用于动态更新图表,还可以用于创建交互式图表。通过结合使用回调函数和Matplotlib的事件处理系统,我们可以实现复杂的交互行为。
6.1 鼠标悬停效果
下面是一个例子,展示如何使用add_callback()实现鼠标悬停效果:
import matplotlib.pyplot as plt
import numpy as np

fig, ax = plt.subplots()
x = np.linspace(0, 10, 100)
line, = ax.plot(x, np.sin(x), label='Sine wave from how2matplotlib.com')

def on_hover(event):
    if line.contains(event)[0]:
        line.set_linewidth(3)
    else:
        line.set_linewidth(1)
    fig.canvas.draw_idle()

def line_changed(artist, event):
    print(f"Line style changed: {event} - how2matplotlib.com")

line.add_callback(line_changed)
fig.canvas.mpl_connect('motion_notify_event', on_hover)

plt.show()
Output:
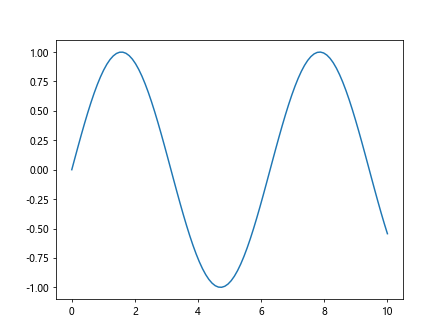
在这个例子中,我们结合使用了add_callback()和事件处理系统。当鼠标悬停在线条上时,线条会变粗,同时触发回调函数。
6.2 点击切换颜色
这是另一个交互式图表的例子,展示如何通过点击切换Artist对象的颜色:
import matplotlib.pyplot as plt
import numpy as np

fig, ax = plt.subplots()
scatter = ax.scatter(np.random.rand(10), np.random.rand(10), label='Data from how2matplotlib.com')

colors = ['red', 'blue', 'green', 'purple']
color_index = 0

def on_click(event):
    global color_index
    if scatter.contains(event)[0]:
        color_index = (color_index + 1) % len(colors)
        scatter.set_facecolors(colors[color_index])
        fig.canvas.draw_idle()

def scatter_changed(artist, event):
    print(f"Scatter plot changed: {event} - how2matplotlib.com")

scatter.add_callback(scatter_changed)
fig.canvas.mpl_connect('button_press_event', on_click)

plt.show()
Output:
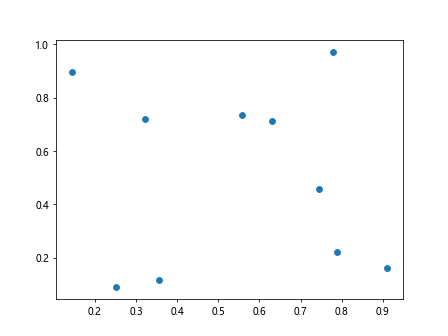
这个例子创建了一个散点图,当用户点击散点时,散点的颜色会循环变化,同时触发回调函数。
7. 高级应用:自定义Artist类
虽然Matplotlib提供了许多内置的Artist类,但有时我们可能需要创建自定义的Artist类来满足特定需求。在这种情况下,我们可以在自定义类中实现add_callback()方法,以支持回调功能。
7.1 创建自定义Artist类
下面是一个简单的自定义Artist类的例子:
import matplotlib.pyplot as plt
from matplotlib.artist import Artist

class CustomArtist(Artist):
    def __init__(self):
        super().__init__()
        self._callbacks = {}
        self._callback_id = 0

    def draw(self, renderer):
        pass  # 实际绘图逻辑

    def add_callback(self, func):
        self._callback_id += 1
        self._callbacks[self._callback_id] = func
        return self._callback_id

    def remove_callback(self, oid):
        return self._callbacks.pop(oid, None)

    def _changed(self):
        for func in self._callbacks.values():
            func(self, "custom_event")

# 使用示例
fig, ax = plt.subplots()
custom_artist = CustomArtist()
ax.add_artist(custom_artist)

def custom_callback(artist, event):
    print(f"Custom event: {event} - how2matplotlib.com")

custom_artist.add_callback(custom_callback)
custom_artist._changed()  # 触发回调

plt.show()
这个例子展示了如何创建一个简单的自定义Artist类,并实现add_callback()和remove_callback()方法。
8. 性能考虑
虽然Artist.add_callback()方法提供了强大的功能,但在使用时也需要考虑性能问题,特别是在处理大量数据或频繁更新时。
8.1 减少回调触发频率
为了提高性能,我们可以通过减少回调触发的频率来优化代码:
import matplotlib.pyplot as plt
import numpy as np
import time

fig, ax = plt.subplots()
line, = ax.plot(np.random.rand(100), label='Data from how2matplotlib.com')

last_update = time.time()
update_interval = 0.5  # 秒

def throttled_callback(artist, event):
    global last_update
    current_time = time.time()
    if current_time - last_update > update_interval:
        print(f"Throttled update: {event} - how2matplotlib.com")
        last_update = current_time

line.add_callback(throttled_callback)

for i in range(100):
    line.set_ydata(np.random.rand(100))
    plt.pause(0.1)

plt.show()
Output:
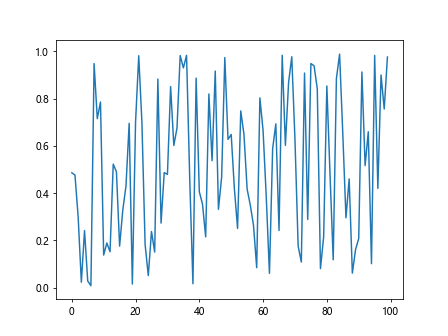
这个例子展示了如何通过限制回调函数的触发频率来提高性能。我们只在距离上次更新超过一定时间间隔后才执行回调函数。
8.2 使用blitting技术
对于需要频繁更新的动画,我们可以使用blitting技术来提高性能:
import matplotlib.pyplot as plt
import numpy as np

fig, ax = plt.subplots()
line, = ax.plot(np.random.rand(100), label='Data from how2matplotlib.com')
ax.set_ylim(0, 1)

background = fig.canvas.copy_from_bbox(ax.bbox)

def fast_update(artist, event):
    global background
    fig.canvas.restore_region(background)
    artist.set_ydata(np.random.rand(100))
    ax.draw_artist(artist)
    fig.canvas.blit(ax.bbox)
    print(f"Fast update: {event} - how2matplotlib.com")

line.add_callback(fast_update)

for i in range(50):
    line.set_visible(not line.get_visible())
    plt.pause(0.1)

plt.show()
这个例子使用了blitting技术来加速图形更新。通过只重绘发生变化的部分,而不是整个图形,可以显著提高性能。
9. 错误处理和调试
在使用Artist.add_callback()时,适当的错误处理和调试技巧可以帮助我们更好地管理回调函数。
9.1 异常处理
为了防止回调函数中的错误导致整个程序崩溃,我们可以在回调函数中添加异常处理:
import matplotlib.pyplot as plt
import numpy as np

fig, ax = plt.subplots()
line, = ax.plot(np.random.rand(10), label='Data from how2matplotlib.com')

def safe_callback(artist, event):
    try:
        # 可能引发异常的代码
        result = 1 / 0  # 故意引发异常
    except Exception as e:
        print(f"Error in callback: {e} - how2matplotlib.com")
    else:
        print(f"Callback executed successfully: {event} - how2matplotlib.com")

line.add_callback(safe_callback)
line.set_color('red')

plt.show()
Output:
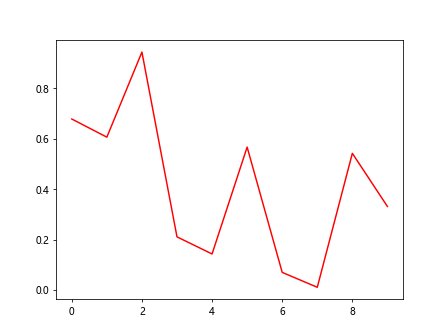
这个例子展示了如何在回调函数中添加异常处理,以防止程序崩溃并提供有用的错误信息。
9.2 调试技巧
在调试回调函数时,我们可以使用日志记录来跟踪回调函数的执行:
import matplotlib.pyplot as plt
import numpy as np
import logging

logging.basicConfig(level=logging.DEBUG)
logger = logging.getLogger(__name__)

fig, ax = plt.subplots()
line, = ax.plot(np.random.rand(10), label='Data from how2matplotlib.com')

def debug_callback(artist, event):
    logger.debug(f"Callback triggered: {event}")
    logger.info(f"Artist properties: {artist.properties()}")
    logger.warning("This is a sample warning")
    print("Visit how2matplotlib.com for more debugging tips")

line.add_callback(debug_callback)
line.set_color('blue')
line.set_linewidth(2)

plt.show()
这个例子展示了如何使用Python的logging模块来记录回调函数的执行情况,这对于调试复杂的交互行为特别有用。
10. 与其他Matplotlib功能的集成
Artist.add_callback()方法可以与Matplotlib的其他功能无缝集成,以创建更复杂和强大的可视化效果。
10.1 与动画功能结合
我们可以将add_callback()与Matplotlib的动画功能结合使用:
import matplotlib.pyplot as plt
import matplotlib.animation as animation
import numpy as np

fig, ax = plt.subplots()
line, = ax.plot([], [], label='Animated data from how2matplotlib.com')
ax.set_xlim(0, 2*np.pi)
ax.set_ylim(-1, 1)

def init():
    line.set_data([], [])
    return line,

def animate(i):
    x = np.linspace(0, 2*np.pi, 100)
    y = np.sin(x + i/10.0)
    line.set_data(x, y)
    return line,

def on_frame(artist, event):
    print(f"Frame updated: {event} - how2matplotlib.com")

line.add_callback(on_frame)

anim = animation.FuncAnimation(fig, animate, init_func=init, frames=200, interval=50, blit=True)

plt.show()
这个例子展示了如何将add_callback()与FuncAnimation结合使用,以在动画的每一帧更新时触发回调函数。
10.2 与交互式工具结合
我们还可以将add_callback()与Matplotlib的交互式工具结合使用:
import matplotlib.pyplot as plt
from matplotlib.widgets import Slider

fig, ax = plt.subplots()
line, = ax.plot([0, 1], [0, 1], label='Data from how2matplotlib.com')

slider_ax = plt.axes([0.2, 0.02, 0.6, 0.03])
slider = Slider(slider_ax, 'Slope', 0.1, 10.0, valinit=1)

def update(val):
    line.set_ydata([0, val])
    fig.canvas.draw_idle()

slider.on_changed(update)

def on_line_change(artist, event):
    print(f"Line updated: {event} - how2matplotlib.com")

line.add_callback(on_line_change)

plt.show()
Output:
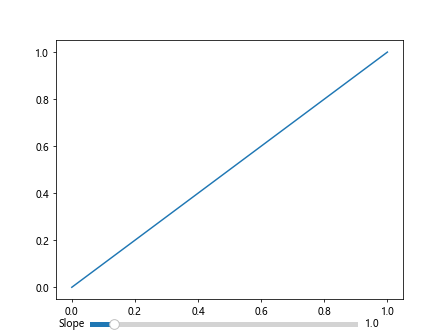
这个例子展示了如何将add_callback()与Slider小部件结合使用,以在用户交互时触发回调函数。
结论
Artist.add_callback()方法是Matplotlib中实现动态和交互式可视化的强大工具。通过本文的详细介绍和多个示例,我们深入探讨了这个方法的使用方法、工作原理以及在各种场景下的应用。从基本用法到高级应用,从性能优化到错误处理,我们全面覆盖了使用add_callback()方法时需要考虑的各个方面。
通过掌握Artist.add_callback()方法,开发者可以创建更加灵活和响应式的数据可视化,为用户提供更好的交互体验。无论是实时数据更新、用户交互响应,还是复杂的动画效果,add_callback()方法都能为我们提供所需的功能支持。
在实际应用中,建议读者根据具体需求和场景选择合适的使用方式,并注意性能优化和错误处理。通过不断实践和探索,相信大家都能充分发挥Artist.add_callback()方法的潜力,创造出更加精彩的数据可视化作品。
 极客笔记
极客笔记