Matplotlib中如何创建跨越多行多列的子图布局
参考:Make subplots span multiple grid rows and columns in Matplotlib
Matplotlib是Python中强大的数据可视化库,它提供了灵活的方式来创建复杂的图表布局。在本文中,我们将深入探讨如何在Matplotlib中创建跨越多行多列的子图布局。这种技术对于创建复杂的数据展示非常有用,可以让你在一个图形窗口中展示多个相关但又独立的图表,同时保持整体布局的美观和逻辑性。
1. 基础知识:理解Matplotlib的子图概念
在开始创建跨越多行多列的子图之前,我们需要先理解Matplotlib中的子图概念。子图是指在一个图形窗口中的独立绘图区域。通过使用子图,我们可以在同一个窗口中绘制多个图表。
以下是一个简单的创建子图的例子:
import matplotlib.pyplot as plt

fig, (ax1, ax2) = plt.subplots(1, 2, figsize=(10, 4))

ax1.plot([1, 2, 3, 4], [1, 4, 2, 3])
ax1.set_title('Plot 1 - how2matplotlib.com')

ax2.plot([1, 2, 3, 4], [1, 2, 4, 3])
ax2.set_title('Plot 2 - how2matplotlib.com')

plt.tight_layout()
plt.show()
Output:
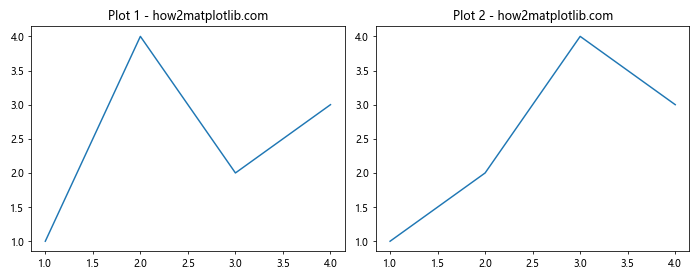
在这个例子中,我们创建了一个包含两个并排的子图的图形。plt.subplots(1, 2)创建了一行两列的子图布局。
2. 使用GridSpec创建复杂布局
要创建跨越多行多列的子图,我们需要使用Matplotlib的GridSpec功能。GridSpec允许我们更灵活地定义子图的位置和大小。
以下是一个使用GridSpec创建跨越多行多列子图的基本例子:
import matplotlib.pyplot as plt
import matplotlib.gridspec as gridspec

fig = plt.figure(figsize=(12, 8))
gs = gridspec.GridSpec(3, 3)

ax1 = fig.add_subplot(gs[0, :])
ax2 = fig.add_subplot(gs[1, :-1])
ax3 = fig.add_subplot(gs[1:, -1])
ax4 = fig.add_subplot(gs[-1, 0])
ax5 = fig.add_subplot(gs[-1, -2])

ax1.set_title('Span all columns - how2matplotlib.com')
ax2.set_title('Span 2 columns - how2matplotlib.com')
ax3.set_title('Span 2 rows - how2matplotlib.com')
ax4.set_title('Single cell 1 - how2matplotlib.com')
ax5.set_title('Single cell 2 - how2matplotlib.com')

plt.tight_layout()
plt.show()
Output:
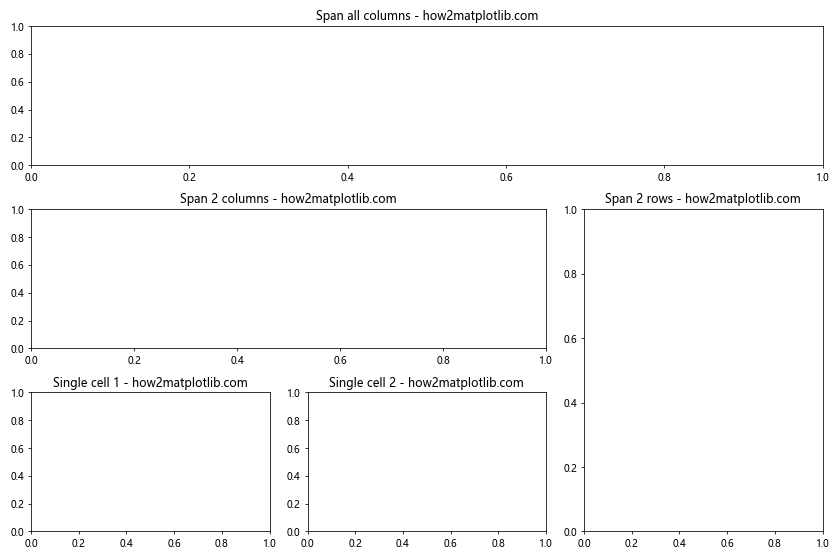
在这个例子中,我们创建了一个3×3的网格,然后定义了5个子图,其中一些跨越了多个网格单元。
3. 使用add_gridspec方法
从Matplotlib 3.1版本开始,我们可以使用figure.add_gridspec()方法来创建GridSpec对象。这提供了一种更简洁的语法来创建复杂的子图布局。
import matplotlib.pyplot as plt

fig = plt.figure(figsize=(12, 8))
gs = fig.add_gridspec(3, 3)

ax1 = fig.add_subplot(gs[0, :])
ax2 = fig.add_subplot(gs[1, :-1])
ax3 = fig.add_subplot(gs[1:, -1])
ax4 = fig.add_subplot(gs[-1, 0])
ax5 = fig.add_subplot(gs[-1, -2])

ax1.set_title('Span all columns - how2matplotlib.com')
ax2.set_title('Span 2 columns - how2matplotlib.com')
ax3.set_title('Span 2 rows - how2matplotlib.com')
ax4.set_title('Single cell 1 - how2matplotlib.com')
ax5.set_title('Single cell 2 - how2matplotlib.com')

plt.tight_layout()
plt.show()
Output:
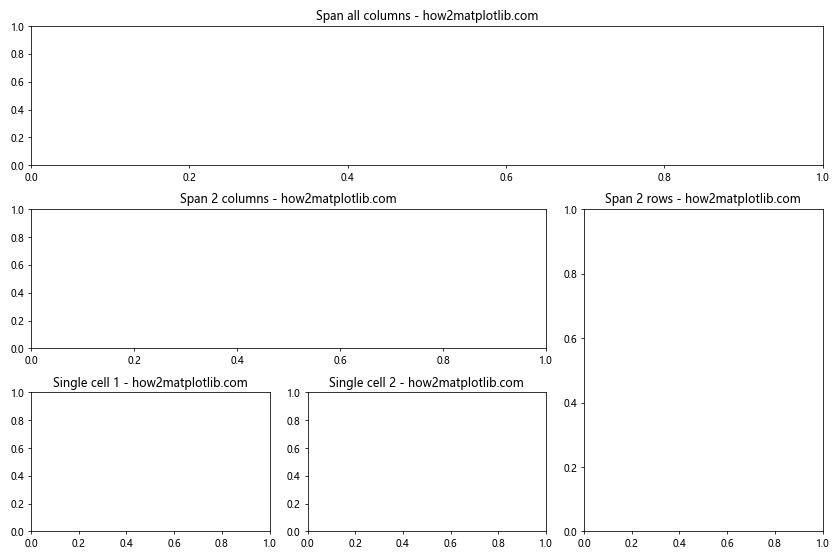
这个例子的结果与前一个例子相同,但语法更加简洁。
4. 调整子图之间的间距
在创建跨越多行多列的子图时,调整子图之间的间距对于优化布局非常重要。我们可以使用gridspec_kw参数来调整这些间距。
import matplotlib.pyplot as plt

fig, axs = plt.subplots(3, 3, figsize=(12, 8),
                        gridspec_kw={'hspace': 0.4, 'wspace': 0.3})

axs[0, 0].set_title('Row 0, Col 0 - how2matplotlib.com')
axs[0, 1].set_title('Row 0, Col 1 - how2matplotlib.com')
axs[0, 2].set_title('Row 0, Col 2 - how2matplotlib.com')
axs[1, 0].set_title('Row 1, Col 0 - how2matplotlib.com')
axs[1, 1].set_title('Row 1, Col 1 - how2matplotlib.com')
axs[1, 2].set_title('Row 1, Col 2 - how2matplotlib.com')
axs[2, 0].set_title('Row 2, Col 0 - how2matplotlib.com')
axs[2, 1].set_title('Row 2, Col 1 - how2matplotlib.com')
axs[2, 2].set_title('Row 2, Col 2 - how2matplotlib.com')

plt.tight_layout()
plt.show()
Output:
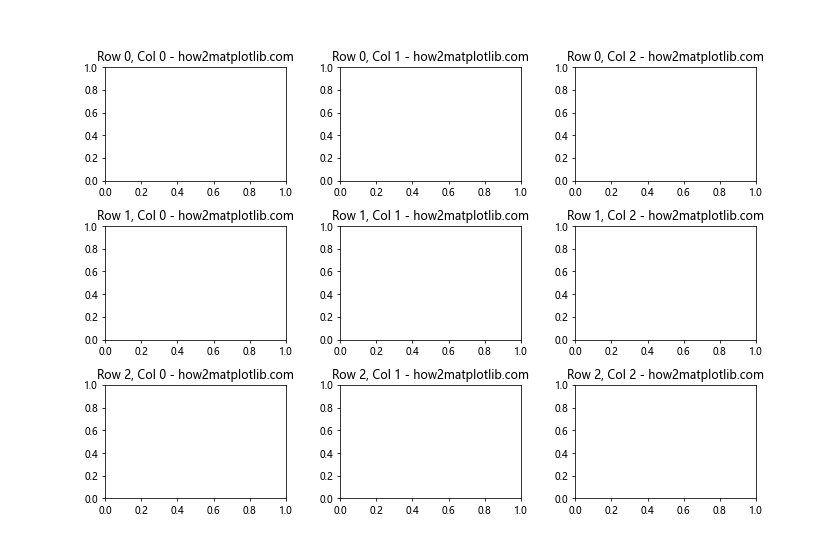
在这个例子中,hspace控制子图之间的垂直间距,wspace控制水平间距。
5. 创建不规则的网格布局
有时,我们可能需要创建不规则的网格布局,其中某些子图占据的空间比其他子图大。我们可以使用width_ratios和height_ratios参数来实现这一点。
import matplotlib.pyplot as plt
import matplotlib.gridspec as gridspec

fig = plt.figure(figsize=(12, 8))
gs = gridspec.GridSpec(2, 3, width_ratios=[1, 2, 1], height_ratios=[2, 1])

ax1 = fig.add_subplot(gs[0, :2])
ax2 = fig.add_subplot(gs[0, 2])
ax3 = fig.add_subplot(gs[1, :])

ax1.set_title('Span 2 columns (wide) - how2matplotlib.com')
ax2.set_title('Single column - how2matplotlib.com')
ax3.set_title('Span all columns (short) - how2matplotlib.com')

plt.tight_layout()
plt.show()
Output:
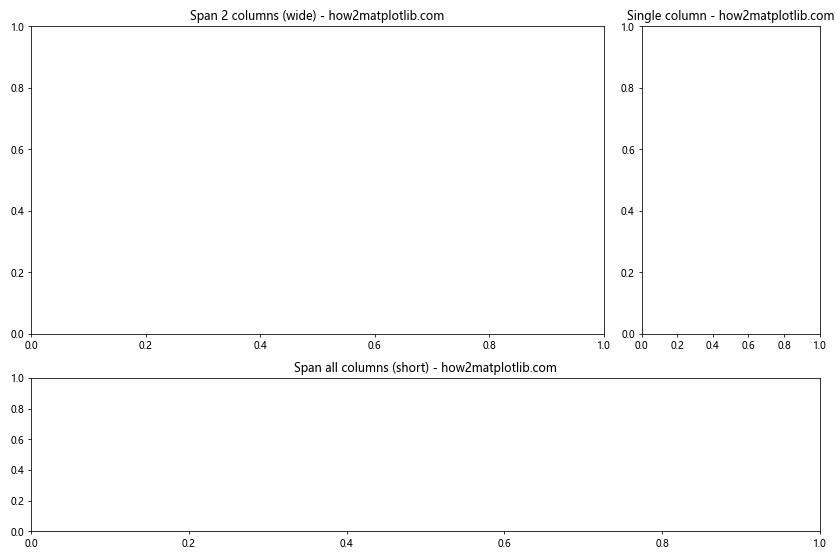
在这个例子中,我们创建了一个2×3的网格,但第二列的宽度是第一列和第三列的两倍,而第一行的高度是第二行的两倍。
6. 嵌套的GridSpec
对于更复杂的布局,我们可以使用嵌套的GridSpec。这允许我们在一个子图区域内创建另一个网格布局。
import matplotlib.pyplot as plt
import matplotlib.gridspec as gridspec

fig = plt.figure(figsize=(12, 8))
gs0 = gridspec.GridSpec(1, 2, figure=fig)

gs00 = gridspec.GridSpecFromSubplotSpec(2, 2, subplot_spec=gs0[0])
gs01 = gridspec.GridSpecFromSubplotSpec(3, 1, subplot_spec=gs0[1])

ax1 = fig.add_subplot(gs00[0, 0])
ax2 = fig.add_subplot(gs00[0, 1])
ax3 = fig.add_subplot(gs00[1, :])

ax4 = fig.add_subplot(gs01[0])
ax5 = fig.add_subplot(gs01[1])
ax6 = fig.add_subplot(gs01[2])

ax1.set_title('Nested 1 - how2matplotlib.com')
ax2.set_title('Nested 2 - how2matplotlib.com')
ax3.set_title('Nested 3 - how2matplotlib.com')
ax4.set_title('Right 1 - how2matplotlib.com')
ax5.set_title('Right 2 - how2matplotlib.com')
ax6.set_title('Right 3 - how2matplotlib.com')

plt.tight_layout()
plt.show()
Output:
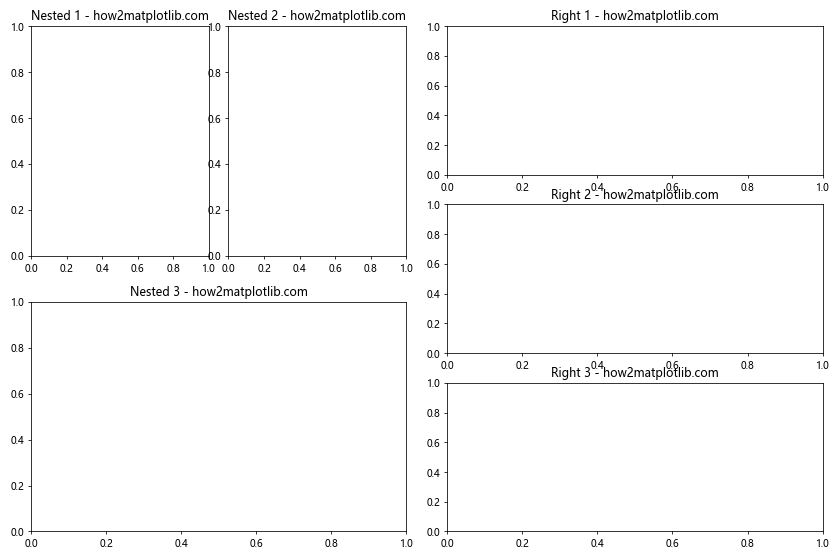
这个例子创建了一个复杂的布局,左侧是一个2×2的网格,右侧是一个3×1的网格。
7. 使用subplot2grid创建跨越多行多列的子图
subplot2grid函数提供了另一种创建跨越多行多列子图的方法。这个函数允许我们指定子图的起始位置和跨度。
import matplotlib.pyplot as plt

fig = plt.figure(figsize=(12, 8))

ax1 = plt.subplot2grid((3, 3), (0, 0), colspan=3)
ax2 = plt.subplot2grid((3, 3), (1, 0), colspan=2)
ax3 = plt.subplot2grid((3, 3), (1, 2), rowspan=2)
ax4 = plt.subplot2grid((3, 3), (2, 0))
ax5 = plt.subplot2grid((3, 3), (2, 1))

ax1.set_title('Span all columns - how2matplotlib.com')
ax2.set_title('Span 2 columns - how2matplotlib.com')
ax3.set_title('Span 2 rows - how2matplotlib.com')
ax4.set_title('Single cell 1 - how2matplotlib.com')
ax5.set_title('Single cell 2 - how2matplotlib.com')

plt.tight_layout()
plt.show()
Output:
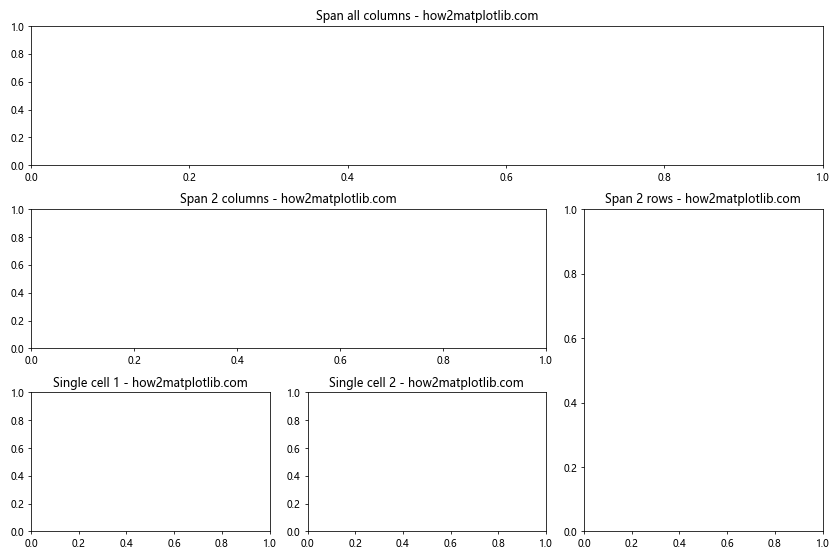
在这个例子中,我们使用subplot2grid创建了与之前GridSpec例子相同的布局。
8. 动态调整子图大小
有时,我们可能需要根据数据或其他条件动态调整子图的大小。我们可以使用gridspec_kw参数和一个字典来实现这一点。
import matplotlib.pyplot as plt
import numpy as np

data = np.random.rand(3, 4)
sizes = np.array([sum(row) for row in data])
total = sum(sizes)
height_ratios = sizes / total

fig, axs = plt.subplots(3, 1, figsize=(8, 12),
                        gridspec_kw={'height_ratios': height_ratios})

for i, (ax, size) in enumerate(zip(axs, sizes)):
    ax.bar(range(4), data[i])
    ax.set_title(f'Subplot {i+1}, Size: {size:.2f} - how2matplotlib.com')

plt.tight_layout()
plt.show()
Output:
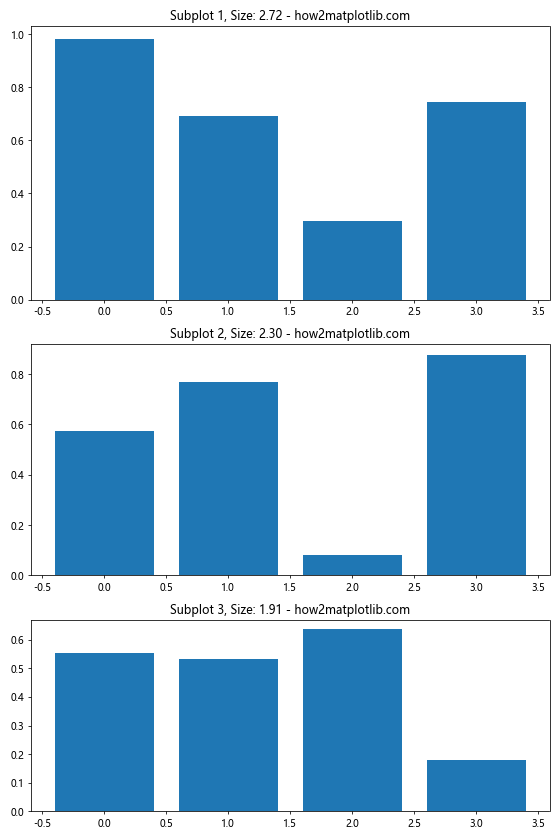
在这个例子中,我们根据每行数据的总和动态调整了每个子图的高度。
9. 创建具有共享轴的跨越子图
当创建跨越多行多列的子图时,我们可能希望某些子图共享相同的x轴或y轴。这可以通过sharex和sharey参数来实现。
import matplotlib.pyplot as plt
import numpy as np

fig = plt.figure(figsize=(12, 8))
gs = fig.add_gridspec(3, 3)

ax1 = fig.add_subplot(gs[0, :])
ax2 = fig.add_subplot(gs[1, :-1], sharex=ax1)
ax3 = fig.add_subplot(gs[1:, -1], sharey=ax2)

x = np.linspace(0, 10, 100)
ax1.plot(x, np.sin(x))
ax2.plot(x, np.cos(x))
ax3.plot(np.cos(x), np.linspace(0, 2, 100))

ax1.set_title('Sine curve - how2matplotlib.com')
ax2.set_title('Cosine curve - how2matplotlib.com')
ax3.set_title('Parametric plot - how2matplotlib.com')

plt.tight_layout()
plt.show()
Output:
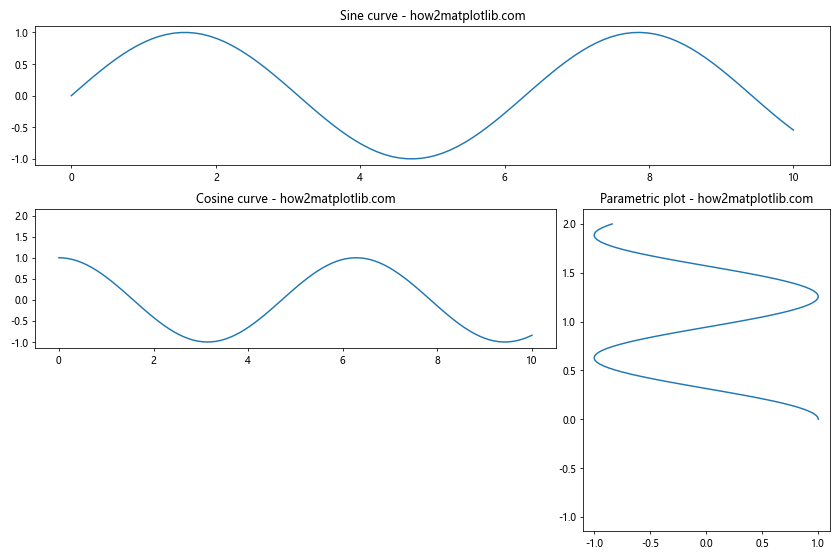
在这个例子中,ax2和ax1共享x轴,ax3和ax2共享y轴。
10. 在跨越子图中添加colorbar
当我们创建包含颜色映射的图像时,通常需要添加一个colorbar。对于跨越多行多列的子图,我们可以创建一个跨越多个网格单元的colorbar。
import matplotlib.pyplot as plt
import numpy as np

fig = plt.figure(figsize=(12, 8))
gs = fig.add_gridspec(3, 3)

ax1 = fig.add_subplot(gs[:-1, :])
ax2 = fig.add_subplot(gs[-1, :-1])
cax = fig.add_subplot(gs[-1, -1])

data = np.random.rand(10, 10)
im = ax1.imshow(data, cmap='viridis')
ax2.plot(np.mean(data, axis=0))

fig.colorbar(im, cax=cax)

ax1.set_title('Image plot - how2matplotlib.com')
ax2.set_title('Mean values - how2matplotlib.com')

plt.tight_layout()
plt.show()
Output:
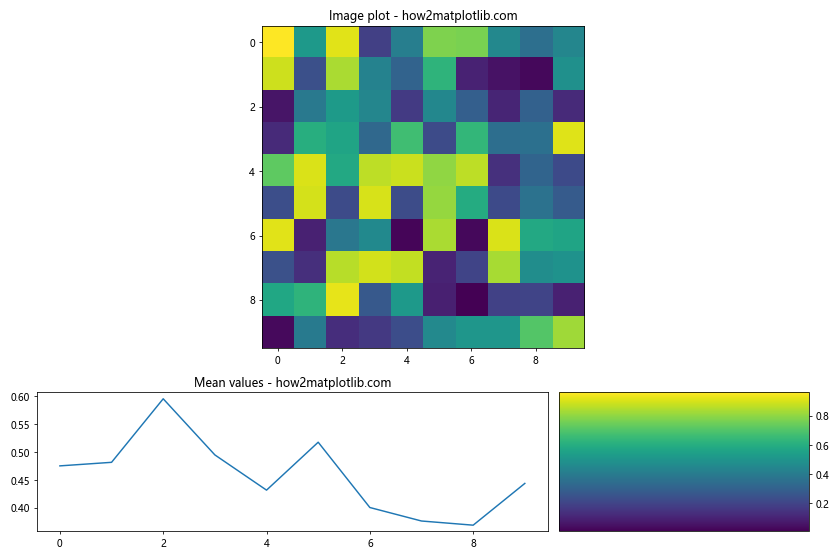
在这个例子中,我们创建了一个主图像子图,一个显示平均值的子图,以及一个跨越整个最后一列的colorbar。
11. 使用constrained_layout
constrained_layout是Matplotlib中的一个新特性,它可以自动调整子图的大小和位置,以避免重叠和确保标签可见。这对于创建跨越多行多列的复杂布局特别有用。
import matplotlib.pyplot as plt
import numpy as np

fig, axs = plt.subplots(3, 3, figsize=(12, 10), constrained_layout=True)

for ax in axs.flat:
    im = ax.imshow(np.random.rand(10, 10), cmap='viridis')
    ax.set_title('Random data - how2matplotlib.com')
    fig.colorbar(im, ax=axs.ravel().tolist(), shrink=0.8)

plt.show()
Output:
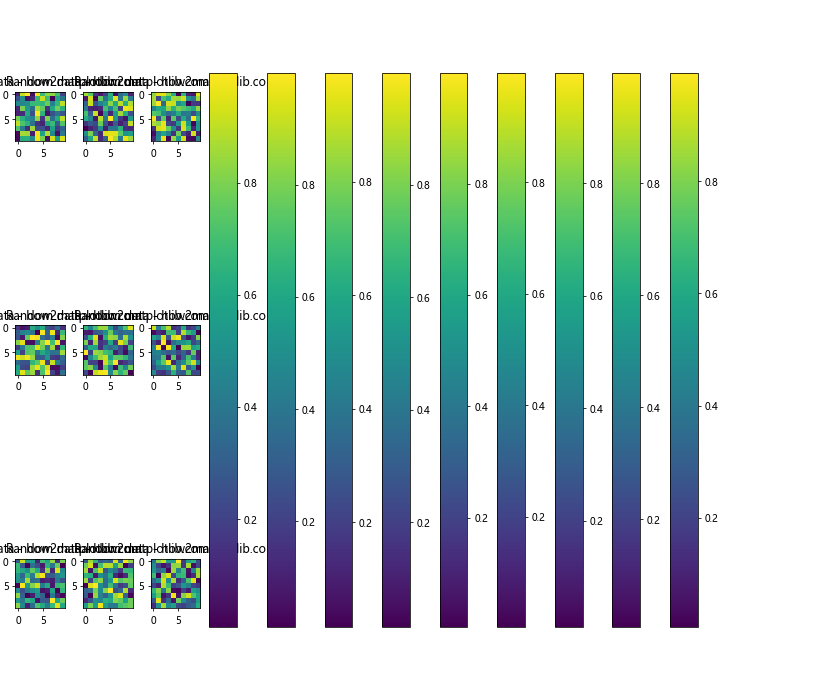
在这个例子中,我们创建了一个3×3的网格,每个子图都包含一个随机数据的图像。通过使用constrained_layout=True,Matplotlib会自动调整子图的大小和位置,以确保colorbar和标题都能正确显示。
12. 创建不对称的子图布局
有时,我们可能需要创建一个不对称的子图布局,其中某些子图比其他子图占据更多的空间。我们可以使用GridSpec的width_ratios和height_ratios参数来实现这一点。
import matplotlib.pyplot as plt
import matplotlib.gridspec as gridspec

fig = plt.figure(figsize=(12, 8))
gs = gridspec.GridSpec(2, 3, width_ratios=[1, 2, 1], height_ratios=[2, 1])

ax1 = fig.add_subplot(gs[0, 0])
ax2 = fig.add_subplot(gs[0, 1:])
ax3 = fig.add_subplot(gs[1, :2])
ax4 = fig.add_subplot(gs[1, 2])

ax1.set_title('Small square - how2matplotlib.com')
ax2.set_title('Wide rectangle - how2matplotlib.com')
ax3.set_title('Wide short rectangle - how2matplotlib.com')
ax4.set_title('Small square - how2matplotlib.com')

plt.tight_layout()
plt.show()
Output:
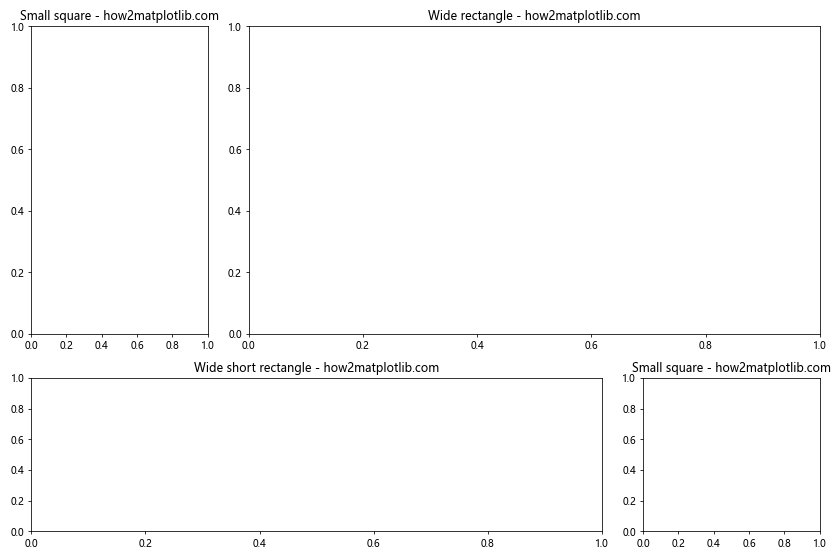
在这个例子中,我们创建了一个2×3的网格,但通过设置width_ratios和height_ratios,我们使得某些子图比其他子图更大。
13. 在子图中嵌入子图
有时,我们可能需要在一个较大的子图中嵌入一个较小的子图。这可以通过使用inset_axes函数来实现。
import matplotlib.pyplot as plt
import numpy as np
from mpl_toolkits.axes_grid1.inset_locator import inset_axes

fig, ax = plt.subplots(figsize=(10, 8))

# 主图
x = np.linspace(0, 10, 100)
ax.plot(x, np.sin(x))
ax.set_title('Main plot with inset - how2matplotlib.com')

# 嵌入的子图
axins = inset_axes(ax, width="40%", height="30%", loc=1)
axins.plot(x, np.cos(x))
axins.set_title('Inset plot - how2matplotlib.com')

plt.show()
Output:
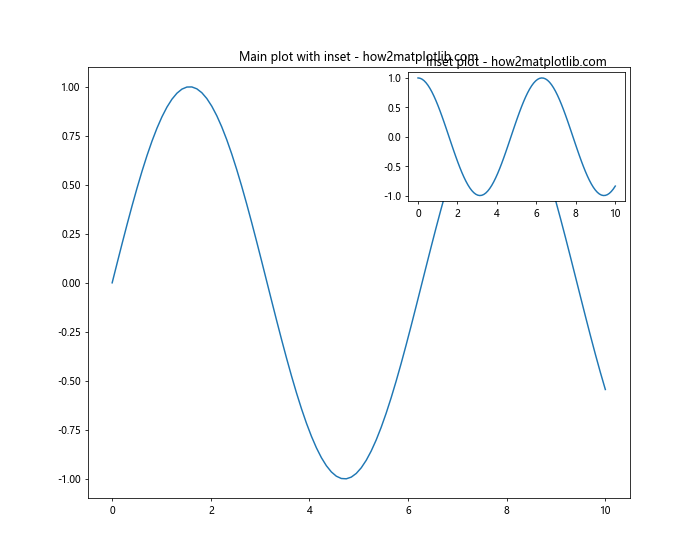
在这个例子中,我们在主图中嵌入了一个较小的子图,显示了不同的数据。
14. 创建具有不同比例的子图
当创建跨越多行多列的子图时,我们可能需要某些子图具有不同的比例。我们可以使用set_aspect方法来实现这一点。
import matplotlib.pyplot as plt
import numpy as np

fig = plt.figure(figsize=(12, 8))
gs = fig.add_gridspec(2, 2)

ax1 = fig.add_subplot(gs[0, 0])
ax2 = fig.add_subplot(gs[0, 1])
ax3 = fig.add_subplot(gs[1, :])

x = np.linspace(0, 10, 100)
ax1.plot(x, np.sin(x))
ax1.set_title('Default aspect - how2matplotlib.com')

ax2.plot(x, np.sin(x))
ax2.set_aspect('equal')
ax2.set_title('Equal aspect - how2matplotlib.com')

ax3.plot(x, np.sin(x))
ax3.set_aspect(0.5)
ax3.set_title('Custom aspect - how2matplotlib.com')

plt.tight_layout()
plt.show()
Output:
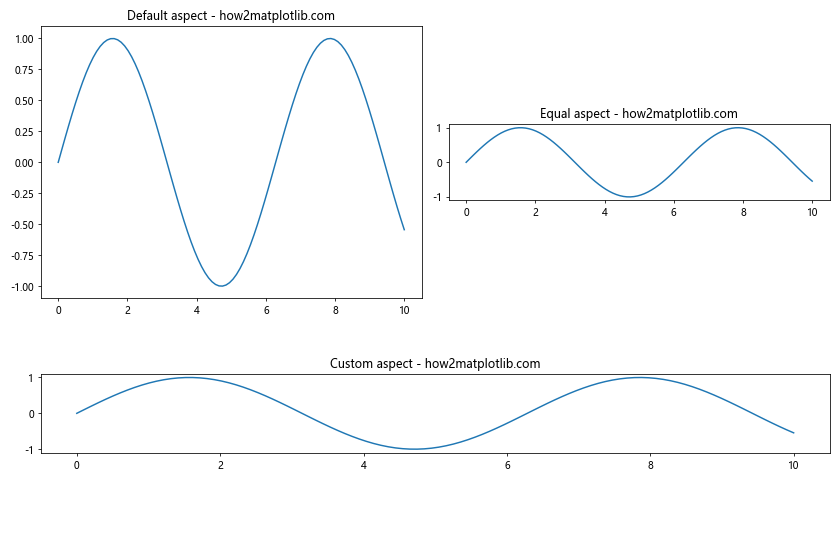
在这个例子中,我们创建了三个子图,每个子图都有不同的纵横比。
15. 使用mosaic创建复杂布局
从Matplotlib 3.3版本开始,我们可以使用plt.subplot_mosaic函数来创建复杂的子图布局。这提供了一种更直观的方式来描述子图的排列。
import matplotlib.pyplot as plt

mosaic = """
ABC
DDE
"""

fig, axd = plt.subplot_mosaic(mosaic, figsize=(12, 8))

for k, ax in axd.items():
    ax.text(0.5, 0.5, f'Subplot {k}', ha='center', va='center')
    ax.set_title(f'Subplot {k} - how2matplotlib.com')

plt.tight_layout()
plt.show()
Output:
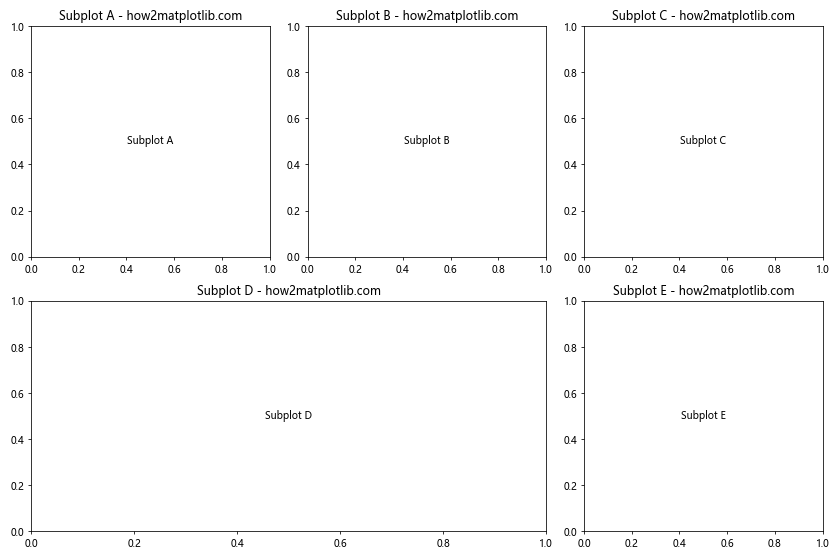
在这个例子中,我们使用一个字符串来描述子图的布局。每个唯一的字符代表一个子图,重复的字符表示该子图跨越多个单元格。
16. 创建具有共享colorbar的多个子图
当我们有多个使用相同颜色映射的子图时,我们可能希望它们共享一个colorbar。这可以通过创建一个跨越所有子图的colorbar来实现。
import matplotlib.pyplot as plt
import numpy as np

fig, axs = plt.subplots(2, 2, figsize=(12, 10))
fig.subplots_adjust(right=0.8)

vmin, vmax = 0, 100
for i in range(2):
    for j in range(2):
        data = np.random.rand(10, 10) * 100
        im = axs[i, j].imshow(data, vmin=vmin, vmax=vmax)
        axs[i, j].set_title(f'Subplot {i},{j} - how2matplotlib.com')

cbar_ax = fig.add_axes([0.85, 0.15, 0.05, 0.7])
fig.colorbar(im, cax=cbar_ax)

plt.show()
Output:
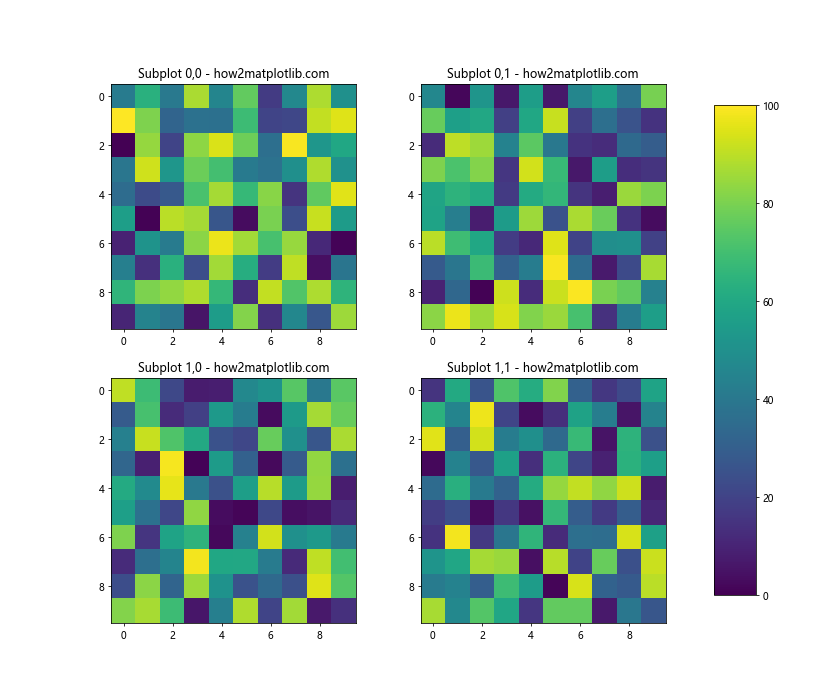
在这个例子中,我们创建了一个2×2的子图网格,每个子图都显示了一个随机数据的热图。所有子图共享同一个colorbar,该colorbar位于图形的右侧。
17. 使用GridSpec创建不规则的子图布局
GridSpec不仅可以用来创建规则的网格,还可以用来创建非常不规则的布局。我们可以通过指定每个子图占据的网格单元来实现这一点。
import matplotlib.pyplot as plt
import matplotlib.gridspec as gridspec

fig = plt.figure(figsize=(12, 8))
gs = gridspec.GridSpec(3, 3)

ax1 = fig.add_subplot(gs[0, :2])
ax2 = fig.add_subplot(gs[0, 2])
ax3 = fig.add_subplot(gs[1:, 0])
ax4 = fig.add_subplot(gs[1:, 1:])

ax1.set_title('Span 2 columns - how2matplotlib.com')
ax2.set_title('Single cell - how2matplotlib.com')
ax3.set_title('Span 2 rows - how2matplotlib.com')
ax4.set_title('Span 2 rows and 2 columns - how2matplotlib.com')

plt.tight_layout()
plt.show()
Output:
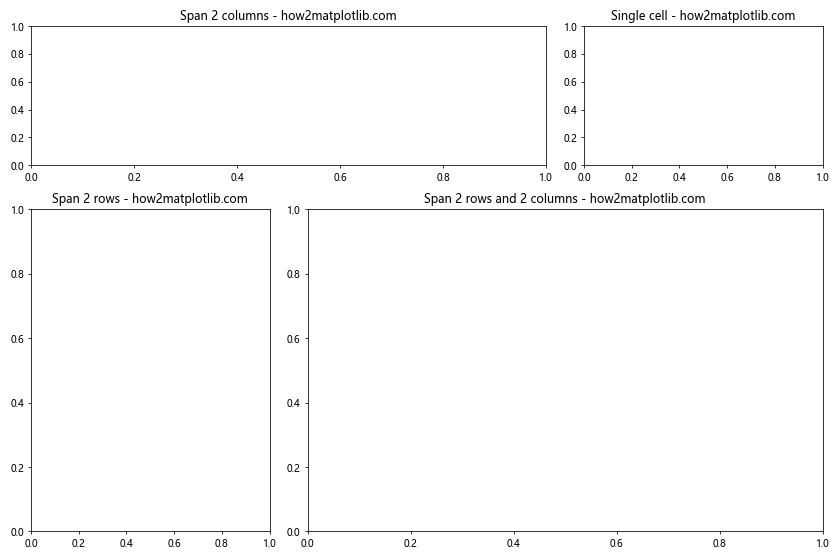
在这个例子中,我们创建了四个子图,每个子图都占据了不同数量和位置的网格单元。
18. 创建具有不同大小的子图
有时,我们可能希望某些子图比其他子图更大或更小。我们可以通过调整GridSpec的参数来实现这一点。
import matplotlib.pyplot as plt
import matplotlib.gridspec as gridspec

fig = plt.figure(figsize=(12, 8))
gs = gridspec.GridSpec(2, 2, width_ratios=[2, 1], height_ratios=[1, 2])

ax1 = fig.add_subplot(gs[0, 0])
ax2 = fig.add_subplot(gs[0, 1])
ax3 = fig.add_subplot(gs[1, 0])
ax4 = fig.add_subplot(gs[1, 1])

ax1.set_title('Large width - how2matplotlib.com')
ax2.set_title('Small width - how2matplotlib.com')
ax3.set_title('Large height - how2matplotlib.com')
ax4.set_title('Small height - how2matplotlib.com')

plt.tight_layout()
plt.show()
Output:
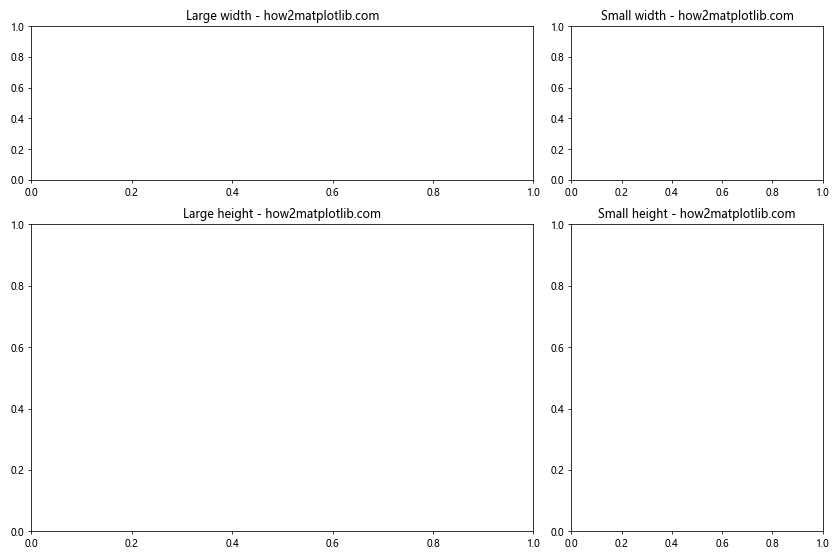
在这个例子中,我们创建了一个2×2的网格,但通过设置width_ratios和height_ratios,我们使得某些子图比其他子图更大。
总结
在本文中,我们深入探讨了如何在Matplotlib中创建跨越多行多列的子图布局。我们学习了使用GridSpec、subplot2grid、add_gridspec等多种方法来创建复杂的布局。我们还讨论了如何调整子图之间的间距、创建不规则的网格布局、嵌套GridSpec、动态调整子图大小、添加共享轴和colorbar等高级技巧。
通过掌握这些技术,你可以创建出复杂而美观的图表布局,更好地展示你的数据和分析结果。记住,创建好的可视化不仅仅是about展示数据,还关乎如何有效地传达信息。通过合理地组织和布局你的子图,你可以让你的图表更加清晰、直观,从而更好地讲述你的数据故事。
最后,建议你在实际应用中多加练习和实验。每个数据集和可视化需求都是独特的,通过不断尝试不同的布局和组合,你会发现最适合你特定需求的方法。记住,在Matplotlib中,几乎任何你能想象到的布局都是可能实现的,关键是要充分利用这些工具,创造出既美观又有效的数据可视化。
 极客笔记
极客笔记