在Matplotlib中给坐标轴添加标签
Matplotlib 是一个功能强大的绘图库,可以帮助我们创建各种类型的图表。在绘制图表时,添加合适的标签可以让图表更易懂。
给坐标轴添加标签
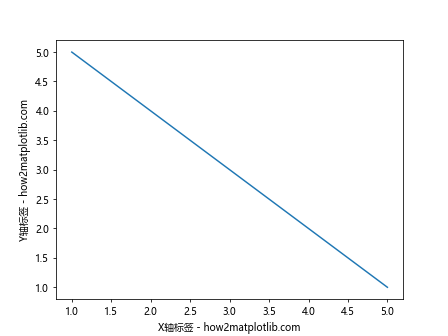
在 Matplotlib 中,我们可以给坐标轴添加标签来说明坐标轴所代表的含义。在绘图过程中,我们可以使用 xlabel() 函数给 x 轴添加标签,使用 ylabel() 函数给 y 轴添加标签。
import matplotlib.pyplot as plt

x = [1, 2, 3, 4, 5]
y = [5, 4, 3, 2, 1]

plt.plot(x, y)
plt.xlabel('X轴标签 - how2matplotlib.com')
plt.ylabel('Y轴标签 - how2matplotlib.com')
plt.show()
Output:
自定义标签的字体大小和颜色
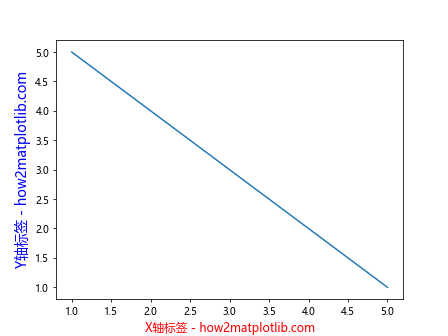
我们可以通过设置 fontsize 参数来调整标签的字体大小,通过设置 color 参数来调整标签的颜色。
import matplotlib.pyplot as plt

x = [1, 2, 3, 4, 5]
y = [5, 4, 3, 2, 1]

plt.plot(x, y)
plt.xlabel('X轴标签 - how2matplotlib.com', fontsize=12, color='red')
plt.ylabel('Y轴标签 - how2matplotlib.com', fontsize=14, color='blue')
plt.show()
Output:
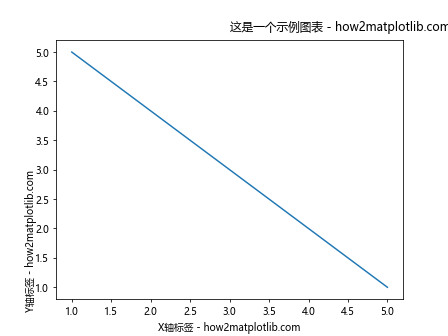
给坐标轴添加标题
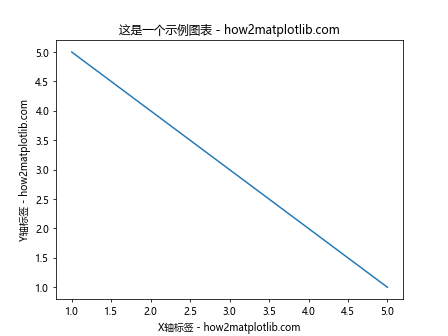
除了添加标签外,我们还可以给坐标轴添加标题来描述整个图表的含义。title() 函数可以用来添加标题。
import matplotlib.pyplot as plt

x = [1, 2, 3, 4, 5]
y = [5, 4, 3, 2, 1]

plt.plot(x, y)
plt.xlabel('X轴标签 - how2matplotlib.com')
plt.ylabel('Y轴标签 - how2matplotlib.com')
plt.title('这是一个示例图表 - how2matplotlib.com')
plt.show()
Output:
调整标签的位置
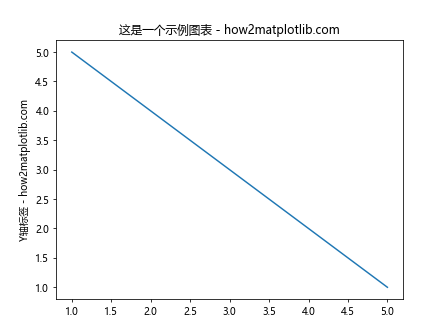
有时候我们可能需要调整标签的位置,比如将 x 轴标签放在图形的下方。我们可以使用 labelpad 参数来设置标签与轴之间的距离。
import matplotlib.pyplot as plt

x = [1, 2, 3, 4, 5]
y = [5, 4, 3, 2, 1]

plt.plot(x, y)
plt.xlabel('X轴标签 - how2matplotlib.com', labelpad=20)
plt.ylabel('Y轴标签 - how2matplotlib.com')
plt.title('这是一个示例图表 - how2matplotlib.com')
plt.show()
Output:
更改标签的旋转角度
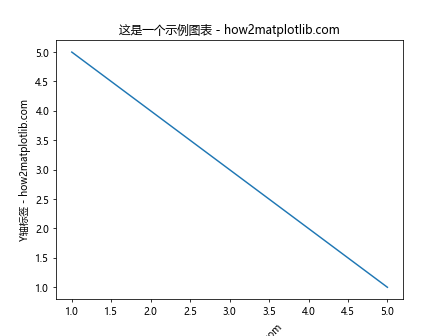
有时候,标签过长会导致显示不全,我们可以通过设置 rotation 参数来旋转标签的角度,使其更易于阅读。
import matplotlib.pyplot as plt

x = [1, 2, 3, 4, 5]
y = [5, 4, 3, 2, 1]

plt.plot(x, y)
plt.xlabel('X轴标签 - how2matplotlib.com', rotation=45)
plt.ylabel('Y轴标签 - how2matplotlib.com')
plt.title('这是一个示例图表 - how2matplotlib.com')
plt.show()
Output:
自定义标签的字体样式
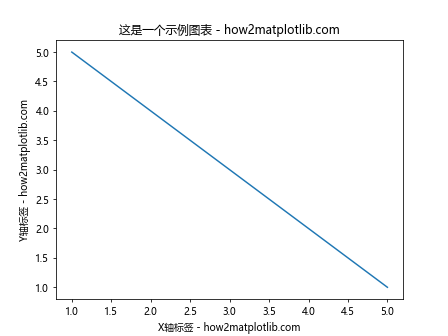
我们还可以通过设置 style 参数来自定义标签的字体样式,如粗体、斜体等。
import matplotlib.pyplot as plt

x = [1, 2, 3, 4, 5]
y = [5, 4, 3, 2, 1]

plt.plot(x, y)
plt.xlabel('X轴标签 - how2matplotlib.com', style='italic')
plt.ylabel('Y轴标签 - how2matplotlib.com', style='oblique')
plt.title('这是一个示例图表 - how2matplotlib.com')
plt.show()
Output:
调整标签与轴的距离
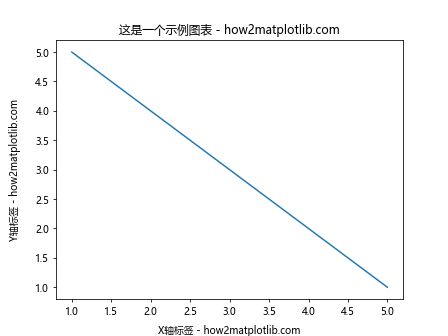
有时候,我们需要调整标签与轴之间的距离,可以使用 set_label_coords() 函数来设置标签的位置。
import matplotlib.pyplot as plt

x = [1, 2, 3, 4, 5]
y = [5, 4, 3, 2, 1]

fig, ax = plt.subplots()
ax.plot(x, y)
ax.set_xlabel('X轴标签 - how2matplotlib.com')
ax.set_ylabel('Y轴标签 - how2matplotlib.com')
ax.set_title('这是一个示例图表 - how2matplotlib.com')
ax.xaxis.set_label_coords(0.5, -0.1)
ax.yaxis.set_label_coords(-0.1, 0.5)
plt.show()
Output:
隐藏坐标轴
有时候,我们可能不需要显示坐标轴,可以使用 axis('off') 函数来隐藏坐标轴。
import matplotlib.pyplot as plt

x = [1, 2, 3, 4, 5]
y = [5, 4, 3, 2, 1]

plt.plot(x, y)
plt.axis('off')
plt.show()
Output:

设置标签的背景颜色
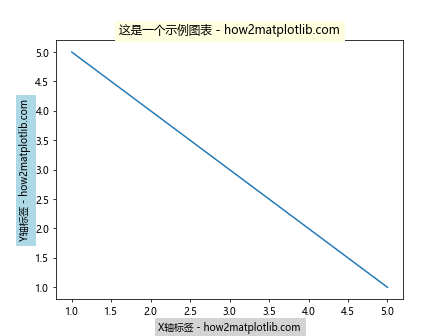
我们也可以通过设置 backgroundcolor 参数来为标签添加背景颜色,提高标签的可读性。
import matplotlib.pyplot as plt

x = [1, 2, 3, 4, 5]
y = [5, 4, 3, 2, 1]

plt.plot(x, y)
plt.xlabel('X轴标签 - how2matplotlib.com', backgroundcolor='lightgray')
plt.ylabel('Y轴标签 - how2matplotlib.com', backgroundcolor='lightblue')
plt.title('这是一个示例图表 - how2matplotlib.com', backgroundcolor='lightyellow')
plt.show()
Output:
调整标签的对齐方式
我们可以通过设置 ha 和 va 参数来调整标签的水平对齐和垂直对齐方式,使其更加美观。
import matplotlib.pyplot as plt

x = [1, 2, 3, 4, 5]
y = [5, 4, 3, 2, 1]

plt.plot(x, y)
plt.xlabel('X轴标签 - how2matplotlib.com', ha='center', va='top')
plt.ylabel('Y轴标签 - how2matplotlib.com', ha='right', va='center')
plt.title('这是一个示例图表 - how2matplotlib.com', ha='left', va='bottom')
plt.show()
Output:
使用 Latex 渲染标签
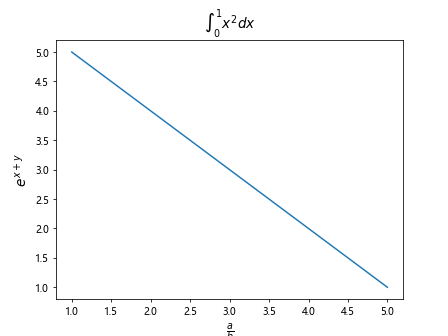
Matplotlib 支持使用 Latex 渲染标签,可以使标签显示更加美观。我们可以在标签中使用 Latex 的语法来实现。
import matplotlib.pyplot as plt

x = [1, 2, 3, 4, 5]
y = [5, 4, 3, 2, 1]

plt.plot(x, y)
plt.xlabel(r'\frac{a}{b}', fontsize=14)
plt.ylabel(r'e^{x+y}', fontsize=14)
plt.title(r'\int_{0}^{1} x^2 dx', fontsize=14)
plt.show()
Output:
调整标签的间距
有时候,我们可能需要调整标签之间的间距,可以使用 labelspacing 参数来实现。
import matplotlib.pyplot as plt

x = [1, 2, 3, 4, 5]
y = [5, 4, 3, 2, 1]

plt.plot(x, y)
plt.xlabel('X轴标签 - how2matplotlib.com', labelspacing=2)
plt.ylabel('Y轴标签 - how2matplotlib.com', labelspacing=4)
plt.title('这是一个示例图表 - how2matplotlib.com', labelspacing=6)
plt.show()
添加多行标签
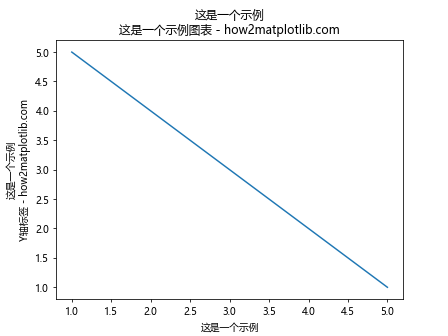
有时候我们可能需要添加多行标签,可以使用 \n 来实现换行。
import matplotlib.pyplot as plt

x = [1, 2, 3, 4, 5]
y = [5, 4, 3, 2, 1]

plt.plot(x, y)
plt.xlabel('这是一个示例\nX轴标签 - how2matplotlib.com')
plt.ylabel('这是一个示例\nY轴标签 - how2matplotlib.com')
plt.title('这是一个示例\n这是一个示例图表 - how2matplotlib.com')
plt.show()
Output:
以上便是如何在 Matplotlib 中给坐标轴添加标签的示例代码。通过合理的标签设置,可以使得图表更加清晰易懂。
 极客笔记
极客笔记