如何在matplotlib中设置图例位置
参考:how to set legend position in matplotlib
在绘制图表时,图例是一种非常重要的元素,它能够为观众提供关于数据系列的信息。在matplotlib中,我们可以通过设置图例的位置来调整图例的显示位置。接下来我们将介绍如何在matplotlib中设置图例的位置。
设置图例的位置
在matplotlib中,我们可以使用loc参数来设置图例的位置。loc参数可以指定图例的位置,其常用的取值包括:
- ‘best’:自动选择最佳位置
- ‘upper right’:右上角
- ‘upper left’:左上角
- ‘lower left’:左下角
- ‘lower right’:右下角
- ‘right’:右侧
- ‘center left’:左侧中间
- ‘center right’:右侧中间
- ‘lower center’:下方中间
- ‘upper center’:上方中间
- ‘center’:正中间
下面是一些示例代码,演示如何设置图例的位置:
import matplotlib.pyplot as plt

x = [1, 2, 3, 4, 5]
y1 = [1, 4, 9, 16, 25]
y2 = [1, 3, 6, 10, 15]

plt.plot(x, y1, label='y1')
plt.plot(x, y2, label='y2')

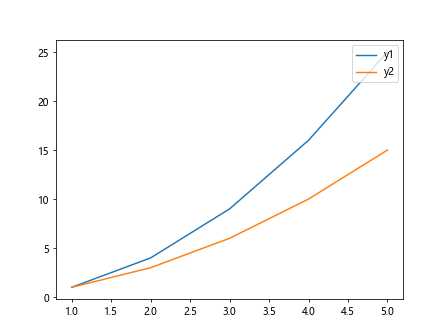
plt.legend(loc='upper right')

plt.show()
Output:

import matplotlib.pyplot as plt

x = [1, 2, 3, 4, 5]
y1 = [1, 4, 9, 16, 25]
y2 = [1, 3, 6, 10, 15]

plt.plot(x, y1, label='y1')
plt.plot(x, y2, label='y2')

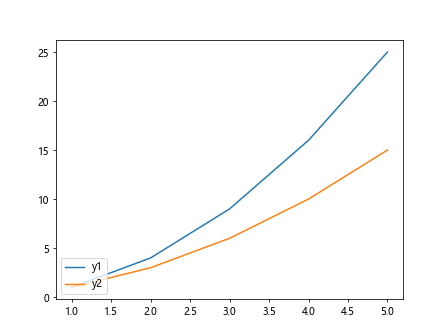
plt.legend(loc='lower left')

plt.show()
Output:

import matplotlib.pyplot as plt

x = [1, 2, 3, 4, 5]
y1 = [1, 4, 9, 16, 25]
y2 = [1, 3, 6, 10, 15]

plt.plot(x, y1, label='y1')
plt.plot(x, y2, label='y2')

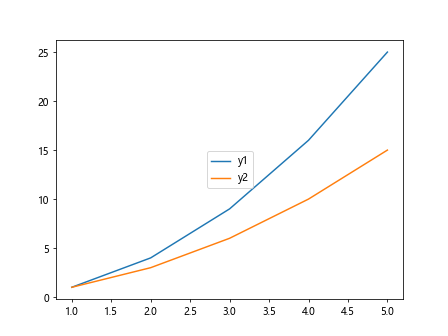
plt.legend(loc='center')

plt.show()
Output:

通过修改loc参数的取值,我们可以轻松地调整图例的位置。
改变图例的外观
除了设置图例的位置之外,我们还可以改变图例的外观。在matplotlib中,我们可以使用bbox_to_anchor参数来设置图例的位置和偏移量。
下面是一个示例代码,演示如何使用bbox_to_anchor参数来设置图例的位置:
import matplotlib.pyplot as plt

x = [1, 2, 3, 4, 5]
y1 = [1, 4, 9, 16, 25]
y2 = [1, 3, 6, 10, 15]

plt.plot(x, y1, label='y1')
plt.plot(x, y2, label='y2')

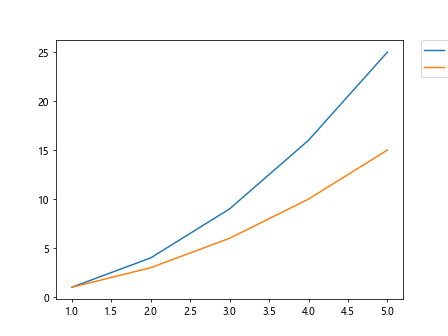
plt.legend(bbox_to_anchor=(1.05, 1), loc='upper left', borderaxespad=0.)

plt.show()
Output:

在上面的示例中,bbox_to_anchor=(1.05, 1)表示将图例放在轴的右上方,并且将其往右上方偏移一定的距离。
通过修改bbox_to_anchor参数的取值,我们可以自定义图例的位置和偏移量。
自定义图例的文本和标记
在matplotlib中,我们可以通过legend()函数的labels参数来自定义图例的文本,通过markers参数来自定义图例的标记。
下面是一个示例代码,演示如何自定义图例的文本和标记:
import matplotlib.pyplot as plt

x = [1, 2, 3, 4, 5]
y1 = [1, 4, 9, 16, 25]
y2 = [1, 3, 6, 10, 15]

plt.plot(x, y1, label='Line 1', marker='o')
plt.plot(x, y2, label='Line 2', marker='s')

plt.legend(labels=['First Line', 'Second Line'], markers=['o', 's'])

plt.show()
在上面的示例中,我们分别为两条曲线设置了不同的文本和标记。
结论
通过本文的介绍,我们了解了如何在matplotlib中设置图例的位置、改变图例的外观,以及自定义图例的文本和标记。掌握这些技巧能够帮助我们更好地呈现数据可视化图表,提升数据分析的效率和效果。
 极客笔记
极客笔记