如何在Python Pandas中将DataFrame列值设置为X轴标签
参考:How to Set Dataframe Column Value as X-axis Labels in Python Pandas
在数据分析和可视化中,将DataFrame的列值设置为X轴标签是一个常见且重要的任务。本文将详细介绍如何使用Python的Pandas库和Matplotlib库来实现这一目标。我们将探讨多种方法和技巧,以便在不同场景下灵活运用。
1. 基础知识
在开始之前,我们需要了解一些基础知识:
1.1 Pandas DataFrame
Pandas DataFrame是一个二维标记数据结构,具有可能不同类型的列。它是Python中进行数据分析的核心工具之一。
1.2 Matplotlib
Matplotlib是一个综合性的Python绘图库,用于创建静态、动画和交互式可视化。
1.3 X轴标签
X轴标签是图表中横轴上的文本或数值,用于标识数据点的类别或值。
2. 准备工作
在开始实际操作之前,我们需要导入必要的库并创建一个示例DataFrame:
import pandas as pd
import matplotlib.pyplot as plt

# 创建示例DataFrame
data = {
    'Month': ['Jan', 'Feb', 'Mar', 'Apr', 'May', 'Jun'],
    'Sales': [1000, 1200, 1500, 1300, 1800, 2000],
    'Visitors': [500, 600, 750, 800, 900, 1000]
}
df = pd.DataFrame(data)

print("DataFrame created for how2matplotlib.com:")
print(df)
这段代码创建了一个包含月份、销售额和访客数的简单DataFrame。
3. 基本方法:使用DataFrame索引作为X轴标签
最简单的方法是将DataFrame的索引设置为要用作X轴标签的列,然后直接绘图:
import pandas as pd
import matplotlib.pyplot as plt

# 创建示例DataFrame
data = {
    'Month': ['Jan', 'Feb', 'Mar', 'Apr', 'May', 'Jun'],
    'Sales': [1000, 1200, 1500, 1300, 1800, 2000],
    'Visitors': [500, 600, 750, 800, 900, 1000]
}
df = pd.DataFrame(data)

# 将'Month'列设置为索引
df.set_index('Month', inplace=True)

# 绘制图表
plt.figure(figsize=(10, 6))
df['Sales'].plot(kind='bar')
plt.title('Monthly Sales - how2matplotlib.com')
plt.xlabel('Month')
plt.ylabel('Sales')
plt.show()
Output:
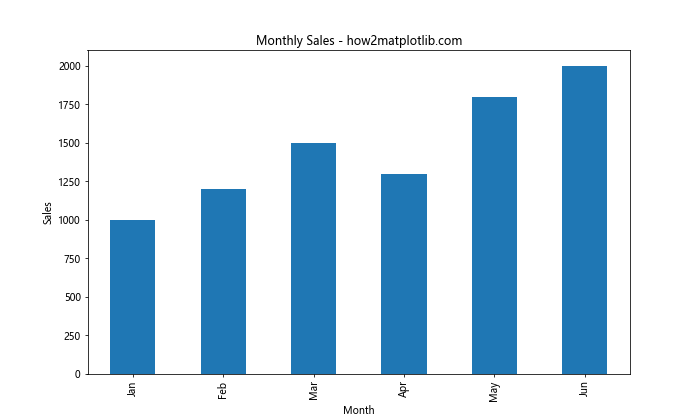
在这个例子中,我们首先将’Month’列设置为DataFrame的索引。然后,我们使用Pandas的plot方法绘制条形图。Matplotlib会自动使用索引作为X轴标签。
4. 使用plt.xticks()设置X轴标签
有时,我们可能不想改变DataFrame的结构。在这种情况下,我们可以使用plt.xticks()函数来手动设置X轴标签:
import pandas as pd
import matplotlib.pyplot as plt

# 创建示例DataFrame
data = {
    'Month': ['Jan', 'Feb', 'Mar', 'Apr', 'May', 'Jun'],
    'Sales': [1000, 1200, 1500, 1300, 1800, 2000],
    'Visitors': [500, 600, 750, 800, 900, 1000]
}
df = pd.DataFrame(data)

# 重置索引(如果之前已经设置过)
df.reset_index(inplace=True)

plt.figure(figsize=(10, 6))
plt.bar(range(len(df)), df['Sales'])
plt.xticks(range(len(df)), df['Month'])
plt.title('Monthly Sales - how2matplotlib.com')
plt.xlabel('Month')
plt.ylabel('Sales')
plt.show()
Output:
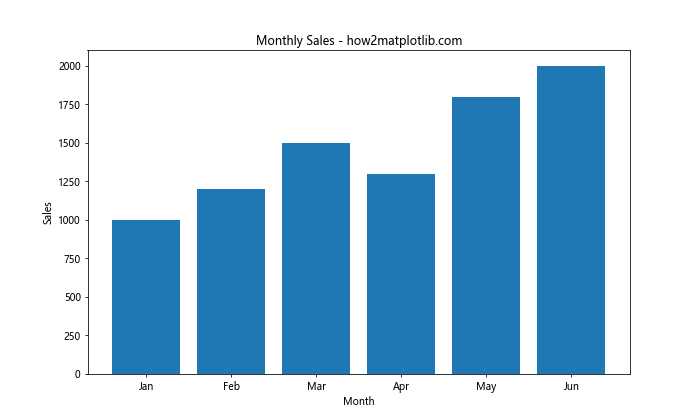
在这个例子中,我们首先使用plt.bar()函数绘制条形图,X轴使用数字索引。然后,我们使用plt.xticks()函数将X轴的刻度标签替换为’Month’列的值。
5. 使用DataFrame的plot方法
Pandas提供了一个方便的plot方法,可以直接在DataFrame上调用:
import pandas as pd
import matplotlib.pyplot as plt

# 创建示例DataFrame
data = {
    'Month': ['Jan', 'Feb', 'Mar', 'Apr', 'May', 'Jun'],
    'Sales': [1000, 1200, 1500, 1300, 1800, 2000],
    'Visitors': [500, 600, 750, 800, 900, 1000]
}
df = pd.DataFrame(data)

plt.figure(figsize=(10, 6))
df.plot(x='Month', y='Sales', kind='bar')
plt.title('Monthly Sales - how2matplotlib.com')
plt.xlabel('Month')
plt.ylabel('Sales')
plt.show()
Output:
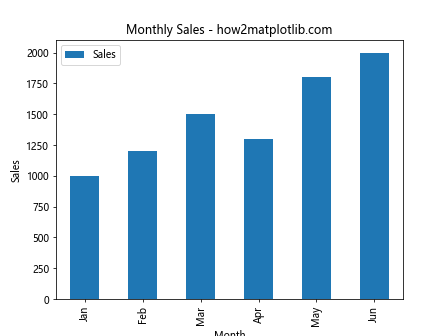
这个方法非常直观,我们只需要指定x和y参数,以及图表类型(在这里是’bar’)。
6. 处理日期类型的X轴标签
当处理日期数据时,我们可能需要特别注意格式化X轴标签:
import pandas as pd
import matplotlib.pyplot as plt

# 创建示例DataFrame
data = {
    'Month': ['Jan', 'Feb', 'Mar', 'Apr', 'May', 'Jun'],
    'Sales': [1000, 1200, 1500, 1300, 1800, 2000],
    'Visitors': [500, 600, 750, 800, 900, 1000]
}
df = pd.DataFrame(data)

# 创建包含日期的DataFrame
date_data = {
    'Date': pd.date_range(start='2023-01-01', periods=6, freq='M'),
    'Sales': [1000, 1200, 1500, 1300, 1800, 2000]
}
date_df = pd.DataFrame(date_data)

plt.figure(figsize=(10, 6))
date_df.plot(x='Date', y='Sales', kind='line')
plt.title('Monthly Sales Trend - how2matplotlib.com')
plt.xlabel('Date')
plt.ylabel('Sales')

# 格式化X轴日期标签
plt.gcf().autofmt_xdate()
plt.show()
Output:
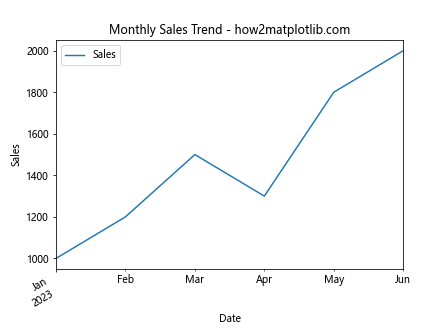
在这个例子中,我们使用pd.date_range()创建了一个日期序列。然后,我们使用DataFrame的plot方法绘制线图。最后,我们使用plt.gcf().autofmt_xdate()自动格式化X轴的日期标签,使其更易读。
7. 自定义X轴标签的旋转和对齐
有时,X轴标签可能会重叠,特别是当标签较长或数据点较多时。我们可以通过旋转标签和调整对齐来解决这个问题:
import pandas as pd
import matplotlib.pyplot as plt

# 创建示例DataFrame
data = {
    'Month': ['Jan', 'Feb', 'Mar', 'Apr', 'May', 'Jun'],
    'Sales': [1000, 1200, 1500, 1300, 1800, 2000],
    'Visitors': [500, 600, 750, 800, 900, 1000]
}
df = pd.DataFrame(data)

plt.figure(figsize=(12, 6))
df.plot(x='Month', y='Sales', kind='bar')
plt.title('Monthly Sales with Rotated Labels - how2matplotlib.com')
plt.xlabel('Month')
plt.ylabel('Sales')

# 旋转X轴标签并设置对齐
plt.xticks(rotation=45, ha='right')
plt.tight_layout()
plt.show()
Output:
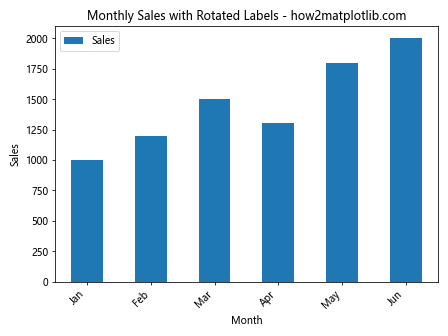
在这个例子中,我们使用plt.xticks()函数将X轴标签旋转45度,并将水平对齐设置为’right’。plt.tight_layout()函数用于自动调整子图参数,以给出指定的填充。
8. 使用Seaborn库增强可视化效果
Seaborn是基于Matplotlib的统计数据可视化库,它提供了更美观的默认样式和更高级的绘图功能:
import seaborn as sns
import pandas as pd
import matplotlib.pyplot as plt

# 创建示例DataFrame
data = {
    'Month': ['Jan', 'Feb', 'Mar', 'Apr', 'May', 'Jun'],
    'Sales': [1000, 1200, 1500, 1300, 1800, 2000],
    'Visitors': [500, 600, 750, 800, 900, 1000]
}
df = pd.DataFrame(data)

plt.figure(figsize=(10, 6))
sns.barplot(x='Month', y='Sales', data=df)
plt.title('Monthly Sales (Seaborn) - how2matplotlib.com')
plt.xlabel('Month')
plt.ylabel('Sales')
plt.show()
Output:
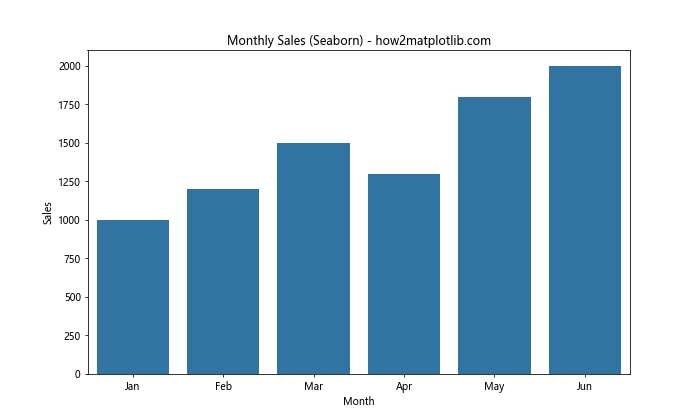
这个例子使用Seaborn的barplot函数创建了一个条形图。Seaborn会自动处理X轴标签,并提供更美观的默认样式。
9. 处理多个Y轴数据系列
当我们需要在同一图表中显示多个数据系列时,可以使用以下方法:
import pandas as pd
import matplotlib.pyplot as plt

# 创建示例DataFrame
data = {
    'Month': ['Jan', 'Feb', 'Mar', 'Apr', 'May', 'Jun'],
    'Sales': [1000, 1200, 1500, 1300, 1800, 2000],
    'Visitors': [500, 600, 750, 800, 900, 1000]
}
df = pd.DataFrame(data)

plt.figure(figsize=(12, 6))
ax = plt.gca()

df.plot(kind='bar', x='Month', y='Sales', ax=ax)
df.plot(kind='line', x='Month', y='Visitors', ax=ax, secondary_y=True, color='red', marker='o')

plt.title('Monthly Sales and Visitors - how2matplotlib.com')
plt.xlabel('Month')
ax.set_ylabel('Sales')
ax.right_ax.set_ylabel('Visitors')

plt.show()
Output:
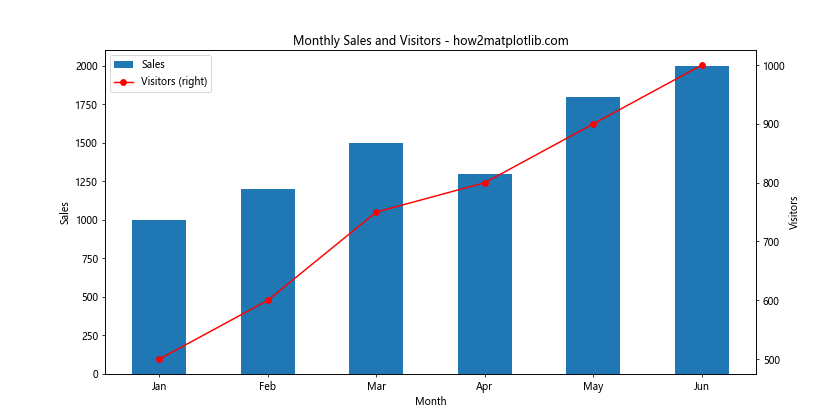
在这个例子中,我们在同一个图表上绘制了销售额(条形图)和访客数(线图)。我们使用secondary_y=True参数创建了一个次坐标轴来显示访客数。
10. 使用分类数据作为X轴标签
当处理分类数据时,我们可能需要使用Pandas的Categorical数据类型:
import pandas as pd
import matplotlib.pyplot as plt

# 创建示例DataFrame
data = {
    'Month': ['Jan', 'Feb', 'Mar', 'Apr', 'May', 'Jun'],
    'Sales': [1000, 1200, 1500, 1300, 1800, 2000],
    'Visitors': [500, 600, 750, 800, 900, 1000]
}
df = pd.DataFrame(data)

# 创建包含分类数据的DataFrame
cat_data = {
    'Category': ['A', 'B', 'C', 'D', 'E'] * 2,
    'Value': [10, 20, 15, 25, 30, 35, 40, 45, 50, 55]
}
cat_df = pd.DataFrame(cat_data)
cat_df['Category'] = pd.Categorical(cat_df['Category'], categories=['A', 'B', 'C', 'D', 'E'], ordered=True)

plt.figure(figsize=(10, 6))
sns.boxplot(x='Category', y='Value', data=cat_df)
plt.title('Value Distribution by Category - how2matplotlib.com')
plt.xlabel('Category')
plt.ylabel('Value')
plt.show()
在这个例子中,我们创建了一个包含分类数据的DataFrame,并使用Seaborn的boxplot函数创建了一个箱线图。Pandas的Categorical数据类型确保了类别的正确顺序。
11. 处理大量X轴标签
当X轴标签数量很多时,我们可能需要选择性地显示部分标签:
import pandas as pd
import matplotlib.pyplot as plt

# 创建示例DataFrame
data = {
    'Month': ['Jan', 'Feb', 'Mar', 'Apr', 'May', 'Jun'],
    'Sales': [1000, 1200, 1500, 1300, 1800, 2000],
    'Visitors': [500, 600, 750, 800, 900, 1000]
}
df = pd.DataFrame(data)

# 创建包含大量数据点的DataFrame
large_data = {
    'Date': pd.date_range(start='2023-01-01', periods=100, freq='D'),
    'Value': np.random.randn(100).cumsum()
}
large_df = pd.DataFrame(large_data)

plt.figure(figsize=(15, 6))
large_df.plot(x='Date', y='Value', kind='line')
plt.title('Time Series with Many Data Points - how2matplotlib.com')
plt.xlabel('Date')
plt.ylabel('Value')

# 选择性显示X轴标签
plt.xticks(large_df['Date'][::10], large_df['Date'].dt.strftime('%Y-%m-%d')[::10], rotation=45, ha='right')
plt.tight_layout()
plt.show()
在这个例子中,我们创建了一个包含100个数据点的时间序列。为了避免X轴标签过于拥挤,我们使用切片操作[::10]每隔10个数据点显示一个标签。
12. 使用自定义函数格式化X轴标签
有时,我们可能需要对X轴标签进行复杂的格式化。这时可以使用自定义函数:
import pandas as pd
import matplotlib.pyplot as plt

# 创建示例DataFrame
data = {
    'Month': ['Jan', 'Feb', 'Mar', 'Apr', 'May', 'Jun'],
    'Sales': [1000, 1200, 1500, 1300, 1800, 2000],
    'Visitors': [500, 600, 750, 800, 900, 1000]
}
df = pd.DataFrame(data)

def format_label(x):
    return f"Month {x+1}\n{df['Month'][x]}"

plt.figure(figsize=(12, 6))
plt.bar(range(len(df)), df['Sales'])
plt.xticks(range(len(df)), [format_label(i) for i in range(len(df))])
plt.title('Monthly Sales with Custom Labels - how2matplotlib.com')
plt.xlabel('Month')
plt.ylabel('Sales')
plt.tight_layout()
plt.show()
Output:
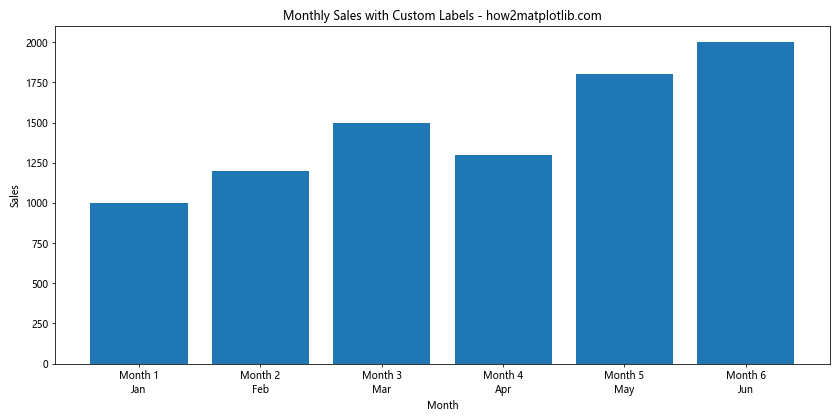
在这个例子中,我们定义了一个format_label函数来创建自定义标签。这个函数将月份编号和月份名称组合在一起。
13. 处理不连续的X轴数据
当X轴数据不连续时,我们可能需要特别处理:
import pandas as pd
import matplotlib.pyplot as plt

# 创建示例DataFrame
data = {
    'Month': ['Jan', 'Feb', 'Mar', 'Apr', 'May', 'Jun'],
    'Sales': [1000, 1200, 1500, 1300, 1800, 2000],
    'Visitors': [500, 600, 750, 800, 900, 1000]
}
df = pd.DataFrame(data)

# 创建包含不连续数据的DataFrame
discontinuous_data = {
    'Year': [2018, 2019, 2021, 2022, 2023],
    'Sales': [1000, 1200, 1500, 1800, 2000]
}
disc_df = pd.DataFrame(discontinuous_data)

plt.figure(figsize=(10, 6))
plt.plot(disc_df['Year'], disc_df['Sales'], marker='o')
plt.title('Sales Trend (Discontinuous Data) - how2matplotlib.com')
plt.xlabel('Year')
plt.ylabel('Sales')

# 设置X轴刻度和标签
plt.xticks(disc_df['Year'])

# 突出显示数据缺失的年份
plt.text(2020, plt.ylim()[0], 'No Data', ha='center', va='bottom', color='red')

plt.show()
Output:
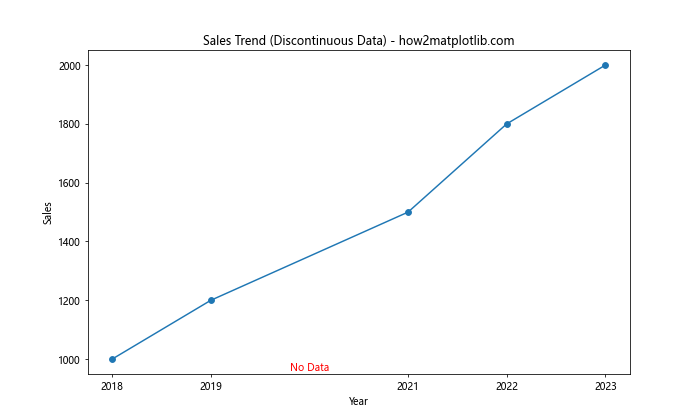
在这个例子中,我们处理了一个有缺失年份的销售数据。我们使用plt.xticks()确保只显示有数据的年份,并用plt.text()添加了一个注释来标明缺失数据的年份。
14. 使用颜色编码增强X轴标签信息
我们可以使用颜色来为X轴标签添加额外的信息维度:
import matplotlib.colors as mcolors
import pandas as pd
import matplotlib.pyplot as plt

# 创建示例DataFrame
data = {
    'Month': ['Jan', 'Feb', 'Mar', 'Apr', 'May', 'Jun'],
    'Sales': [1000, 1200, 1500, 1300, 1800, 2000],
    'Visitors': [500, 600, 750, 800, 900, 1000]
}
df = pd.DataFrame(data)

# 为每个月份分配一个季节
seasons = ['Winter', 'Winter', 'Spring', 'Spring', 'Summer', 'Summer']
season_colors = {'Winter': 'blue', 'Spring': 'green', 'Summer': 'red'}

plt.figure(figsize=(12, 6))
bars = plt.bar(df['Month'], df['Sales'])

# 根据季节为条形图着色
for bar, season in zip(bars, seasons):
    bar.set_color(season_colors[season])

plt.title('Monthly Sales with Seasonal Colors - how2matplotlib.com')
plt.xlabel('Month')
plt.ylabel('Sales')

# 为X轴标签着色
for i, (month, season) in enumerate(zip(df['Month'], seasons)):
    plt.text(i, plt.ylim()[0], month, ha='center', va='top', color=season_colors[season], fontweight='bold')

plt.xticks([])  # 移除原始X轴标签
plt.tight_layout()
plt.show()
Output:
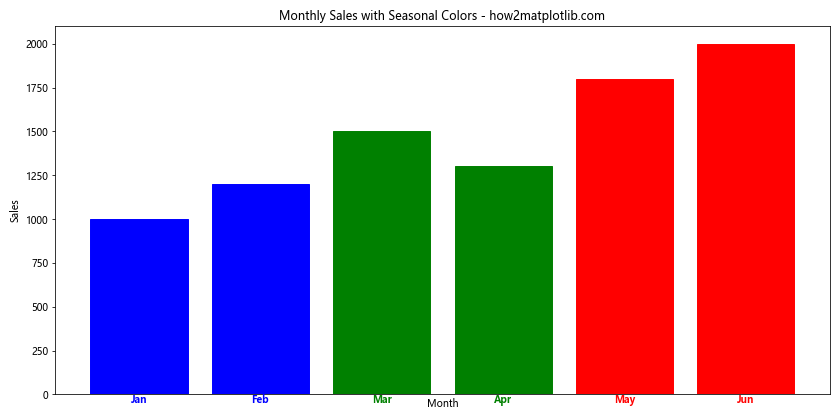
在这个例子中,我们根据月份所属的季节为条形图和X轴标签着色。这种方法可以直观地展示季节性趋势。
15. 使用双层X轴标签
有时,我们可能需要在X轴上显示两层信息:
import pandas as pd
import matplotlib.pyplot as plt

# 创建示例DataFrame
data = {
    'Month': ['Jan', 'Feb', 'Mar', 'Apr', 'May', 'Jun'],
    'Sales': [1000, 1200, 1500, 1300, 1800, 2000],
    'Visitors': [500, 600, 750, 800, 900, 1000]
}
df = pd.DataFrame(data)

# 添加一个季度列
df['Quarter'] = ['Q1', 'Q1', 'Q1', 'Q2', 'Q2', 'Q2']

fig, ax = plt.subplots(figsize=(12, 6))
df.plot(kind='bar', x='Month', y='Sales', ax=ax)

plt.title('Monthly Sales with Quarters - how2matplotlib.com')
plt.xlabel('Month')
plt.ylabel('Sales')

# 添加第二层X轴标签(季度)
ax2 = ax.twiny()
new_tick_locations = np.array([1, 4])
ax2.set_xticks(new_tick_locations)
ax2.set_xticklabels(['Q1', 'Q2'])
ax2.set_xlim(ax.get_xlim())

plt.tight_layout()
plt.show()
在这个例子中,我们使用了两个X轴。主X轴显示月份,而次X轴(通过ax.twiny()创建)显示季度信息。这种方法可以在不增加图表复杂性的情况下展示额外的分类信息。
16. 处理长文本X轴标签
当X轴标签文本较长时,可能会导致标签重叠。以下是一种处理长文本标签的方法:
import pandas as pd
import matplotlib.pyplot as plt

# 创建示例DataFrame
data = {
    'Month': ['Jan', 'Feb', 'Mar', 'Apr', 'May', 'Jun'],
    'Sales': [1000, 1200, 1500, 1300, 1800, 2000],
    'Visitors': [500, 600, 750, 800, 900, 1000]
}
df = pd.DataFrame(data)

# 创建包含长文本标签的DataFrame
long_label_data = {
    'Product': ['Premium Widget A', 'Deluxe Gadget B', 'Super Gizmo C', 'Ultra Device D', 'Mega Tool E'],
    'Sales': [1000, 1200, 1500, 1300, 1800]
}
long_label_df = pd.DataFrame(long_label_data)

plt.figure(figsize=(12, 8))
bars = plt.bar(range(len(long_label_df)), long_label_df['Sales'])

plt.title('Product Sales - how2matplotlib.com')
plt.ylabel('Sales')

# 设置X轴标签
plt.xticks(range(len(long_label_df)), long_label_df['Product'], rotation=45, ha='right')

# 在条形上方添加标签
for i, bar in enumerate(bars):
    plt.text(bar.get_x() + bar.get_width()/2, bar.get_height(),
             long_label_df['Product'][i],
             ha='center', va='bottom', rotation=90)

plt.tight_layout()
plt.show()
Output:
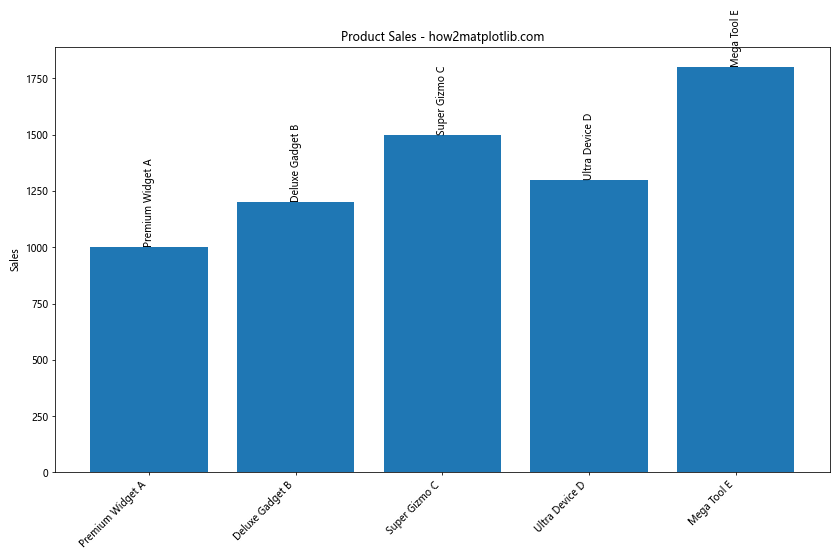
在这个例子中,我们将X轴标签旋转45度以避免重叠。此外,我们还在每个条形上方垂直添加了完整的产品名称,以确保所有信息都清晰可见。
17. 使用日期范围作为X轴标签
当处理跨越一段时间的数据时,我们可能需要显示日期范围作为X轴标签:
import pandas as pd
import matplotlib.pyplot as plt

# 创建示例DataFrame
data = {
    'Month': ['Jan', 'Feb', 'Mar', 'Apr', 'May', 'Jun'],
    'Sales': [1000, 1200, 1500, 1300, 1800, 2000],
    'Visitors': [500, 600, 750, 800, 900, 1000]
}
df = pd.DataFrame(data)

# 创建包含日期范围的DataFrame
date_range_data = {
    'Start Date': pd.date_range(start='2023-01-01', periods=5, freq='W'),
    'End Date': pd.date_range(start='2023-01-07', periods=5, freq='W'),
    'Value': [100, 120, 110, 130, 140]
}
date_range_df = pd.DataFrame(date_range_data)

plt.figure(figsize=(12, 6))
plt.bar(range(len(date_range_df)), date_range_df['Value'])

plt.title('Weekly Data - how2matplotlib.com')
plt.ylabel('Value')

# 创建日期范围标签
date_labels = [f"{start.strftime('%m/%d')} - {end.strftime('%m/%d')}"
               for start, end in zip(date_range_df['Start Date'], date_range_df['End Date'])]

plt.xticks(range(len(date_range_df)), date_labels, rotation=45, ha='right')

plt.tight_layout()
plt.show()
Output:
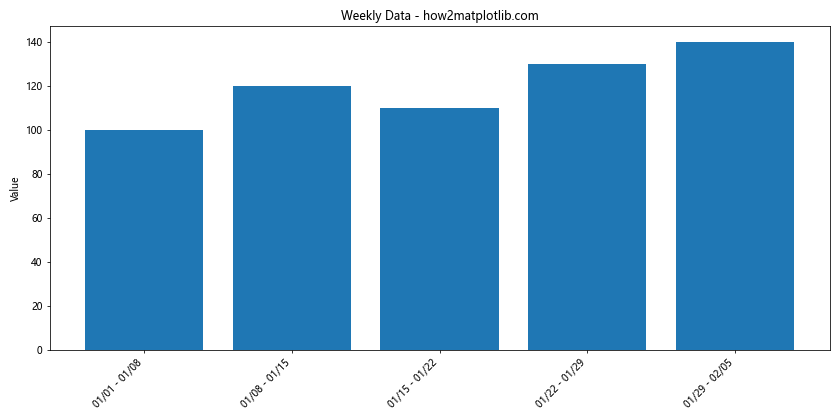
这个例子展示了如何为每周数据创建日期范围标签。我们使用了日期的开始和结束来创建每个标签,使用strftime方法格式化日期。
18. 使用图例代替X轴标签
在某些情况下,使用图例而不是X轴标签可能更有效:
import pandas as pd
import matplotlib.pyplot as plt

# 创建示例DataFrame
data = {
    'Month': ['Jan', 'Feb', 'Mar', 'Apr', 'May', 'Jun'],
    'Sales': [1000, 1200, 1500, 1300, 1800, 2000],
    'Visitors': [500, 600, 750, 800, 900, 1000]
}
df = pd.DataFrame(data)

# 创建多个数据系列
multi_series_data = {
    'Category': ['A', 'B', 'C', 'D', 'E'],
    'Series1': [10, 20, 15, 25, 30],
    'Series2': [15, 25, 20, 30, 35],
    'Series3': [5, 15, 10, 20, 25]
}
multi_series_df = pd.DataFrame(multi_series_data)

plt.figure(figsize=(12, 6))

width = 0.25  # 条形宽度
x = range(len(multi_series_df))

plt.bar([i - width for i in x], multi_series_df['Series1'], width, label='Series 1')
plt.bar(x, multi_series_df['Series2'], width, label='Series 2')
plt.bar([i + width for i in x], multi_series_df['Series3'], width, label='Series 3')

plt.title('Multi-Series Data Comparison - how2matplotlib.com')
plt.ylabel('Value')
plt.xticks(x, multi_series_df['Category'])

plt.legend()
plt.tight_layout()
plt.show()
Output:
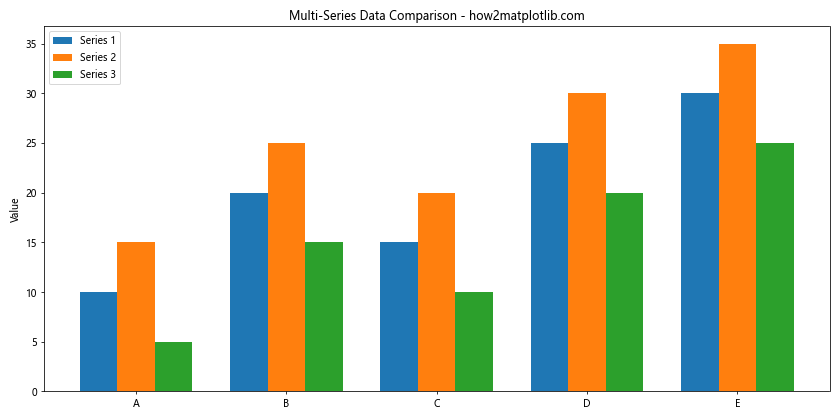
在这个例子中,我们创建了一个包含多个数据系列的分组条形图。我们使用图例来区分不同的数据系列,而X轴标签仅用于显示类别。
19. 使用词云作为特殊形式的X轴标签
虽然不是严格意义上的X轴标签,但词云可以作为一种特殊的可视化方式来展示分类数据的重要性:
from wordcloud import WordCloud
import pandas as pd
import matplotlib.pyplot as plt

# 创建示例DataFrame
data = {
    'Month': ['Jan', 'Feb', 'Mar', 'Apr', 'May', 'Jun'],
    'Sales': [1000, 1200, 1500, 1300, 1800, 2000],
    'Visitors': [500, 600, 750, 800, 900, 1000]
}
df = pd.DataFrame(data)

# 创建包含文本数据的DataFrame
text_data = {
    'Word': ['Python', 'Data', 'Analysis', 'Visualization', 'Pandas', 'Matplotlib'],
    'Frequency': [100, 80, 60, 50, 40, 30]
}
text_df = pd.DataFrame(text_data)

# 创建词频字典
word_freq = dict(zip(text_df['Word'], text_df['Frequency']))

# 生成词云
wordcloud = WordCloud(width=800, height=400, background_color='white').generate_from_frequencies(word_freq)

plt.figure(figsize=(10, 5))
plt.imshow(wordcloud, interpolation='bilinear')
plt.axis('off')
plt.title('Word Frequency Cloud - how2matplotlib.com')
plt.show()
这个例子展示了如何使用词云来可视化文本数据的频率。虽然这不是传统意义上的X轴标签,但它提供了一种直观的方式来展示分类数据的相对重要性。
20. 使用交互式工具增强X轴标签功能
虽然Matplotlib主要用于静态图表,但我们可以结合使用一些交互式工具来增强X轴标签的功能:
import matplotlib.pyplot as plt
from matplotlib.widgets import Slider

# 创建初始数据
x = range(10)
y = [1, 3, 2, 4, 3, 5, 4, 6, 5, 7]

fig, ax = plt.subplots(figsize=(10, 6))
line, = ax.plot(x, y)

plt.subplots_adjust(bottom=0.25)

# 创建一个用于缩放X轴的滑块
ax_slider = plt.axes([0.2, 0.1, 0.6, 0.03])
slider = Slider(ax_slider, 'Zoom', 0.1, 10, valinit=1)

def update(val):
    ax.set_xlim(0, 10/slider.val)
    fig.canvas.draw_idle()

slider.on_changed(update)

plt.title('Interactive X-axis Zoom - how2matplotlib.com')
plt.xlabel('X')
plt.ylabel('Y')
plt.show()
Output:
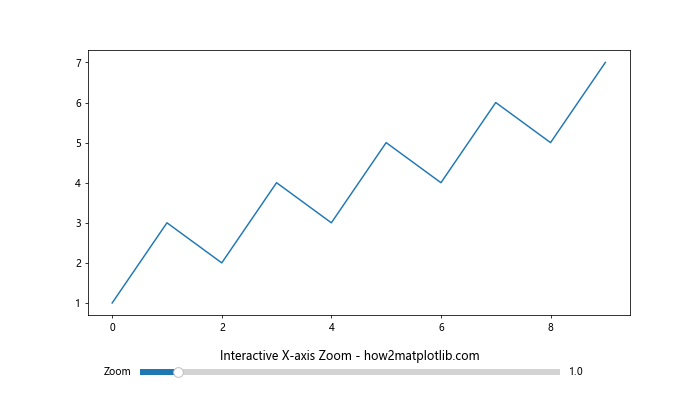
这个例子展示了如何使用Matplotlib的交互式工具(在这里是一个滑块)来动态调整X轴的缩放级别。这种方法特别适用于处理大量数据点时,允许用户自由探索数据的不同部分。
结论
在本文中,我们详细探讨了如何在Python Pandas中将DataFrame列值设置为X轴标签。我们介绍了多种方法和技巧,从基本的索引设置到高级的自定义标签和交互式可视化。这些技术可以帮助数据分析师和可视化专家更有效地展示数据,使图表更加清晰、信息丰富。
关键要点包括:
1. 使用DataFrame的索引或特定列作为X轴标签
2. 利用plt.xticks()函数自定义X轴标签
3. 处理日期类型的标签和大量数据点
4. 使用颜色编码和多层标签增强信息传递
5. 处理长文本标签和不连续数据
6. 利用Seaborn等库增强可视化效果
7. 使用交互式工具提高用户体验
通过掌握这些技巧,你将能够创建更加专业、有洞察力的数据可视化,更好地传达数据中的重要信息。记住,选择合适的方法取决于你的具体数据和目标受众。不断实践和实验将帮助你找到最适合你需求的可视化方式。
 极客笔记
极客笔记