Matplotlib绘制双虚线并设置标记:全面指南
参考:How to plot two dotted lines and set marker using Matplotlib
Matplotlib是Python中最流行的数据可视化库之一,它提供了丰富的绘图功能,包括绘制各种类型的线条和设置标记。本文将详细介绍如何使用Matplotlib绘制两条虚线并设置标记,涵盖从基础到高级的多个方面,帮助您掌握这一重要技能。
1. Matplotlib基础
在开始绘制双虚线和设置标记之前,我们需要先了解Matplotlib的基础知识。
1.1 导入Matplotlib
首先,我们需要导入Matplotlib库。通常,我们会使用以下方式导入:
import matplotlib.pyplot as plt
import numpy as np

# 创建数据
x = np.linspace(0, 10, 100)
y1 = np.sin(x)
y2 = np.cos(x)

# 创建图形和坐标轴
fig, ax = plt.subplots()

# 绘制两条虚线
ax.plot(x, y1, linestyle='--', label='Sin')
ax.plot(x, y2, linestyle=':', label='Cos')

# 添加标题和标签
ax.set_title('How to plot two dotted lines - how2matplotlib.com')
ax.set_xlabel('X axis')
ax.set_ylabel('Y axis')

# 添加图例
ax.legend()

# 显示图形
plt.show()
Output:
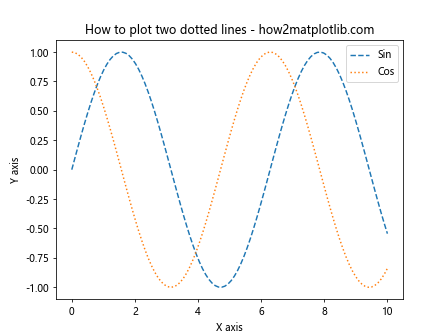
这个示例展示了如何创建一个基本的图形,包含两条不同样式的虚线。linestyle='--'和linestyle=':'分别创建了虚线和点线。
1.2 设置图形大小
我们可以通过figsize参数来设置图形的大小:
import matplotlib.pyplot as plt
import numpy as np

# 创建数据
x = np.linspace(0, 10, 100)
y1 = np.sin(x)
y2 = np.cos(x)

# 创建指定大小的图形
fig, ax = plt.subplots(figsize=(10, 6))

# 绘制两条虚线
ax.plot(x, y1, linestyle='--', label='Sin')
ax.plot(x, y2, linestyle=':', label='Cos')

ax.set_title('Customized figure size - how2matplotlib.com')
ax.set_xlabel('X axis')
ax.set_ylabel('Y axis')
ax.legend()

plt.show()
Output:
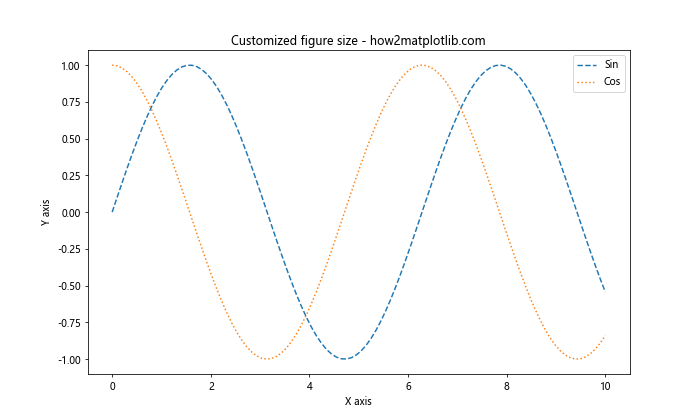
在这个例子中,我们将图形大小设置为10英寸宽,6英寸高。
2. 绘制双虚线
现在,让我们深入探讨如何绘制两条虚线。
2.1 不同的虚线样式
Matplotlib提供了多种虚线样式:
import matplotlib.pyplot as plt
import numpy as np

x = np.linspace(0, 10, 100)
y = np.sin(x)

fig, ax = plt.subplots(figsize=(10, 6))

# 不同的虚线样式
ax.plot(x, y, linestyle='--', label='Dashed')
ax.plot(x, y+0.5, linestyle=':', label='Dotted')
ax.plot(x, y-0.5, linestyle='-.', label='Dash-dot')

ax.set_title('Different dotted line styles - how2matplotlib.com')
ax.set_xlabel('X axis')
ax.set_ylabel('Y axis')
ax.legend()

plt.show()
Output:
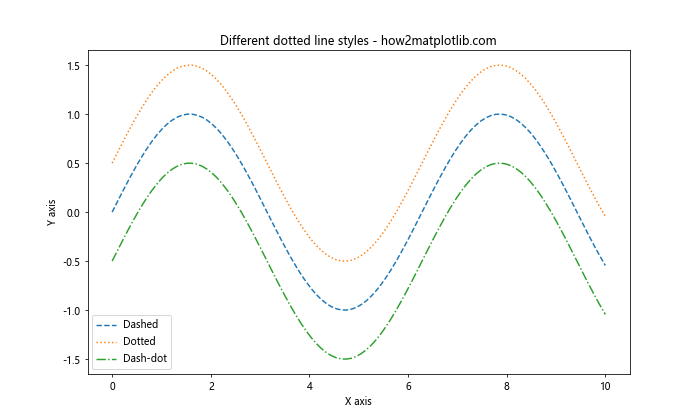
这个例子展示了三种不同的虚线样式:虚线(dashed)、点线(dotted)和点划线(dash-dot)。
2.2 自定义虚线样式
我们还可以通过设置虚线的间隔来自定义虚线样式:
import matplotlib.pyplot as plt
import numpy as np

x = np.linspace(0, 10, 100)
y = np.sin(x)

fig, ax = plt.subplots(figsize=(10, 6))

# 自定义虚线样式
ax.plot(x, y, linestyle=(0, (5, 5)), label='5-5')
ax.plot(x, y+0.5, linestyle=(0, (5, 1)), label='5-1')
ax.plot(x, y-0.5, linestyle=(0, (1, 1, 3, 1)), label='1-1-3-1')

ax.set_title('Custom dotted line styles - how2matplotlib.com')
ax.set_xlabel('X axis')
ax.set_ylabel('Y axis')
ax.legend()

plt.show()
Output:
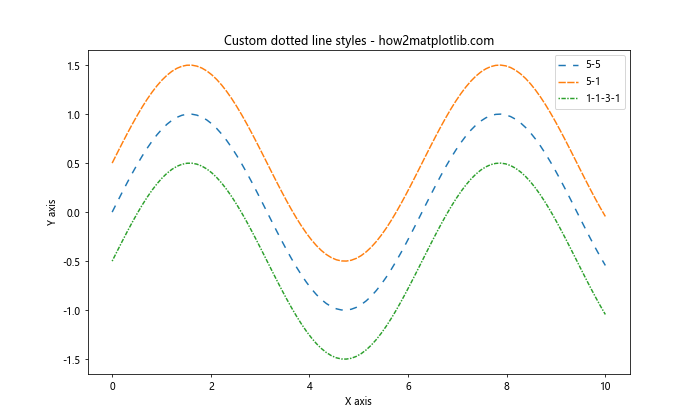
在这个例子中,我们使用元组来定义虚线样式。元组中的数字表示线段和间隔的长度(以点为单位)。
3. 设置标记
标记是用于突出显示数据点的符号。Matplotlib提供了多种标记样式。
3.1 基本标记
以下是一些常用的标记样式:
import matplotlib.pyplot as plt
import numpy as np

x = np.linspace(0, 10, 10)
y = np.sin(x)

fig, ax = plt.subplots(figsize=(10, 6))

# 不同的标记样式
ax.plot(x, y, linestyle='--', marker='o', label='Circle')
ax.plot(x, y+0.5, linestyle='--', marker='s', label='Square')
ax.plot(x, y-0.5, linestyle='--', marker='^', label='Triangle')

ax.set_title('Different marker styles - how2matplotlib.com')
ax.set_xlabel('X axis')
ax.set_ylabel('Y axis')
ax.legend()

plt.show()
Output:
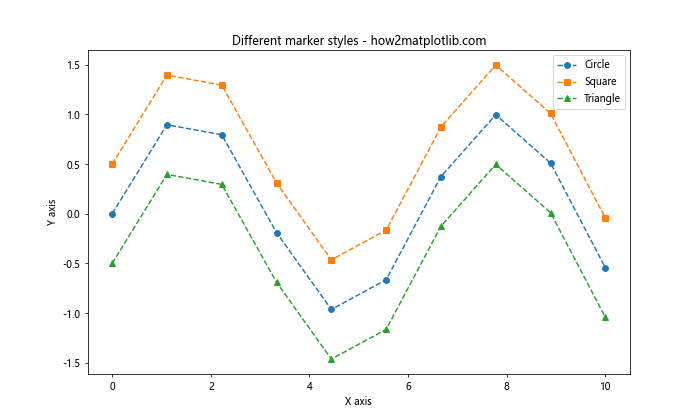
这个例子展示了三种不同的标记:圆形(’o’)、正方形(’s’)和三角形(’^’)。
3.2 自定义标记大小和颜色
我们可以通过markersize和markerfacecolor参数来自定义标记的大小和颜色:
import matplotlib.pyplot as plt
import numpy as np

x = np.linspace(0, 10, 10)
y = np.sin(x)

fig, ax = plt.subplots(figsize=(10, 6))

# 自定义标记大小和颜色
ax.plot(x, y, linestyle='--', marker='o', markersize=12, markerfacecolor='red', label='Large red')
ax.plot(x, y+0.5, linestyle='--', marker='s', markersize=8, markerfacecolor='green', label='Medium green')
ax.plot(x, y-0.5, linestyle='--', marker='^', markersize=6, markerfacecolor='blue', label='Small blue')

ax.set_title('Custom marker size and color - how2matplotlib.com')
ax.set_xlabel('X axis')
ax.set_ylabel('Y axis')
ax.legend()

plt.show()
Output:
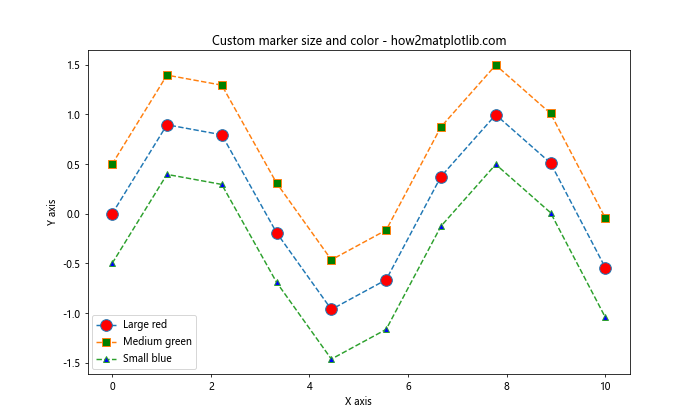
这个例子展示了如何设置不同大小和颜色的标记。
4. 结合虚线和标记
现在,让我们将虚线和标记结合起来,创建更复杂的图形。
4.1 基本组合
以下是一个基本的虚线和标记组合示例:
import matplotlib.pyplot as plt
import numpy as np

x = np.linspace(0, 10, 20)
y1 = np.sin(x)
y2 = np.cos(x)

fig, ax = plt.subplots(figsize=(10, 6))

# 组合虚线和标记
ax.plot(x, y1, linestyle='--', marker='o', label='Sin')
ax.plot(x, y2, linestyle=':', marker='s', label='Cos')

ax.set_title('Combining dotted lines and markers - how2matplotlib.com')
ax.set_xlabel('X axis')
ax.set_ylabel('Y axis')
ax.legend()

plt.show()
Output:
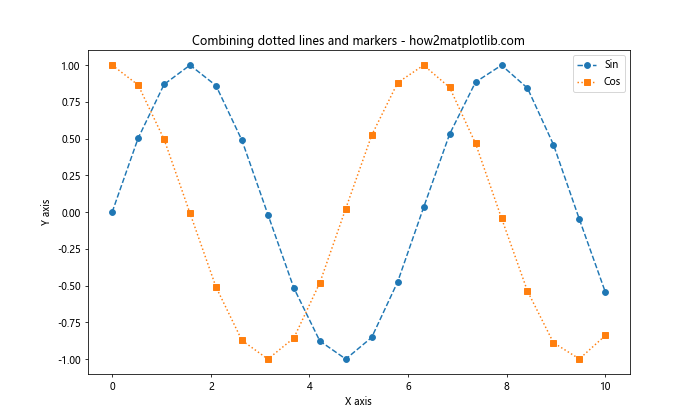
这个例子展示了如何将虚线和标记结合起来,创建更具信息量的图形。
4.2 高级组合
我们可以进一步自定义线条和标记的属性:
import matplotlib.pyplot as plt
import numpy as np

x = np.linspace(0, 10, 20)
y1 = np.sin(x)
y2 = np.cos(x)

fig, ax = plt.subplots(figsize=(10, 6))

# 高级组合
ax.plot(x, y1, linestyle='--', linewidth=2, color='red',
        marker='o', markersize=8, markerfacecolor='white', markeredgecolor='red',
        label='Sin')
ax.plot(x, y2, linestyle=':', linewidth=2, color='blue',
        marker='s', markersize=8, markerfacecolor='white', markeredgecolor='blue',
        label='Cos')

ax.set_title('Advanced combination of lines and markers - how2matplotlib.com')
ax.set_xlabel('X axis')
ax.set_ylabel('Y axis')
ax.legend()

plt.show()
Output:
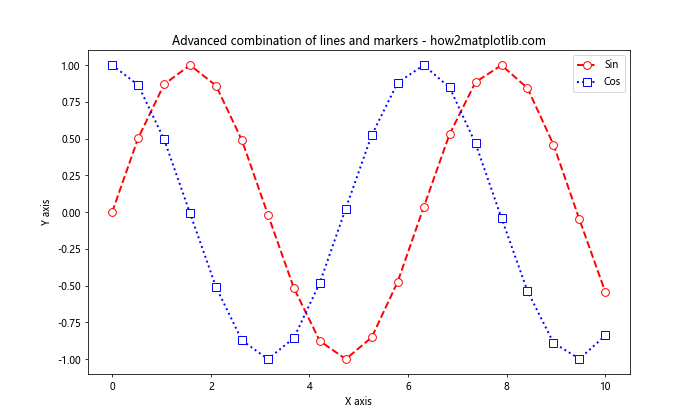
在这个例子中,我们自定义了线条的宽度和颜色,以及标记的大小、填充颜色和边缘颜色。
5. 添加网格和背景
为了提高图形的可读性,我们可以添加网格和自定义背景。
5.1 添加网格
使用grid()方法可以轻松添加网格:
import matplotlib.pyplot as plt
import numpy as np

x = np.linspace(0, 10, 20)
y1 = np.sin(x)
y2 = np.cos(x)

fig, ax = plt.subplots(figsize=(10, 6))

ax.plot(x, y1, linestyle='--', marker='o', label='Sin')
ax.plot(x, y2, linestyle=':', marker='s', label='Cos')

# 添加网格
ax.grid(True, linestyle=':', alpha=0.7)

ax.set_title('Adding grid to the plot - how2matplotlib.com')
ax.set_xlabel('X axis')
ax.set_ylabel('Y axis')
ax.legend()

plt.show()
Output:
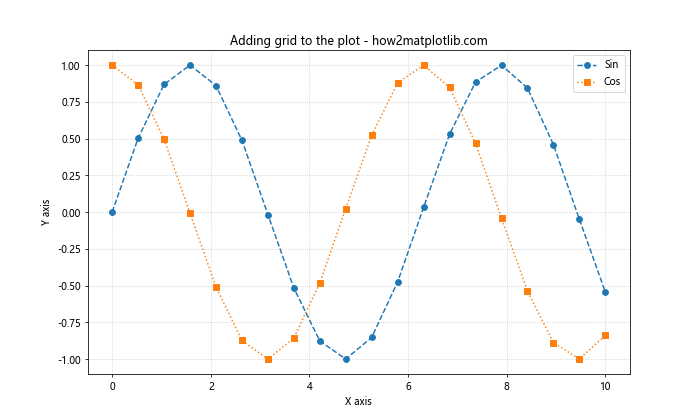
这个例子展示了如何添加网格并设置其样式和透明度。
5.2 自定义背景
我们可以通过设置facecolor参数来自定义图形的背景颜色:
import matplotlib.pyplot as plt
import numpy as np

x = np.linspace(0, 10, 20)
y1 = np.sin(x)
y2 = np.cos(x)

fig, ax = plt.subplots(figsize=(10, 6), facecolor='#f0f0f0')

ax.plot(x, y1, linestyle='--', marker='o', label='Sin')
ax.plot(x, y2, linestyle=':', marker='s', label='Cos')

ax.set_facecolor('#e0e0e0')

ax.set_title('Custom background color - how2matplotlib.com')
ax.set_xlabel('X axis')
ax.set_ylabel('Y axis')
ax.legend()

plt.show()
Output:
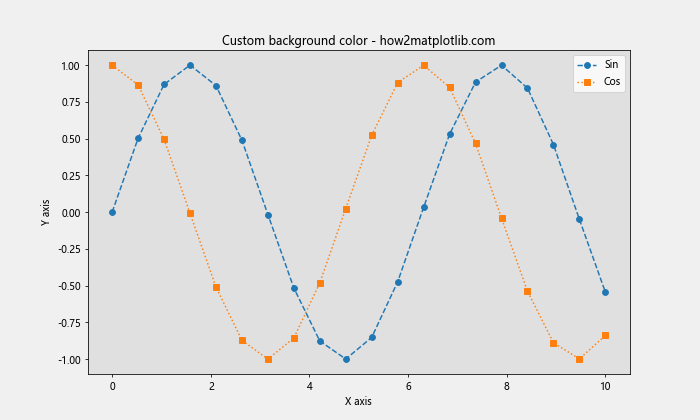
这个例子展示了如何设置图形和坐标轴的背景颜色。
6. 添加注释和文本
添加注释和文本可以帮助解释图形中的重要特征。
6.1 添加文本
使用text()方法可以在图形上添加文本:
import matplotlib.pyplot as plt
import numpy as np

x = np.linspace(0, 10, 20)
y1 = np.sin(x)
y2 = np.cos(x)

fig, ax = plt.subplots(figsize=(10, 6))

ax.plot(x, y1, linestyle='--', marker='o', label='Sin')
ax.plot(x, y2, linestyle=':', marker='s', label='Cos')

# 添加文本
ax.text(5, 0.5, 'Important point', fontsize=12, ha='center', va='center')

ax.set_title('Adding text to the plot - how2matplotlib.com')
ax.set_xlabel('X axis')
ax.set_ylabel('Y axis')
ax.legend()

plt.show()
Output:
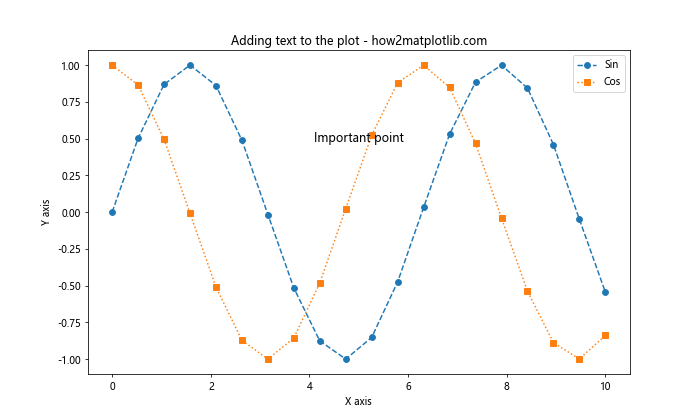
这个例子展示了如何在图形上添加文本并设置其位置和样式。
6.2 添加注释
使用annotate()方法可以添加带箭头的注释:
import matplotlib.pyplot as plt
import numpy as np

x = np.linspace(0, 10, 20)
y1 = np.sin(x)
y2 = np.cos(x)

fig, ax = plt.subplots(figsize=(10, 6))

ax.plot(x, y1, linestyle='--', marker='o', label='Sin')
ax.plot(x, y2, linestyle=':', marker='s', label='Cos')

# 添加注释
ax.annotate('Peak', xy=(1.5, 1), xytext=(3, 1.5),
            arrowprops=dict(facecolor='black', shrink=0.05))

ax.set_title('Adding annotations to the plot - how2matplotlib.com')
ax.set_xlabel('X axis')
ax.set_ylabel('Y axis')
ax.legend()

plt.show()
Output:
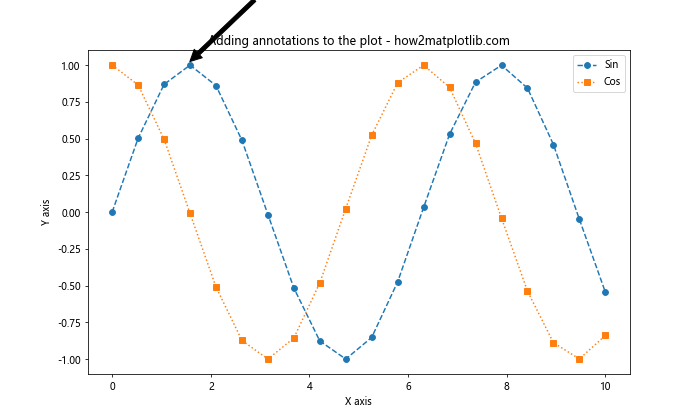
这个例子展示了如何添加带箭头的注释并自定义其样式。
7. 多子图
有时我们需要在一个图形中绘制多个子图。
7.1 创建多子图
使用subplots()方法可以创建多个子图:
import matplotlib.pyplot as plt
import numpy as np

x = np.linspace(0, 10, 20)
y1 = np.sin(x)
y2 = np.cos(x)

fig, (ax1, ax2) = plt.subplots(2, 1, figsize=(10, 8))

# 第一个子图
ax1.plot(x, y1, linestyle='--', marker='o', label='Sin')
ax1.set_title('Sine wave - how2matplotlib.com')
ax1.legend()

# 第二个子图
ax2.plot(x, y2, linestyle=':', marker='s', label='Cos')
ax2.set_title('Cosine wave - how2matplotlib.com')
ax2.legend()

plt.tight_layout()
plt.show()
Output:
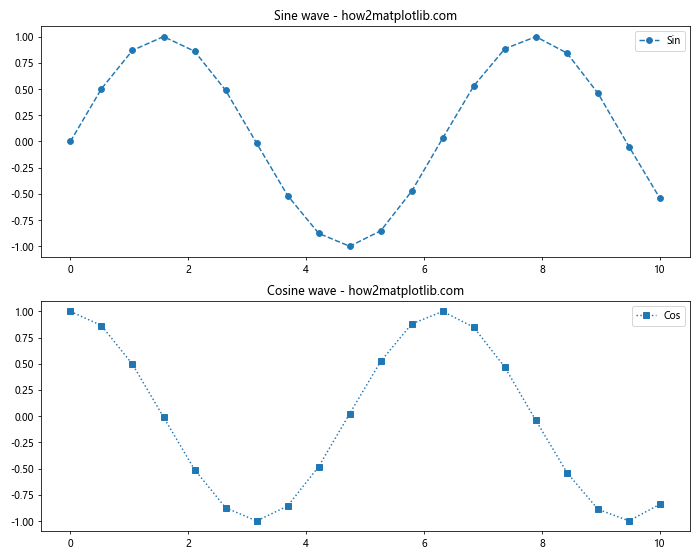
这个例子展示了如何创建两个垂直排列的子图。### 7.2 自定义子图布局
我们可以使用gridspec模块来创建更复杂的子图布局:
import matplotlib.pyplot as plt
import matplotlib.gridspec as gridspec
import numpy as np

x = np.linspace(0, 10, 20)
y1 = np.sin(x)
y2 = np.cos(x)

fig = plt.figure(figsize=(12, 8))
gs = gridspec.GridSpec(2, 2)

ax1 = fig.add_subplot(gs[0, 0])
ax2 = fig.add_subplot(gs[0, 1])
ax3 = fig.add_subplot(gs[1, :])

# 第一个子图
ax1.plot(x, y1, linestyle='--', marker='o')
ax1.set_title('Sine wave - how2matplotlib.com')

# 第二个子图
ax2.plot(x, y2, linestyle=':', marker='s')
ax2.set_title('Cosine wave - how2matplotlib.com')

# 第三个子图
ax3.plot(x, y1, linestyle='--', marker='o', label='Sin')
ax3.plot(x, y2, linestyle=':', marker='s', label='Cos')
ax3.set_title('Combined waves - how2matplotlib.com')
ax3.legend()

plt.tight_layout()
plt.show()
Output:
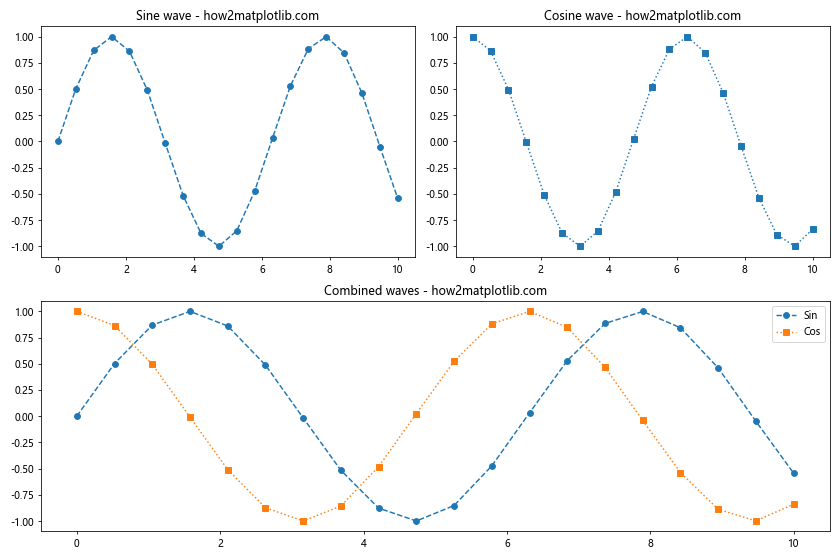
这个例子展示了如何创建一个更复杂的子图布局,其中两个小图在上方,一个大图在下方。
8. 自定义颜色和样式
Matplotlib提供了丰富的颜色和样式选项,让我们能够创建更具吸引力的图形。
8.1 使用颜色映射
颜色映射可以用来创建渐变色效果:
import matplotlib.pyplot as plt
import numpy as np

x = np.linspace(0, 10, 20)
y1 = np.sin(x)
y2 = np.cos(x)

fig, ax = plt.subplots(figsize=(10, 6))

# 使用颜色映射
colors = plt.cm.viridis(np.linspace(0, 1, len(x)))

for i in range(len(x)-1):
    ax.plot(x[i:i+2], y1[i:i+2], linestyle='--', color=colors[i])
    ax.plot(x[i:i+2], y2[i:i+2], linestyle=':', color=colors[i])

ax.set_title('Using color maps - how2matplotlib.com')
ax.set_xlabel('X axis')
ax.set_ylabel('Y axis')

plt.show()
Output:
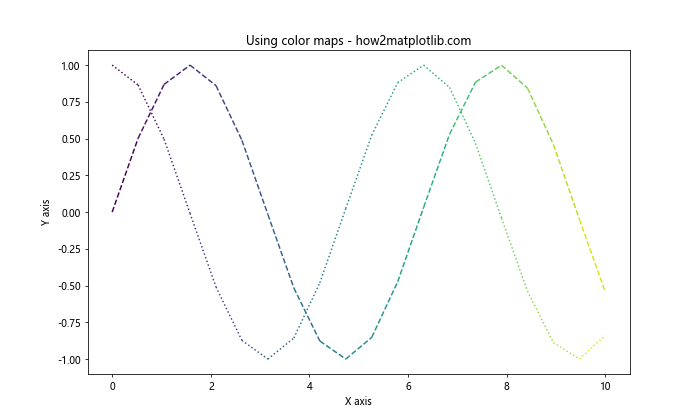
这个例子展示了如何使用颜色映射来创建渐变色效果的线条。
8.2 自定义线条样式
我们可以通过设置linestyle参数来自定义线条样式:
import matplotlib.pyplot as plt
import numpy as np

x = np.linspace(0, 10, 100)
y1 = np.sin(x)
y2 = np.cos(x)

fig, ax = plt.subplots(figsize=(10, 6))

# 自定义线条样式
ax.plot(x, y1, linestyle=(0, (5, 5)), label='Sin')
ax.plot(x, y2, linestyle=(0, (3, 5, 1, 5)), label='Cos')

ax.set_title('Custom line styles - how2matplotlib.com')
ax.set_xlabel('X axis')
ax.set_ylabel('Y axis')
ax.legend()

plt.show()
Output:
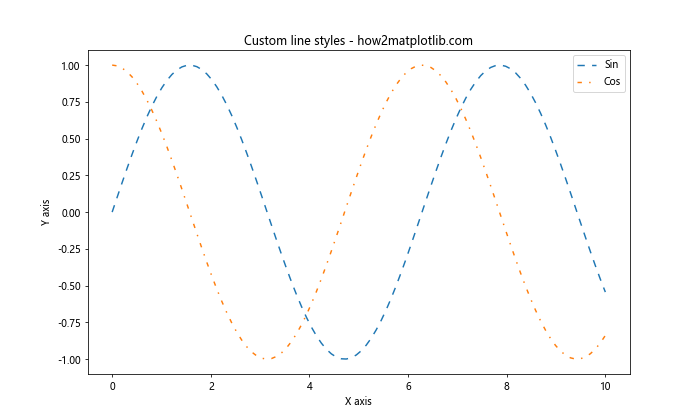
这个例子展示了如何使用元组来定义自定义的线条样式。
9. 保存图形
将创建的图形保存为文件是一个常见的需求。
9.1 保存为不同格式
Matplotlib支持多种图形格式:
import matplotlib.pyplot as plt
import numpy as np

x = np.linspace(0, 10, 100)
y1 = np.sin(x)
y2 = np.cos(x)

fig, ax = plt.subplots(figsize=(10, 6))

ax.plot(x, y1, linestyle='--', marker='o', label='Sin')
ax.plot(x, y2, linestyle=':', marker='s', label='Cos')

ax.set_title('Saving plots in different formats - how2matplotlib.com')
ax.set_xlabel('X axis')
ax.set_ylabel('Y axis')
ax.legend()

# 保存为不同格式
plt.savefig('plot.png')
plt.savefig('plot.pdf')
plt.savefig('plot.svg')

plt.show()
Output:
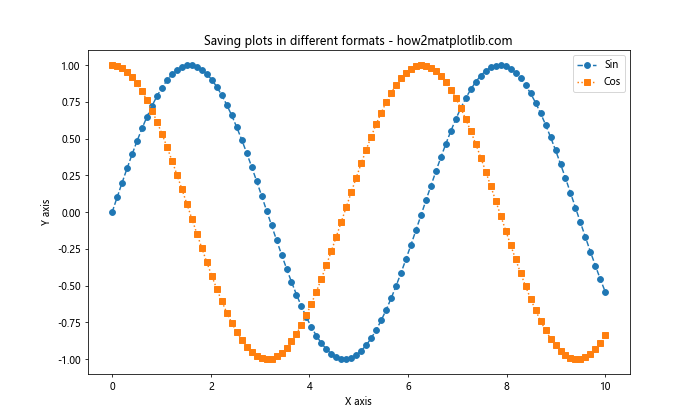
这个例子展示了如何将同一个图形保存为PNG、PDF和SVG格式。
9.2 设置保存参数
我们可以通过设置dpi和bbox_inches参数来控制保存图形的质量和裁剪:
import matplotlib.pyplot as plt
import numpy as np

x = np.linspace(0, 10, 100)
y1 = np.sin(x)
y2 = np.cos(x)

fig, ax = plt.subplots(figsize=(10, 6))

ax.plot(x, y1, linestyle='--', marker='o', label='Sin')
ax.plot(x, y2, linestyle=':', marker='s', label='Cos')

ax.set_title('High quality plot saving - how2matplotlib.com')
ax.set_xlabel('X axis')
ax.set_ylabel('Y axis')
ax.legend()

# 设置保存参数
plt.savefig('high_quality_plot.png', dpi=300, bbox_inches='tight')

plt.show()
Output:
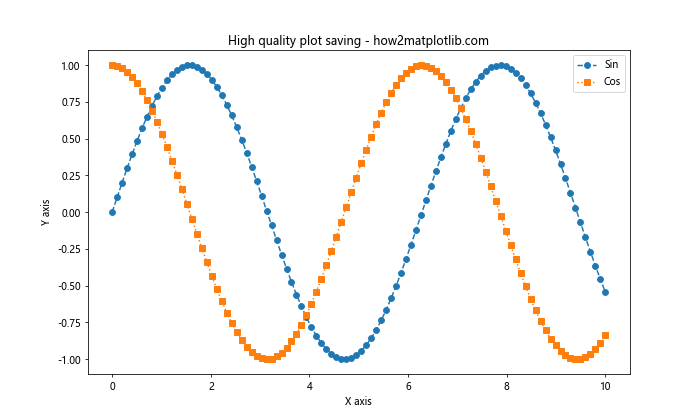
这个例子展示了如何保存高质量的图形,设置DPI为300,并使用bbox_inches='tight'来自动裁剪图形。
10. 动画效果
Matplotlib还支持创建简单的动画效果。
10.1 创建基本动画
使用animation模块可以创建简单的动画:
import matplotlib.pyplot as plt
import matplotlib.animation as animation
import numpy as np

fig, ax = plt.subplots(figsize=(10, 6))

x = np.linspace(0, 2*np.pi, 100)
line, = ax.plot(x, np.sin(x), linestyle='--', marker='o')

def animate(i):
    line.set_ydata(np.sin(x + i/10))
    return line,

ani = animation.FuncAnimation(fig, animate, frames=100, interval=50, blit=True)

ax.set_title('Basic animation - how2matplotlib.com')
ax.set_xlabel('X axis')
ax.set_ylabel('Y axis')

plt.show()
Output:
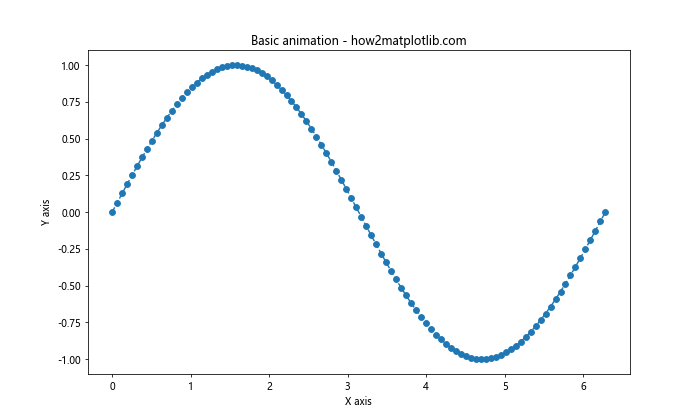
这个例子创建了一个简单的正弦波动画。
结论
本文详细介绍了如何使用Matplotlib绘制双虚线并设置标记,涵盖了从基础到高级的多个方面。我们学习了如何创建基本图形、自定义线条和标记样式、添加网格和背景、插入注释和文本、创建多子图、使用颜色映射、保存图形以及创建简单的动画效果。
Matplotlib是一个功能强大且灵活的库,可以创建各种复杂的数据可视化。通过实践和探索,您可以掌握更多高级技巧,创建出更加精美和信息丰富的图形。记住,好的数据可视化不仅仅是技术,还需要考虑数据的特性和受众的需求。希望这篇文章能够帮助您更好地使用Matplotlib,创建出令人印象深刻的数据可视化作品。
 极客笔记
极客笔记