Matplotlib中如何调整包含子图的图形大小
参考:How to Change the Figure Size with Subplots in Matplotlib
Matplotlib是Python中最流行的数据可视化库之一,它提供了强大而灵活的绘图功能。在使用Matplotlib创建复杂的可视化时,我们经常需要在一个图形中包含多个子图。同时,调整整个图形的大小以及子图的布局也是常见的需求。本文将详细介绍如何在Matplotlib中更改包含子图的图形大小,并提供多个实用的示例代码。
1. 理解Matplotlib中的图形和子图
在深入探讨如何调整图形大小之前,我们需要先了解Matplotlib中的图形(Figure)和子图(Subplot)的概念。
1.1 图形(Figure)
图形是Matplotlib中最顶层的容器,它包含了所有的绘图元素。可以将图形想象成一个画布,我们在这个画布上绘制各种图表。
1.2 子图(Subplot)
子图是图形中的一个绘图区域。一个图形可以包含一个或多个子图,每个子图可以绘制不同的图表。
1.3 示例:创建包含子图的图形
让我们从一个简单的例子开始,创建一个包含两个子图的图形:
import matplotlib.pyplot as plt

# 创建一个包含两个子图的图形
fig, (ax1, ax2) = plt.subplots(1, 2)

# 在第一个子图中绘制数据
ax1.plot([1, 2, 3, 4], [1, 4, 2, 3], label='Data 1')
ax1.set_title('Subplot 1 - how2matplotlib.com')

# 在第二个子图中绘制数据
ax2.plot([1, 2, 3, 4], [4, 3, 2, 1], label='Data 2')
ax2.set_title('Subplot 2 - how2matplotlib.com')

plt.show()
Output:
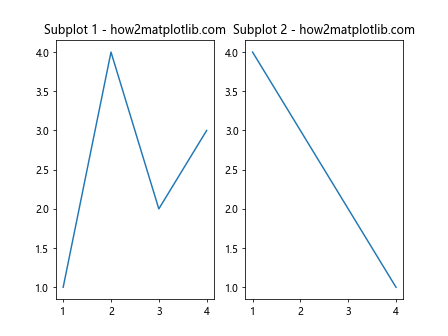
在这个例子中,我们使用plt.subplots(1, 2)创建了一个包含两个并排的子图的图形。然后,我们在每个子图中绘制了不同的数据。
2. 调整图形大小的基本方法
调整图形大小的最基本方法是在创建图形时指定figsize参数。
2.1 使用figsize参数
figsize参数接受一个元组,表示图形的宽度和高度,单位为英寸。
import matplotlib.pyplot as plt

# 创建一个10英寸宽、5英寸高的图形,包含两个子图
fig, (ax1, ax2) = plt.subplots(1, 2, figsize=(10, 5))

ax1.plot([1, 2, 3, 4], [1, 4, 2, 3])
ax1.set_title('Subplot 1 - how2matplotlib.com')

ax2.plot([1, 2, 3, 4], [4, 3, 2, 1])
ax2.set_title('Subplot 2 - how2matplotlib.com')

plt.show()
Output:

在这个例子中,我们创建了一个10英寸宽、5英寸高的图形,其中包含两个子图。
2.2 使用set_size_inches()方法
如果你想在创建图形后调整其大小,可以使用set_size_inches()方法:
import matplotlib.pyplot as plt

fig, (ax1, ax2) = plt.subplots(1, 2)

# 调整图形大小为12英寸宽、6英寸高
fig.set_size_inches(12, 6)

ax1.plot([1, 2, 3, 4], [1, 4, 2, 3])
ax1.set_title('Subplot 1 - how2matplotlib.com')

ax2.plot([1, 2, 3, 4], [4, 3, 2, 1])
ax2.set_title('Subplot 2 - how2matplotlib.com')

plt.show()
Output:
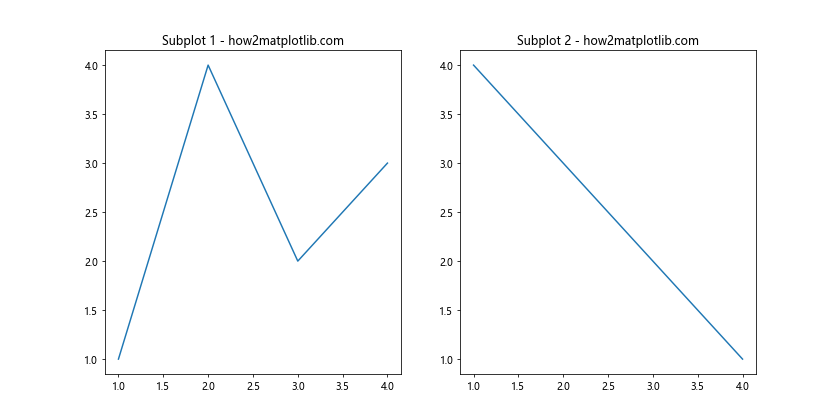
这个方法允许你在创建图形后动态调整其大小。
3. 调整子图布局
当调整图形大小时,你可能还需要调整子图的布局以确保它们能够正确显示。
3.1 使用tight_layout()
tight_layout()函数可以自动调整子图的位置,以避免重叠和溢出:
import matplotlib.pyplot as plt

fig, (ax1, ax2) = plt.subplots(1, 2, figsize=(10, 5))

ax1.plot([1, 2, 3, 4], [1, 4, 2, 3])
ax1.set_title('Subplot 1 - how2matplotlib.com')

ax2.plot([1, 2, 3, 4], [4, 3, 2, 1])
ax2.set_title('Subplot 2 - how2matplotlib.com')

plt.tight_layout()
plt.show()
Output:
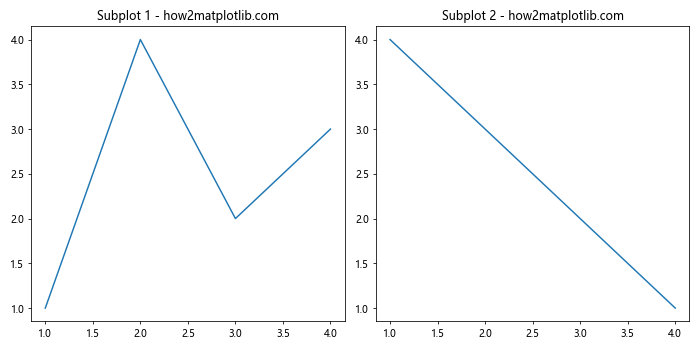
tight_layout()会自动调整子图之间的间距和边距,使得标题和轴标签不会重叠。
3.2 使用subplots_adjust()
如果你需要更精细地控制子图的布局,可以使用subplots_adjust()函数:
import matplotlib.pyplot as plt

fig, (ax1, ax2) = plt.subplots(1, 2, figsize=(12, 6))

ax1.plot([1, 2, 3, 4], [1, 4, 2, 3])
ax1.set_title('Subplot 1 - how2matplotlib.com')

ax2.plot([1, 2, 3, 4], [4, 3, 2, 1])
ax2.set_title('Subplot 2 - how2matplotlib.com')

# 调整子图之间的间距和边距
plt.subplots_adjust(left=0.1, right=0.9, top=0.9, bottom=0.1, wspace=0.4, hspace=0.4)

plt.show()
Output:
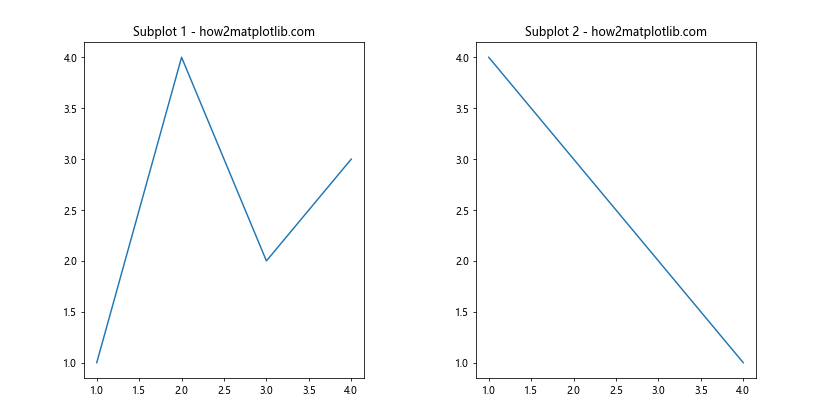
在这个例子中,我们使用subplots_adjust()函数调整了子图的位置和间距。left、right、top和bottom参数控制图形的边距,wspace和hspace控制子图之间的水平和垂直间距。
4. 创建不同布局的子图
Matplotlib允许你创建各种不同布局的子图,这些布局可能需要不同的图形大小调整策略。
4.1 网格布局
创建网格布局的子图:
import matplotlib.pyplot as plt

fig, axs = plt.subplots(2, 2, figsize=(10, 10))

axs[0, 0].plot([1, 2, 3, 4], [1, 4, 2, 3])
axs[0, 0].set_title('Subplot 1 - how2matplotlib.com')

axs[0, 1].plot([1, 2, 3, 4], [4, 3, 2, 1])
axs[0, 1].set_title('Subplot 2 - how2matplotlib.com')

axs[1, 0].plot([1, 2, 3, 4], [2, 3, 4, 1])
axs[1, 0].set_title('Subplot 3 - how2matplotlib.com')

axs[1, 1].plot([1, 2, 3, 4], [3, 1, 4, 2])
axs[1, 1].set_title('Subplot 4 - how2matplotlib.com')

plt.tight_layout()
plt.show()
Output:
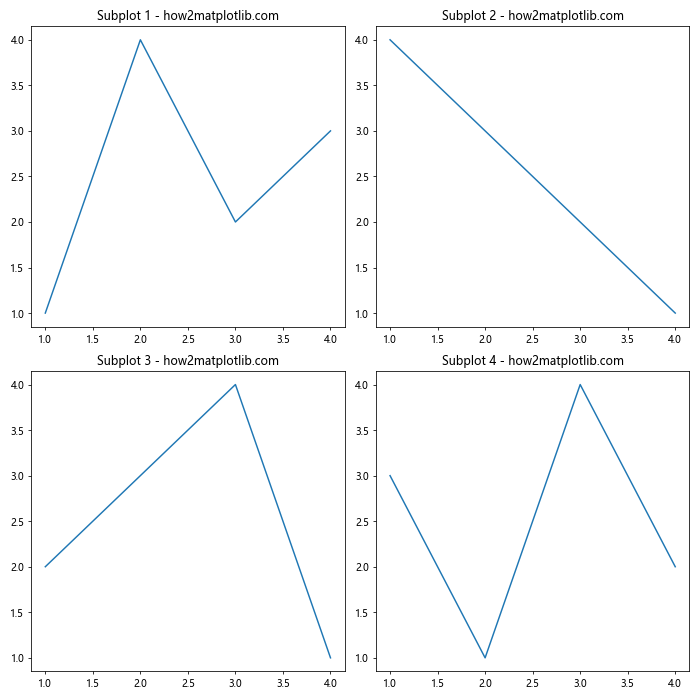
这个例子创建了一个2×2的网格布局,包含四个子图。
4.2 不规则布局
创建不规则布局的子图:
import matplotlib.pyplot as plt

fig = plt.figure(figsize=(12, 8))

ax1 = fig.add_subplot(221)  # 2行2列的第1个
ax2 = fig.add_subplot(222)  # 2行2列的第2个
ax3 = fig.add_subplot(212)  # 2行1列的第2个

ax1.plot([1, 2, 3, 4], [1, 4, 2, 3])
ax1.set_title('Subplot 1 - how2matplotlib.com')

ax2.plot([1, 2, 3, 4], [4, 3, 2, 1])
ax2.set_title('Subplot 2 - how2matplotlib.com')

ax3.plot([1, 2, 3, 4], [2, 3, 4, 1])
ax3.set_title('Subplot 3 - how2matplotlib.com')

plt.tight_layout()
plt.show()
Output:
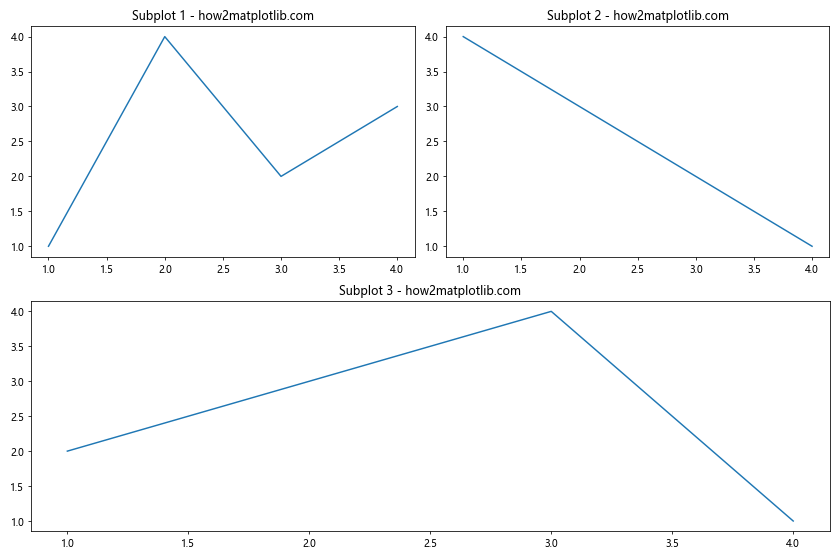
这个例子创建了一个不规则的布局,上面是两个小的子图,下面是一个大的子图。
5. 调整子图的相对大小
有时,你可能希望某些子图比其他子图大或小。Matplotlib提供了几种方法来实现这一点。
5.1 使用gridspec
gridspec模块允许你创建复杂的子图布局:
import matplotlib.pyplot as plt
import matplotlib.gridspec as gridspec

fig = plt.figure(figsize=(12, 8))
gs = gridspec.GridSpec(2, 2, width_ratios=[2, 1], height_ratios=[1, 2])

ax1 = fig.add_subplot(gs[0, 0])
ax2 = fig.add_subplot(gs[0, 1])
ax3 = fig.add_subplot(gs[1, :])

ax1.plot([1, 2, 3, 4], [1, 4, 2, 3])
ax1.set_title('Subplot 1 - how2matplotlib.com')

ax2.plot([1, 2, 3, 4], [4, 3, 2, 1])
ax2.set_title('Subplot 2 - how2matplotlib.com')

ax3.plot([1, 2, 3, 4], [2, 3, 4, 1])
ax3.set_title('Subplot 3 - how2matplotlib.com')

plt.tight_layout()
plt.show()
Output:
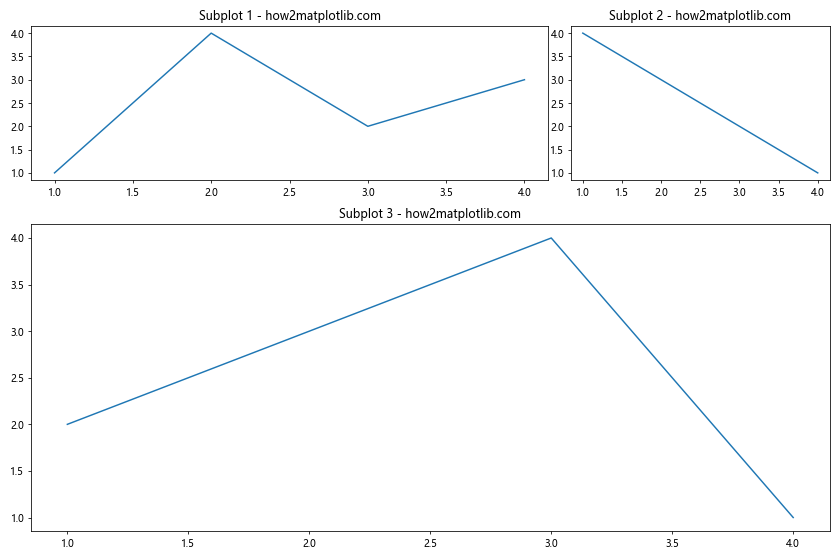
在这个例子中,我们使用gridspec创建了一个2×2的网格,但设置了不同的宽度和高度比例。第一列是第二列的两倍宽,第二行是第一行的两倍高。
5.2 使用add_axes()
add_axes()方法允许你精确控制子图的位置和大小:
import matplotlib.pyplot as plt

fig = plt.figure(figsize=(12, 8))

# 添加一个大的子图
ax1 = fig.add_axes([0.1, 0.1, 0.8, 0.8])
ax1.plot([1, 2, 3, 4], [1, 4, 2, 3])
ax1.set_title('Main Plot - how2matplotlib.com')

# 添加一个小的子图
ax2 = fig.add_axes([0.65, 0.65, 0.2, 0.2])
ax2.plot([1, 2, 3, 4], [4, 3, 2, 1])
ax2.set_title('Inset Plot - how2matplotlib.com')

plt.show()
Output:
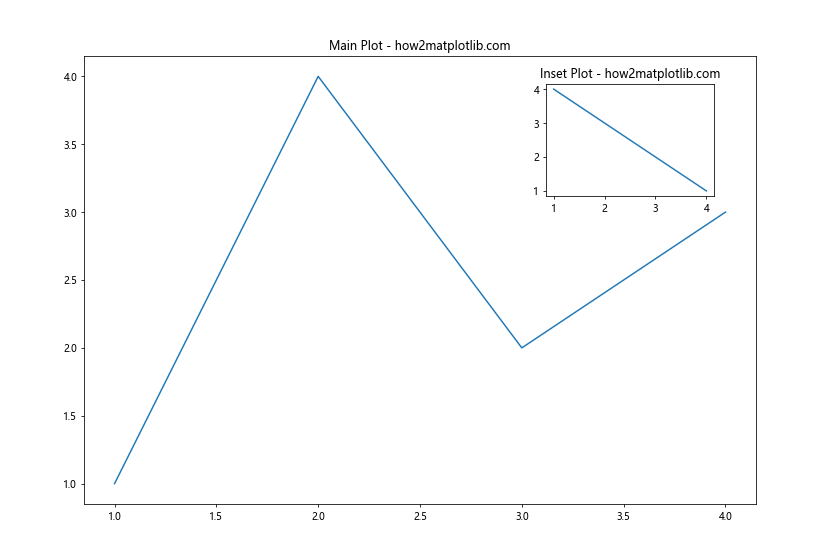
在这个例子中,我们创建了一个大的主图和一个小的插图。add_axes()的参数是一个列表,包含四个值:[left, bottom, width, height],这些值都是相对于整个图形的比例。
6. 处理长标题和标签
当你有长标题或标签时,可能需要额外的空间来显示它们。
6.1 调整顶部和底部的边距
import matplotlib.pyplot as plt

fig, (ax1, ax2) = plt.subplots(2, 1, figsize=(10, 8))

ax1.plot([1, 2, 3, 4], [1, 4, 2, 3])
ax1.set_title('This is a very long title for Subplot 1 - how2matplotlib.com')

ax2.plot([1, 2, 3, 4], [4, 3, 2, 1])
ax2.set_title('This is another very long title for Subplot 2 - how2matplotlib.com')

# 增加顶部和底部的边距
plt.subplots_adjust(top=0.85, bottom=0.1)

plt.show()
Output:
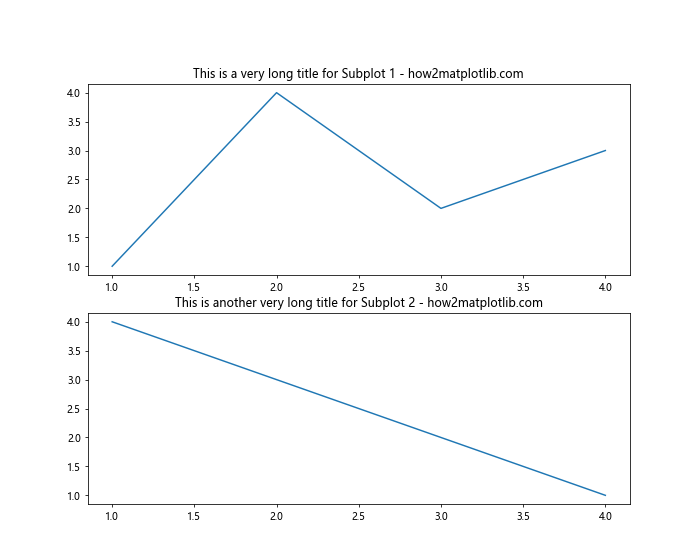
在这个例子中,我们增加了顶部的边距以容纳长标题。
6.2 使用换行符
对于非常长的标题,你可以使用换行符来分割它们:
import matplotlib.pyplot as plt

fig, (ax1, ax2) = plt.subplots(1, 2, figsize=(12, 6))

ax1.plot([1, 2, 3, 4], [1, 4, 2, 3])
ax1.set_title('This is a very long title\nfor Subplot 1 - how2matplotlib.com')

ax2.plot([1, 2, 3, 4], [4, 3, 2, 1])
ax2.set_title('This is another very long title\nfor Subplot 2 - how2matplotlib.com')

plt.tight_layout()
plt.show()
Output:
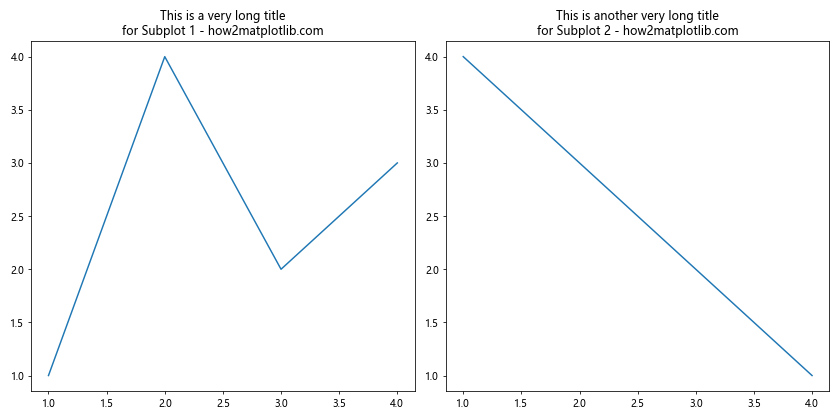
使用\n可以在标题中添加换行,这样可以减少水平空间的需求。
7. 保存高质量的图形
当你调整了图形大小并满意布局后,你可能想要保存高质量的图形。
7.1 使用dpi参数
dpi(dots per inch)参数控制图形的分辨率:
import matplotlib.pyplot as plt

fig, (ax1, ax2) = plt.subplots(1, 2, figsize=(12, 6))

ax1.plot([1, 2, 3, 4], [1, 4, 2, 3])
ax1.set_title('Subplot 1 - how2matplotlib.com')

ax2.plot([1, 2, 3, 4], [4, 3, 2, 1])
ax2.set_title('Subplot 2 - how2matplotlib.com')

plt.tight_layout()

# 保存高分辨率图像
plt.savefig('high_quality_figure.png', dpi=300)
plt.show()
Output:
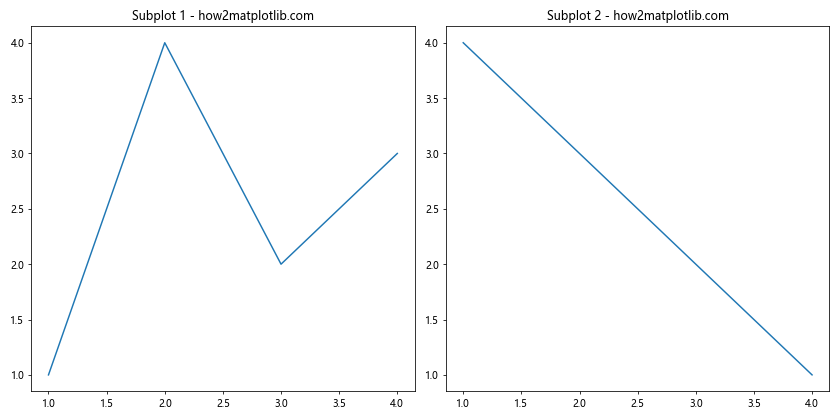
在这个例子中,我们将图形保存为300 DPI的PNG文件,这将产生一个高质量的图像。
7.2 使用矢量格式
对于需要无损放大的图形,可以使用矢量格式如PDF或SVG:
import matplotlib.pyplot as plt

fig, (ax1, ax2) = plt.subplots(1, 2, figsize=(12, 6))

ax1.plot([1, 2, 3, 4], [1, 4, 2, 3])
ax1.set_title('Subplot 1 - how2matplotlib.com')

ax2.plot([1, 2, 3, 4], [4, 3, 2, 1])
ax2.set_title('Subplot 2 - how2matplotlib.com')

plt.tight_layout()

# 保存为PDF格式
plt.savefig('vector_figure.pdf')
plt.show()
Output:
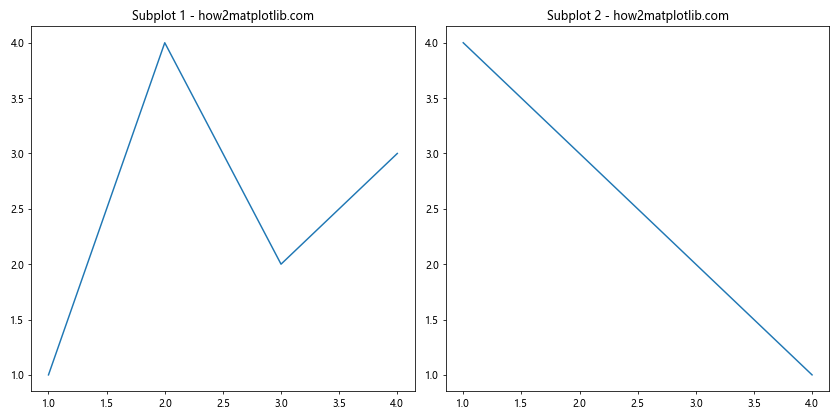
保存为PDF格式可以保持图形的矢量特性,允许无损放大。
8. 动态调整图形大小
有时,你可能需要根据数据或其他条件动态调整图形大小。
8.1 根据子图数量调整
import matplotlib.pyplot as plt

def create_subplots(num_plots):
    # 计算行数和列数
    cols = min(3, num_plots)  # 最多3列
    rows = (num_plots - 1) // cols + 1

    # 计算图形大小
    fig_width = 5 * cols
    fig_height = 4 * rows

    fig, axs = plt.subplots(rows, cols, figsize=(fig_width, fig_height))
    axs = axs.flatten()  # 将axs转换为一维数组

    for i in range(num_plots):
        axs[i].plot([1, 2, 3, 4], [1, 4, 2, 3])
        axs[i].set_title(f'Subplot {i+1} - how2matplotlib.com')

    # 隐藏多余的子图
    for i in range(num_plots, len(axs)):
        axs[i].axis('off')

    plt.tight_layout()
    plt.show()

# 测试不同数量的子图
create_subplots(5)
这个函数可以根据指定的子图数量动态创建适当大小的图形。
8.2 根据数据范围调整
import matplotlib.pyplot as plt
import numpy as np

def plot_with_dynamic_size(x, y):
    # 计算数据范围
    x_range = np.ptp(x)
    y_range = np.ptp(y)

    # 根据数据范围调整图形大小
    fig_width = max(6, min(12, x_range / 2))
    fig_height = max(4, min(8, y_range / 2))

    fig, ax = plt.subplots(figsize=(fig_width, fig_height))
    ax.plot(x, y)
    ax.set_title('Dynamic Size Plot - how2matplotlib.com')

    plt.tight_layout()
    plt.show()

# 测试不同范围的数据
x1 = np.linspace(0, 10, 100)
y1 = np.sin(x1)
plot_with_dynamic_size(x1, y1)

x2 = np.linspace(0, 50, 500)
y2 = np.cos(x2) * 10
plot_with_dynamic_size(x2, y2)
这个函数根据数据的范围动态调整图形大小,确保数据能够清晰地显示。
9. 处理多个图形
当你需要在一个脚本中创建多个图形时,管理它们的大小和布局变得更加重要。
9.1 使用plt.figure()
import matplotlib.pyplot as plt

# 创建第一个图形
plt.figure(figsize=(8, 4))
plt.plot([1, 2, 3, 4], [1, 4, 2, 3])
plt.title('Figure 1 - how2matplotlib.com')

# 创建第二个图形
plt.figure(figsize=(6, 6))
plt.scatter([1, 2, 3, 4], [4, 3, 2, 1])
plt.title('Figure 2 - how2matplotlib.com')

plt.show()
Output:
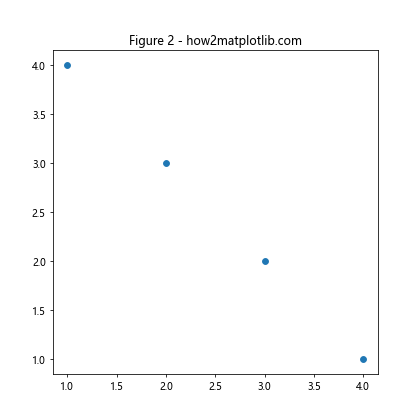
使用plt.figure()可以创建多个独立的图形,每个图形可以有不同的大小。
9.2 使用面向对象的方法
import matplotlib.pyplot as plt

# 创建第一个图形
fig1, ax1 = plt.subplots(figsize=(8, 4))
ax1.plot([1, 2, 3, 4], [1, 4, 2, 3])
ax1.set_title('Figure 1 - how2matplotlib.com')

# 创建第二个图形
fig2, ax2 = plt.subplots(figsize=(6, 6))
ax2.scatter([1, 2, 3, 4], [4, 3, 2, 1])
ax2.set_title('Figure 2 - how2matplotlib.com')

plt.show()
Output:
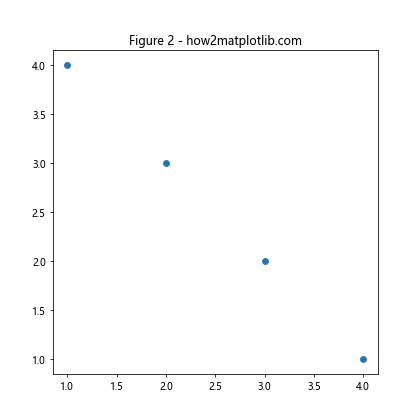
面向对象的方法允许你更精确地控制每个图形和子图。
10. 高级技巧和注意事项
10.1 使用constrained_layout
constrained_layout是一个更新的自动布局调整器,可以替代tight_layout:
import matplotlib.pyplot as plt

fig, axs = plt.subplots(2, 2, figsize=(10, 10), constrained_layout=True)

axs[0, 0].plot([1, 2, 3, 4], [1, 4, 2, 3])
axs[0, 0].set_title('Subplot 1 - how2matplotlib.com')

axs[0, 1].plot([1, 2, 3, 4], [4, 3, 2, 1])
axs[0, 1].set_title('Subplot 2 - how2matplotlib.com')

axs[1, 0].plot([1, 2, 3, 4], [2, 3, 4, 1])
axs[1, 0].set_title('Subplot 3 - how2matplotlib.com')

axs[1, 1].plot([1, 2, 3, 4], [3, 1, 4, 2])
axs[1, 1].set_title('Subplot 4 - how2matplotlib.com')

plt.show()
Output:
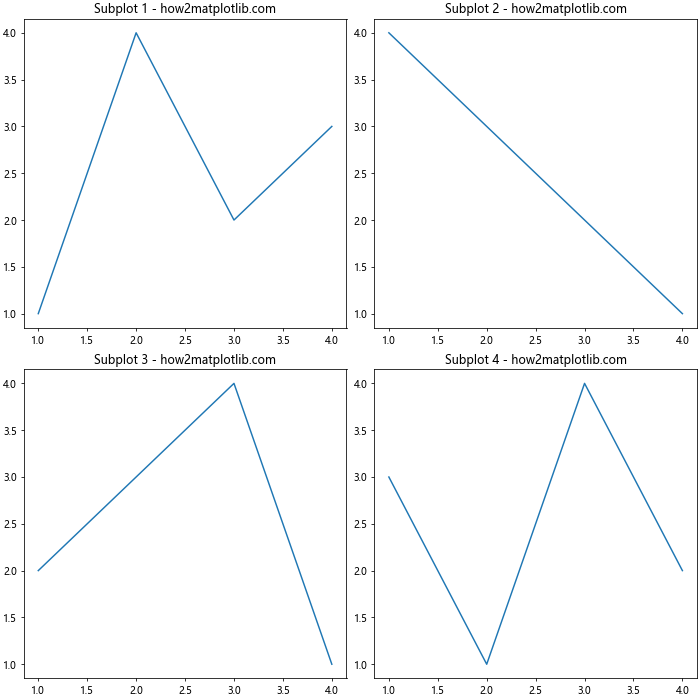
constrained_layout通常能够更好地处理复杂的布局。
10.2 考虑屏幕分辨率
在调整图形大小时,要考虑目标显示设备的分辨率:
import matplotlib.pyplot as plt

# 假设目标显示器的DPI为96
dpi = 96
width_inches = 1920 / dpi
height_inches = 1080 / dpi

fig, ax = plt.subplots(figsize=(width_inches, height_inches))
ax.plot([1, 2, 3, 4], [1, 4, 2, 3])
ax.set_title('Full Screen Plot - how2matplotlib.com')

plt.show()
Output:
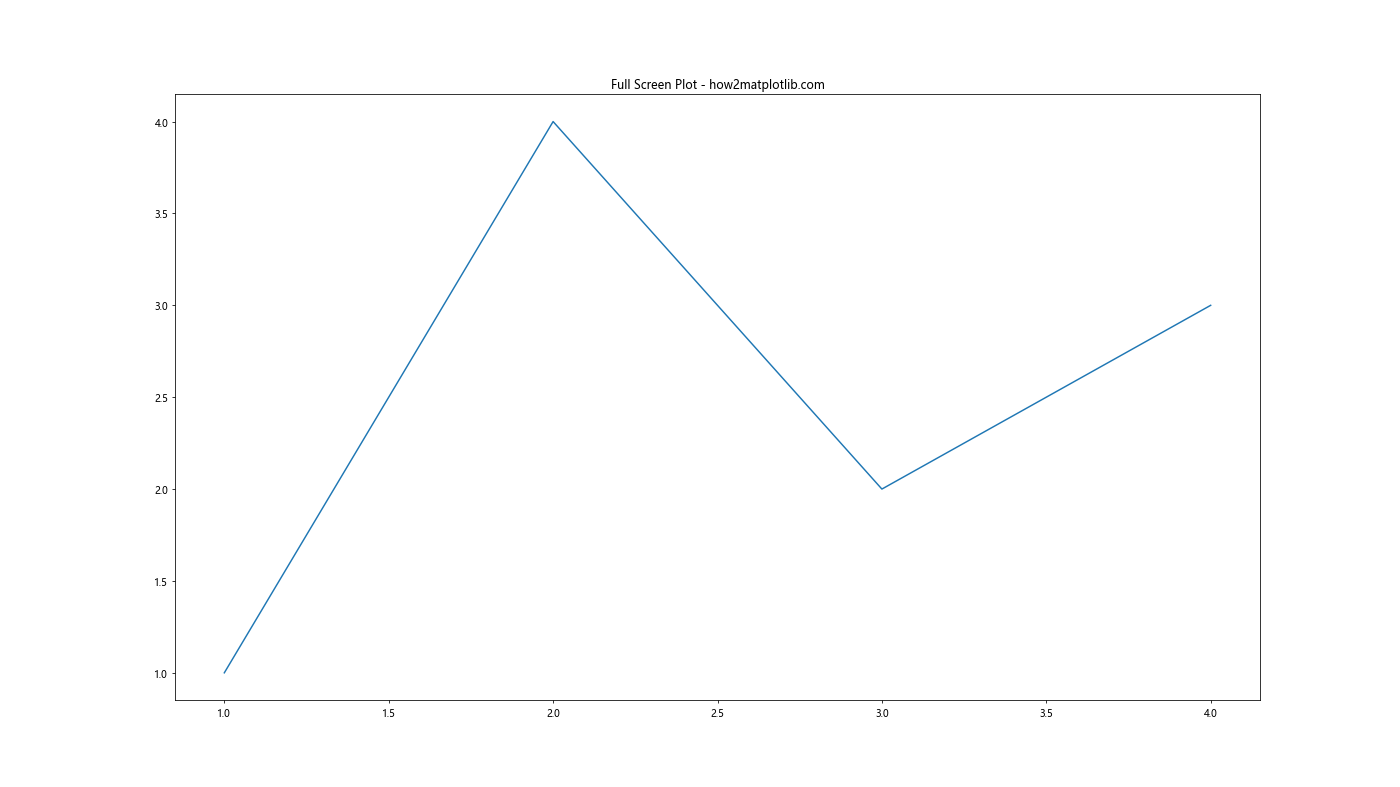
这个例子创建了一个适合1920×1080分辨率屏幕的全屏图形。
10.3 使用样式表
Matplotlib的样式表可以帮助你快速设置图形的整体外观:
import matplotlib.pyplot as plt

plt.style.use('seaborn')

fig, (ax1, ax2) = plt.subplots(1, 2, figsize=(12, 6))

ax1.plot([1, 2, 3, 4], [1, 4, 2, 3])
ax1.set_title('Subplot 1 - how2matplotlib.com')

ax2.plot([1, 2, 3, 4], [4, 3, 2, 1])
ax2.set_title('Subplot 2 - how2matplotlib.com')

plt.tight_layout()
plt.show()
使用样式表可以快速改变图形的整体外观,包括颜色、字体等。
结论
调整Matplotlib中包含子图的图形大小是一个重要的技能,它可以帮助你创建既美观又信息丰富的数据可视化。通过本文介绍的各种方法和技巧,你应该能够灵活地控制图形的大小、布局和外观。记住,没有一种固定的方法适用于所有情况,你需要根据具体的数据和展示需求来选择最合适的方法。实践和实验是掌握这些技巧的关键,所以不要害怕尝试不同的方法来找到最适合你需求的解决方案。
 极客笔记
极客笔记