Matplotlib 图形尺寸调整:全面指南与实用技巧
参考:how to change matplotlib figure size
Matplotlib 是 Python 中最流行的数据可视化库之一,它提供了丰富的功能来创建各种类型的图表和图形。在使用 Matplotlib 时,控制图形尺寸是一个重要的方面,因为它直接影响图形的视觉效果和可读性。本文将详细介绍如何在 Matplotlib 中调整图形尺寸,包括各种方法、技巧和最佳实践。
1. 基本概念
在深入探讨如何调整 Matplotlib 图形尺寸之前,我们需要了解一些基本概念:
1.1 Figure 和 Axes
- Figure:整个图形窗口
- Axes:图形中的绘图区域
1.2 尺寸单位
Matplotlib 中的尺寸通常以英寸为单位。1 英寸约等于 2.54 厘米。
1.3 DPI(每英寸点数)
DPI 决定了图形的分辨率。较高的 DPI 值会产生更清晰的图像,但文件大小也会增加。
2. 使用 figure() 函数设置图形尺寸
最直接的方法是在创建图形时使用 figure() 函数指定尺寸。
import matplotlib.pyplot as plt

plt.figure(figsize=(10, 6))
plt.plot([1, 2, 3, 4], [1, 4, 2, 3])
plt.title("How to change matplotlib figure size - how2matplotlib.com")
plt.show()
Output:
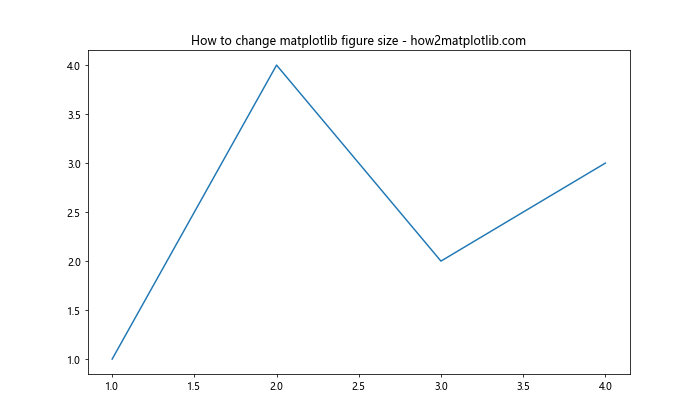
在这个例子中,我们创建了一个宽 10 英寸、高 6 英寸的图形。figsize 参数接受一个元组,其中第一个值是宽度,第二个值是高度。
3. 使用 rcParams 全局设置图形尺寸
如果你想为所有图形设置默认尺寸,可以使用 rcParams。
import matplotlib.pyplot as plt
import matplotlib as mpl

mpl.rcParams['figure.figsize'] = [8.0, 6.0]
mpl.rcParams['figure.dpi'] = 80

plt.plot([1, 2, 3, 4], [1, 4, 2, 3])
plt.title("Global figure size setting - how2matplotlib.com")
plt.show()
Output:
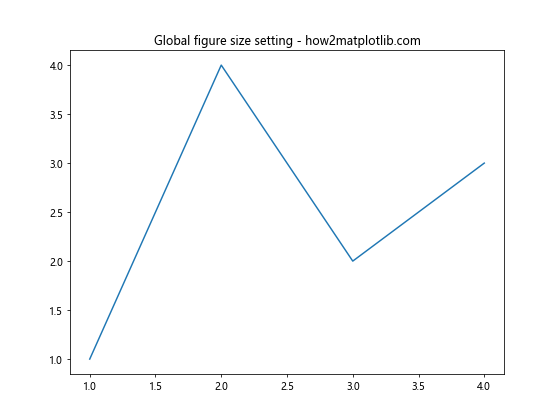
这段代码设置了默认的图形尺寸为 8×6 英寸,DPI 为 80。这些设置将应用于之后创建的所有图形。
4. 调整子图尺寸
当使用子图时,你可能需要调整每个子图的尺寸。
import matplotlib.pyplot as plt

fig, (ax1, ax2) = plt.subplots(1, 2, figsize=(12, 5))
ax1.plot([1, 2, 3, 4], [1, 4, 2, 3])
ax2.plot([1, 2, 3, 4], [3, 2, 4, 1])
fig.suptitle("Adjusting subplot sizes - how2matplotlib.com")
plt.show()
Output:
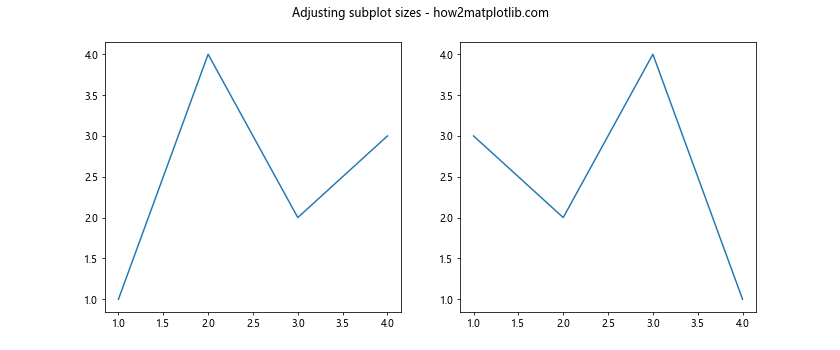
这个例子创建了一个包含两个子图的图形,总尺寸为 12×5 英寸。
5. 使用 tight_layout() 自动调整布局
tight_layout() 函数可以自动调整子图参数,以给定的填充适合图形。
import matplotlib.pyplot as plt

fig, (ax1, ax2) = plt.subplots(2, 1, figsize=(8, 8))
ax1.plot([1, 2, 3, 4], [1, 4, 2, 3])
ax2.plot([1, 2, 3, 4], [3, 2, 4, 1])
fig.suptitle("Using tight_layout() - how2matplotlib.com")
plt.tight_layout()
plt.show()
Output:
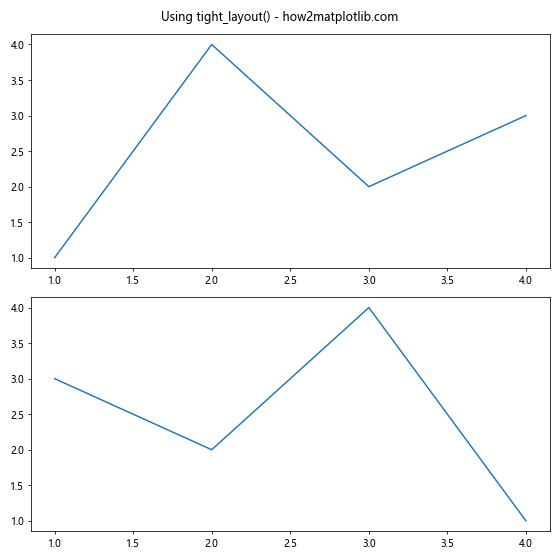
tight_layout() 会自动调整子图之间的间距,以及子图与图形边缘的距离。
6. 使用 set_size_inches() 方法动态调整尺寸
有时你可能需要在创建图形后动态调整其尺寸。
import matplotlib.pyplot as plt

fig, ax = plt.subplots()
ax.plot([1, 2, 3, 4], [1, 4, 2, 3])
fig.set_size_inches(10, 6)
plt.title("Dynamic size adjustment - how2matplotlib.com")
plt.show()
Output:
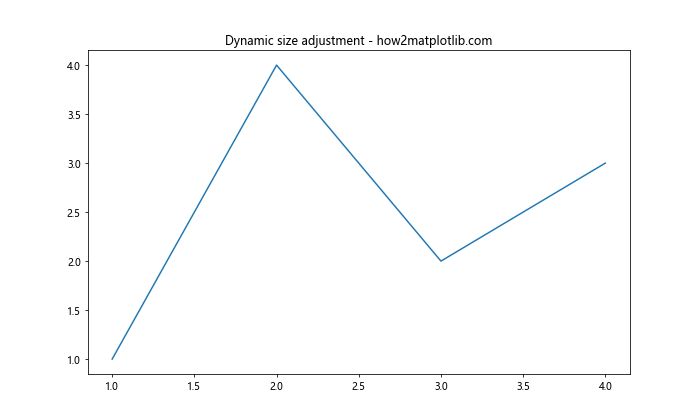
set_size_inches() 方法允许你在图形创建后更改其尺寸。
7. 调整图形和轴域的比例
有时你可能想保持图形的宽高比,同时调整其大小。
import matplotlib.pyplot as plt

fig, ax = plt.subplots()
ax.plot([1, 2, 3, 4], [1, 4, 2, 3])
ax.set_aspect('equal', adjustable='box')
fig.set_size_inches(8, 8)
plt.title("Adjusting aspect ratio - how2matplotlib.com")
plt.show()
Output:
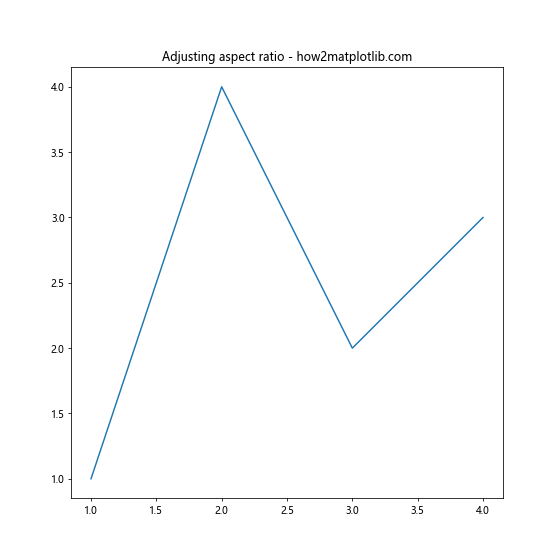
set_aspect('equal') 确保 x 轴和 y 轴的比例相同,而 adjustable='box' 允许调整整个图形的大小以适应这个比例。
8. 使用 constrained_layout 进行自动布局
constrained_layout 是一个更高级的自动布局选项,它可以处理复杂的图形布局。
import matplotlib.pyplot as plt

fig, axs = plt.subplots(2, 2, figsize=(10, 10), constrained_layout=True)
for ax in axs.flat:
    ax.plot([1, 2, 3, 4], [1, 4, 2, 3])
fig.suptitle("Using constrained_layout - how2matplotlib.com")
plt.show()
Output:
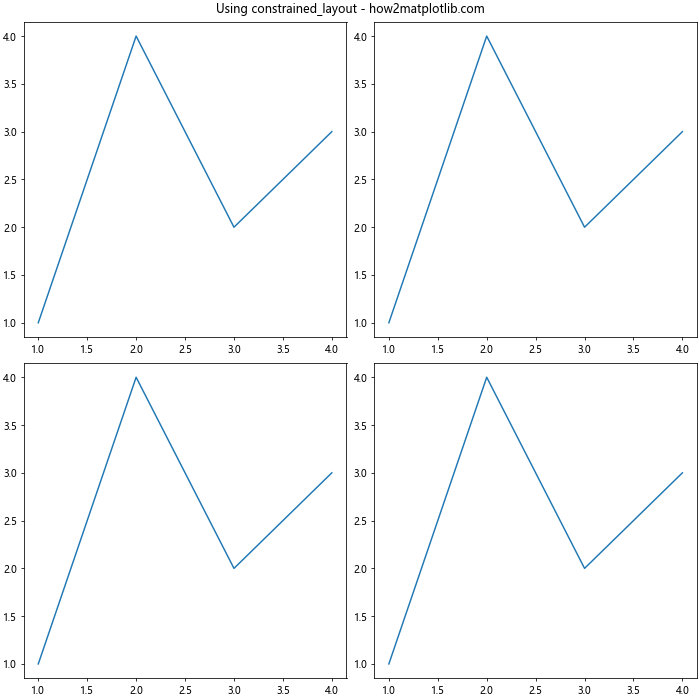
constrained_layout=True 会自动调整子图的大小和位置,以避免重叠和不必要的空白。
9. 调整图形边距
你可以通过调整图形的边距来有效地改变图形的可用空间。
import matplotlib.pyplot as plt

fig, ax = plt.subplots(figsize=(8, 6))
ax.plot([1, 2, 3, 4], [1, 4, 2, 3])
plt.title("Adjusting figure margins - how2matplotlib.com")
plt.subplots_adjust(left=0.2, right=0.9, top=0.9, bottom=0.2)
plt.show()
Output:
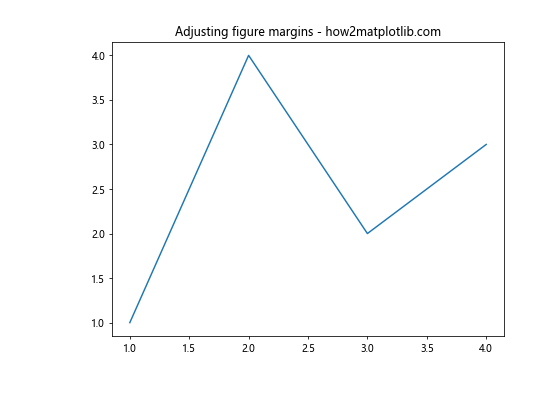
subplots_adjust() 函数允许你精确控制图形的边距。
10. 使用 GridSpec 进行复杂布局
对于更复杂的布局,GridSpec 提供了强大的控制能力。
import matplotlib.pyplot as plt
import matplotlib.gridspec as gridspec

fig = plt.figure(figsize=(12, 8))
gs = gridspec.GridSpec(2, 2, width_ratios=[2, 1], height_ratios=[1, 2])

ax1 = fig.add_subplot(gs[0, 0])
ax2 = fig.add_subplot(gs[0, 1])
ax3 = fig.add_subplot(gs[1, :])

ax1.plot([1, 2, 3, 4], [1, 4, 2, 3])
ax2.plot([1, 2, 3, 4], [3, 2, 4, 1])
ax3.plot([1, 2, 3, 4], [2, 3, 1, 4])

plt.suptitle("Complex layout with GridSpec - how2matplotlib.com")
plt.tight_layout()
plt.show()
Output:
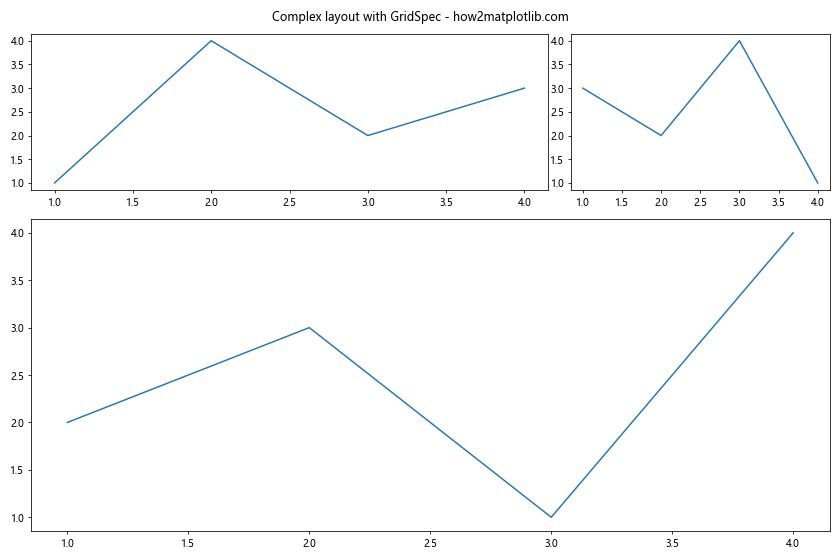
这个例子展示了如何使用 GridSpec 创建不同大小的子图。
11. 保存图形时调整尺寸
当保存图形时,你可能需要指定不同的尺寸。
import matplotlib.pyplot as plt

fig, ax = plt.subplots(figsize=(8, 6))
ax.plot([1, 2, 3, 4], [1, 4, 2, 3])
plt.title("Saving figure with custom size - how2matplotlib.com")
plt.savefig('output.png', dpi=300, bbox_inches='tight')
plt.show()
Output:
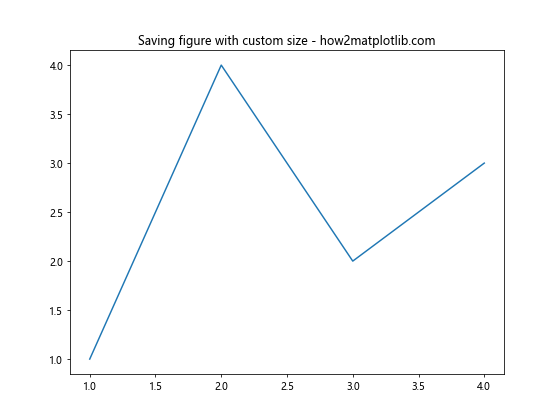
savefig() 函数允许你指定 DPI 和其他保存选项。bbox_inches='tight' 确保图形的所有部分都包含在保存的文件中。
12. 响应式图形尺寸
创建响应式图形,使其能够适应不同的显示环境,这在 Jupyter Notebook 等交互式环境中特别有用。
import matplotlib.pyplot as plt
from IPython.display import set_matplotlib_formats

set_matplotlib_formats('retina')

plt.figure(figsize=(10, 6))
plt.plot([1, 2, 3, 4], [1, 4, 2, 3])
plt.title("Responsive figure size - how2matplotlib.com")
plt.show()
set_matplotlib_formats('retina') 设置高分辨率输出,适合高 DPI 显示器。
13. 使用英寸以外的单位
虽然 Matplotlib 默认使用英寸,但你可以使用其他单位,如厘米。
import matplotlib.pyplot as plt

cm = 1/2.54  # centimeters in inches
plt.figure(figsize=(20*cm, 15*cm))
plt.plot([1, 2, 3, 4], [1, 4, 2, 3])
plt.title("Figure size in centimeters - how2matplotlib.com")
plt.show()
Output:
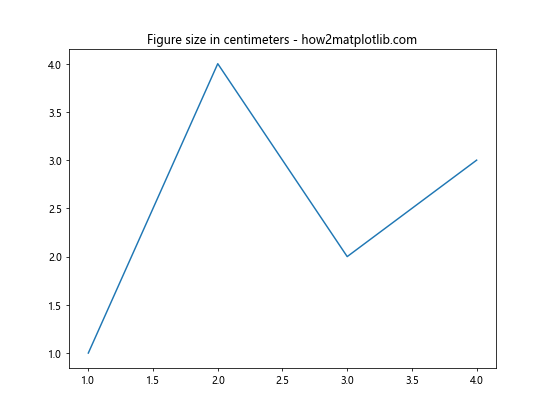
这个例子创建了一个 20×15 厘米的图形。
14. 调整图例大小和位置
图例的大小和位置也会影响整体图形的布局。
import matplotlib.pyplot as plt

fig, ax = plt.subplots(figsize=(10, 6))
ax.plot([1, 2, 3, 4], [1, 4, 2, 3], label='Line 1')
ax.plot([1, 2, 3, 4], [3, 2, 4, 1], label='Line 2')
ax.legend(loc='center left', bbox_to_anchor=(1, 0.5))
plt.title("Adjusting legend size and position - how2matplotlib.com")
plt.tight_layout()
plt.show()
Output:
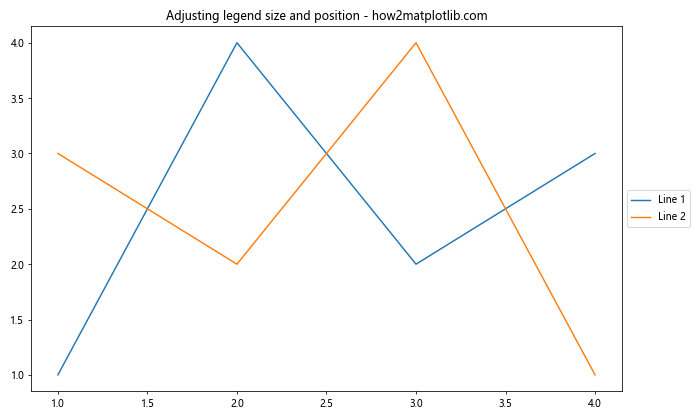
bbox_to_anchor 参数允许你精确控制图例的位置。
15. 处理长标题和标签
长标题和标签可能会影响图形的有效尺寸。
import matplotlib.pyplot as plt

fig, ax = plt.subplots(figsize=(10, 6))
ax.plot([1, 2, 3, 4], [1, 4, 2, 3])
ax.set_title("A very long title that might affect the figure size - how2matplotlib.com")
ax.set_xlabel("This is a long x-axis label")
ax.set_ylabel("This is a long y-axis label")
plt.tight_layout()
plt.show()
Output:
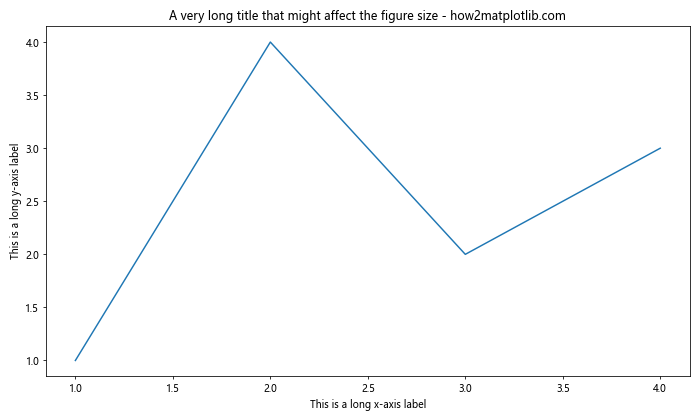
tight_layout() 会自动调整布局以适应长标题和标签。
结论
调整 Matplotlib 图形尺寸是创建高质量数据可视化的关键步骤。通过本文介绍的各种方法和技巧,你可以精确控制图形的大小、比例和布局,以最佳方式展示你的数据。记住,没有一种固定的方法适用于所有情况,选择合适的方法取决于你的具体需求和数据特性。
在实践中,你可能需要结合使用多种技术来达到理想的效果。例如,你可能需要先设置整体图形大小,然后调整子图布局,最后微调边距和图例位置。通过不断实验和调整,你将能够创建既美观又信息丰富的数据可视化。
最后,始终记住考虑你的目标受众和展示媒介。不同的用途可能需要不同的图形尺寸和分辨率。例如,用于打印的图形可能需要更高的分辨率,而用于网页显示的图形则可能需要更小的文件大小。通过灵活运用本文中的技巧,你将能够为各种场景创建完美的图形。
 极客笔记
极客笔记