How to Add Title to Subplots in Matplotlib
参考:How to Add Title to Subplots in Matplotlib
在使用Matplotlib进行数据可视化时,经常需要创建包含多个子图(subplots)的图表。为了使图表更加清晰易懂,通常需要为每个子图添加标题。本文将详细介绍如何在Matplotlib中为子图添加标题,并提供多个示例代码,帮助读者更好地掌握这一技能。
1. 基本概念
在Matplotlib中,subplot是指图表中的一个独立的小图。使用plt.subplot()或fig.add_subplot()可以创建子图。每个子图都可以有自己的坐标轴、标题和绘图内容。
2. 添加子图标题的方法
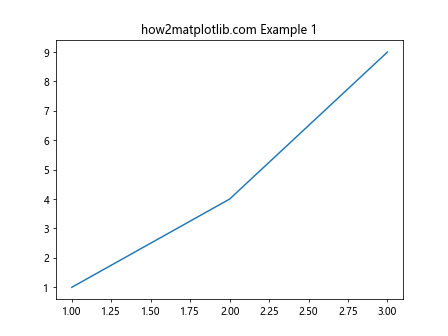
示例代码 1: 使用set_title方法
import matplotlib.pyplot as plt

# 创建一个图形和子图
fig, ax = plt.subplots()
ax.plot([1, 2, 3], [1, 4, 9])
ax.set_title("how2matplotlib.com Example 1")
plt.show()
Output:
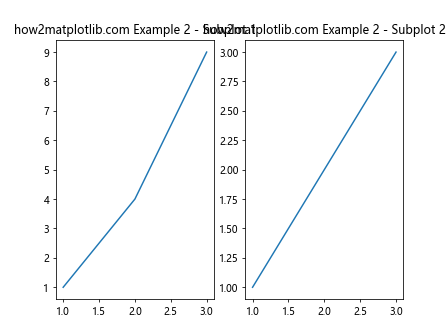
示例代码 2: 使用subplot创建多个子图并添加标题
import matplotlib.pyplot as plt

# 创建一个包含两个子图的图形
fig, (ax1, ax2) = plt.subplots(1, 2)
ax1.plot([1, 2, 3], [1, 4, 9])
ax1.set_title("how2matplotlib.com Example 2 - Subplot 1")
ax2.plot([1, 2, 3], [1, 2, 3])
ax2.set_title("how2matplotlib.com Example 2 - Subplot 2")
plt.show()
Output:
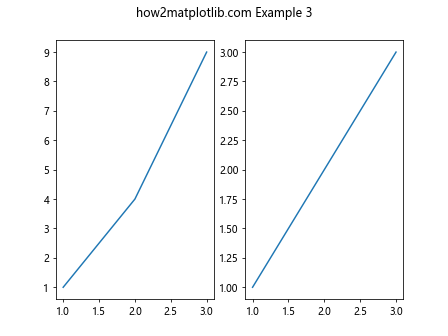
示例代码 3: 使用fig.suptitle添加整个图形的标题
import matplotlib.pyplot as plt

# 创建一个包含两个子图的图形
fig, (ax1, ax2) = plt.subplots(1, 2)
ax1.plot([1, 2, 3], [1, 4, 9])
ax2.plot([1, 2, 3], [1, 2, 3])
fig.suptitle("how2matplotlib.com Example 3")
plt.show()
Output:
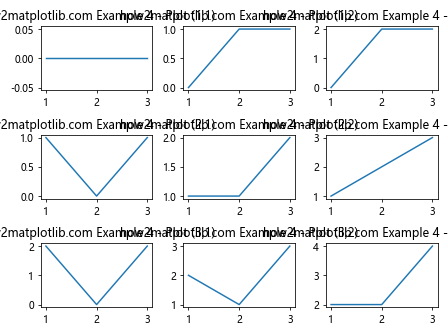
示例代码 4: 在网格布局中添加标题
import matplotlib.pyplot as plt

# 创建一个3x3的子图网格
fig, axs = plt.subplots(3, 3)
for i in range(3):
    for j in range(3):
        axs[i, j].plot([1, 2, 3], [i, j, i+j])
        axs[i, j].set_title(f"how2matplotlib.com Example 4 - Plot ({i+1},{j+1})")
plt.tight_layout()
plt.show()
Output:
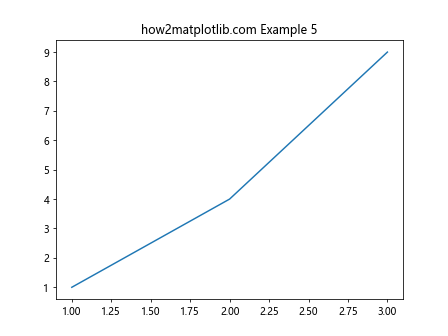
示例代码 5: 使用title参数在subplot函数中直接添加标题
import matplotlib.pyplot as plt

# 创建一个图形和子图,并直接在创建时添加标题
fig, ax = plt.subplots()
ax.plot([1, 2, 3], [1, 4, 9])
ax.set(title="how2matplotlib.com Example 5")
plt.show()
Output:
3. 高级标题设置
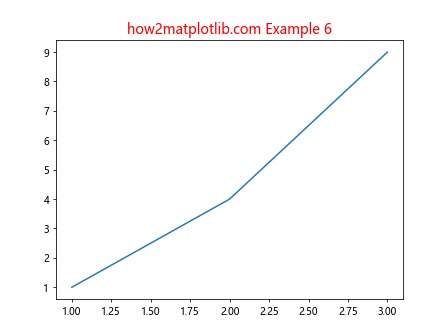
示例代码 6: 设置标题的字体大小和颜色
import matplotlib.pyplot as plt

# 创建一个图形和子图
fig, ax = plt.subplots()
ax.plot([1, 2, 3], [1, 4, 9])
ax.set_title("how2matplotlib.com Example 6", fontsize=14, color='red')
plt.show()
Output:
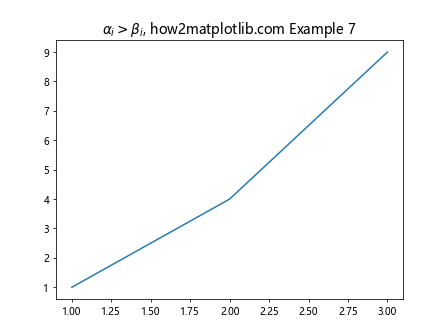
示例代码 7: 使用LaTeX格式的标题
import matplotlib.pyplot as plt

# 创建一个图形和子图
fig, ax = plt.subplots()
ax.plot([1, 2, 3], [1, 4, 9])
ax.set_title(r"\alpha_i>\beta_i, how2matplotlib.com Example 7", fontsize=14)
plt.show()
Output:
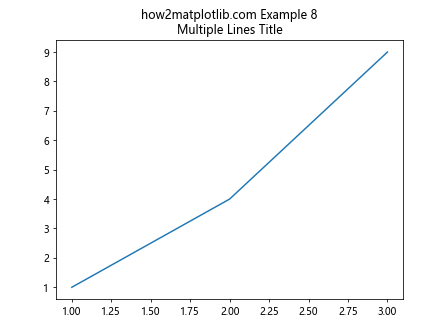
示例代码 8: 添加多行标题
import matplotlib.pyplot as plt

# 创建一个图形和子图
fig, ax = plt.subplots()
ax.plot([1, 2, 3], [1, 4, 9])
ax.set_title("how2matplotlib.com Example 8\nMultiple Lines Title")
plt.show()
Output:
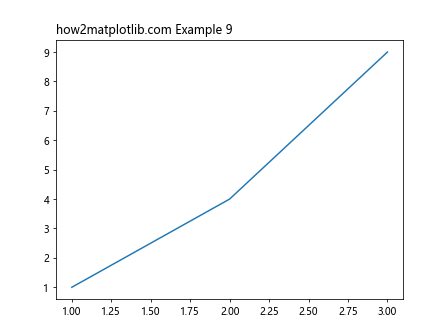
示例代码 9: 设置标题的位置
import matplotlib.pyplot as plt

# 创建一个图形和子图
fig, ax = plt.subplots()
ax.plot([1, 2, 3], [1, 4, 9])
ax.set_title("how2matplotlib.com Example 9", loc='left')
plt.show()
Output:
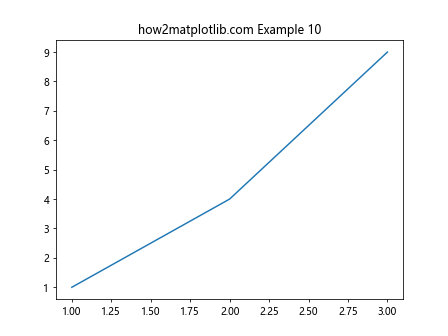
示例代码 10: 使用不同的字体风格
import matplotlib.pyplot as plt

# 创建一个图形和子图
fig, ax = plt.subplots()
ax.plot([1, 2, 3], [1, 4, 9])
ax.set_title("how2matplotlib.com Example 10", style='italic')
plt.show()
Output:
4. 结论
在Matplotlib中为子图添加标题是一个简单但重要的步骤,可以帮助观众更好地理解图表的内容。通过上述示例代码,我们展示了多种添加和自定义子图标题的方法。
 极客笔记
极客笔记