如何在 Matplotlib 中调整标记的大小
参考:How to Adjust Marker Size in Matplotlib
在数据可视化中,使用图表是表达数据关系的一种直观方式。Matplotlib 是 Python 中一个广泛使用的绘图库,它提供了丰富的接口来创建和展示图形。在散点图或线图中,标记(marker)的大小可以根据数据的某些特性进行调整,以提供更多的信息层次或视觉效果。本文将详细介绍如何在 Matplotlib 中调整标记的大小,并通过多个示例展示不同的应用场景。
基本概念
在 Matplotlib 中,标记的大小可以通过 s 参数(用于 scatter 函数)或 markersize(简写为 ms,用于 plot 函数)来调整。这些参数接受一个数值,该数值定义了标记的大小。大小的单位通常是点(point),其中 1 point 等于 1/72 英寸。
示例代码
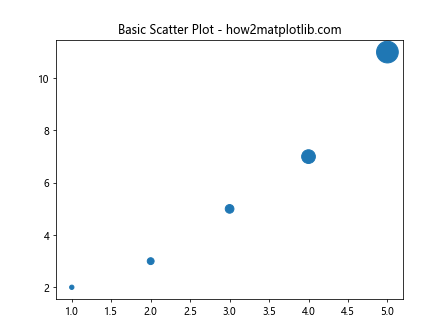
示例 1: 基本散点图标记大小调整
import matplotlib.pyplot as plt

x = [1, 2, 3, 4, 5]
y = [2, 3, 5, 7, 11]
sizes = [20, 50, 80, 200, 500]

plt.scatter(x, y, s=sizes)
plt.title("Basic Scatter Plot - how2matplotlib.com")
plt.show()
Output:
示例 2: 线图中调整标记大小
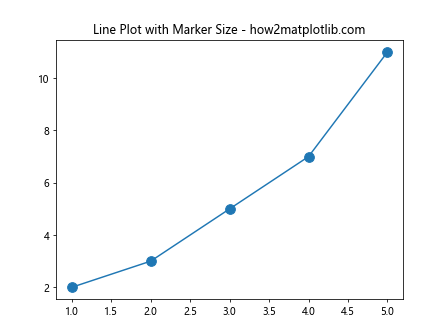
import matplotlib.pyplot as plt

x = [1, 2, 3, 4, 5]
y = [2, 3, 5, 7, 11]

plt.plot(x, y, marker='o', markersize=10)
plt.title("Line Plot with Marker Size - how2matplotlib.com")
plt.show()
Output:
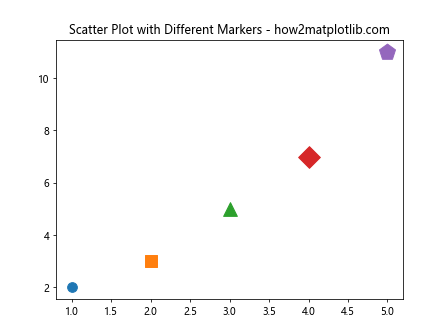
示例 3: 使用不同形状的标记
import matplotlib.pyplot as plt

x = [1, 2, 3, 4, 5]
y = [2, 3, 5, 7, 11]
sizes = [100, 150, 200, 250, 300]
markers = ['o', 's', '^', 'D', 'p']

for xi, yi, mi, si in zip(x, y, markers, sizes):
    plt.scatter([xi], [yi], marker=mi, s=si)

plt.title("Scatter Plot with Different Markers - how2matplotlib.com")
plt.show()
Output:
示例 4: 标记大小映射到数据值
import matplotlib.pyplot as plt
import numpy as np

x = np.random.rand(50)
y = np.random.rand(50)
sizes = np.random.rand(50) * 1000  # Random sizes between 0 and 1000

plt.scatter(x, y, s=sizes)
plt.title("Marker Size Mapped to Data Values - how2matplotlib.com")
plt.show()
Output:

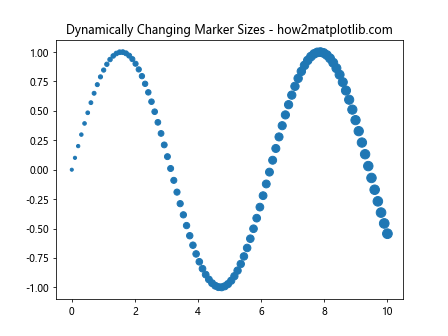
示例 5: 动态调整标记大小
import matplotlib.pyplot as plt
import numpy as np

x = np.linspace(0, 10, 100)
y = np.sin(x)
sizes = np.linspace(10, 100, 100)

plt.scatter(x, y, s=sizes)
plt.title("Dynamically Changing Marker Sizes - how2matplotlib.com")
plt.show()
Output:
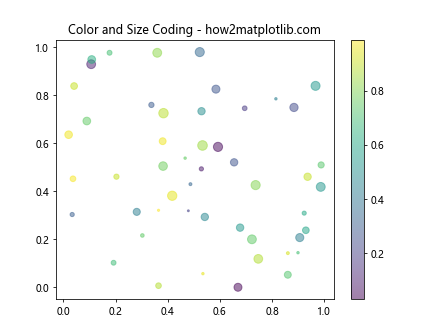
示例 6: 使用颜色和大小编码
import matplotlib.pyplot as plt
import numpy as np

x = np.random.rand(50)
y = np.random.rand(50)
colors = np.random.rand(50)
sizes = np.random.rand(50) * 100

plt.scatter(x, y, c=colors, s=sizes, alpha=0.5)
plt.colorbar()  # Show color scale
plt.title("Color and Size Coding - how2matplotlib.com")
plt.show()
Output:
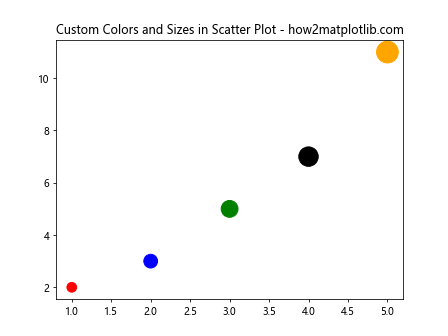
示例 7: 散点图中使用自定义颜色和大小
import matplotlib.pyplot as plt

x = [1, 2, 3, 4, 5]
y = [2, 3, 5, 7, 11]
colors = ['red', 'blue', 'green', 'black', 'orange']
sizes = [100, 200, 300, 400, 500]

plt.scatter(x, y, c=colors, s=sizes)
plt.title("Custom Colors and Sizes in Scatter Plot - how2matplotlib.com")
plt.show()
Output:
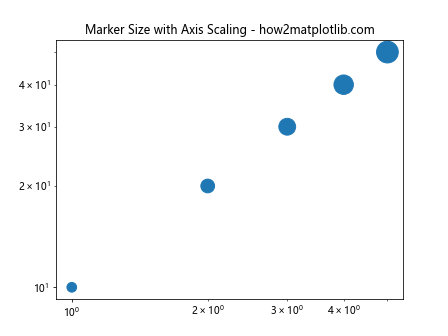
示例 8: 标记大小与轴比例的关系
import matplotlib.pyplot as plt

x = [1, 2, 3, 4, 5]
y = [10, 20, 30, 40, 50]
sizes = [100, 200, 300, 400, 500]

plt.scatter(x, y, s=sizes)
plt.title("Marker Size with Axis Scaling - how2matplotlib.com")
plt.xscale('log')
plt.yscale('log')
plt.show()
Output:
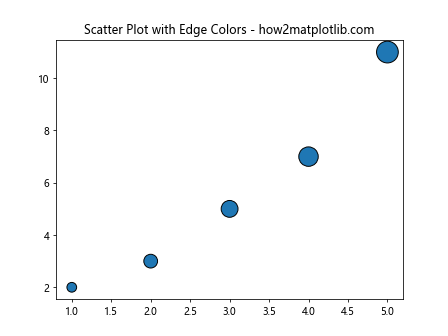
示例 9: 使用 scatter 的 edgecolors 属性
import matplotlib.pyplot as plt

x = [1, 2, 3, 4, 5]
y = [2, 3, 5, 7, 11]
sizes = [100, 200, 300, 400, 500]

plt.scatter(x, y, s=sizes, edgecolors='black')
plt.title("Scatter Plot with Edge Colors - how2matplotlib.com")
plt.show()
Output:
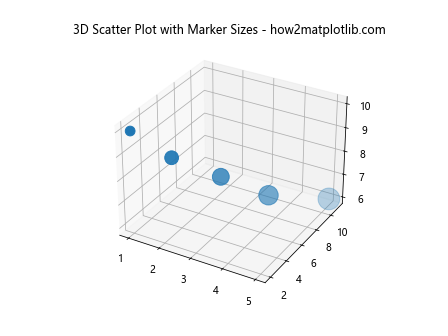
示例 10: 在3D图中调整标记大小
from mpl_toolkits.mplot3d import Axes3D
import matplotlib.pyplot as plt

fig = plt.figure()
ax = fig.add_subplot(111, projection='3d')

x = [1, 2, 3, 4, 5]
y = [2, 3, 5, 7, 11]
z = [10, 9, 8, 7, 6]
sizes = [100, 200, 300, 400, 500]

ax.scatter(x, y, z, s=sizes)
ax.set_title("3D Scatter Plot with Marker Sizes - how2matplotlib.com")
plt.show()
Output:
结论
在 Matplotlib 中调整标记的大小是一个简单而有效的方法,可以帮助更好地解读图表中的数据。通过调整大小,可以突出显示重要的数据点或展示数据的额外维度。
 极客笔记
极客笔记