如何在matplotlib中添加误差线
参考:how to add error bars in matplotlib
误差线是一种用于表示数据偏离真实值的程度的可视化方式,在数据分析和可视化中起着重要的作用。在matplotlib中,我们可以使用errorbar函数轻松地添加误差线到图表中。本文将详细介绍如何在matplotlib中添加误差线。
1. 使用errorbar函数添加水平误差线
import matplotlib.pyplot as plt

x = [1, 2, 3, 4, 5]
y = [2, 3, 4, 5, 6]
x_err = [0.1, 0.2, 0.1, 0.2, 0.1]

plt.errorbar(x, y, xerr=x_err, fmt='o', ecolor='red', capsize=5)
plt.show()
Output:
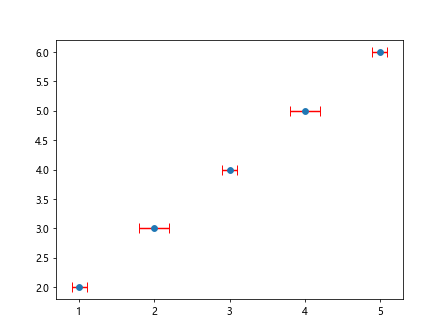
在上面的示例代码中,我们使用了errorbar函数来添加具有水平误差线的点到图表中。参数xerr用于指定水平误差线的长度,fmt用于指定数据点的样式,ecolor用于指定误差线的颜色,capsize用于指定误差线末端的线条长度。
2. 使用errorbar函数添加垂直误差线
import matplotlib.pyplot as plt

x = [1, 2, 3, 4, 5]
y = [2, 3, 4, 5, 6]
y_err = [0.2, 0.3, 0.1, 0.4, 0.2]

plt.errorbar(x, y, yerr=y_err, fmt='o', ecolor='green', capsize=5)
plt.show()
Output:
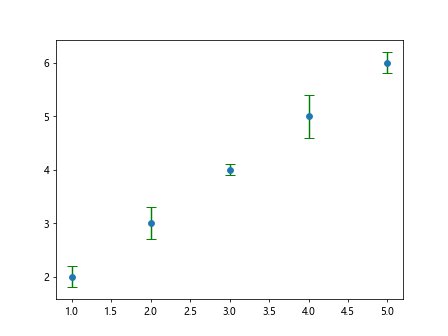
在上面的示例代码中,我们使用了errorbar函数来添加具有垂直误差线的点到图表中。参数yerr用于指定垂直误差线的长度,其余参数的作用与水平误差线相同。
3. 添加对称误差线
import matplotlib.pyplot as plt

x = [1, 2, 3, 4, 5]
y = [2, 3, 4, 5, 6]
y_err = [0.2, 0.3, 0.1, 0.4, 0.2]

plt.errorbar(x, y, yerr=y_err, xerr=0.1, fmt='o', ecolor='blue', capsize=5)
plt.show()
Output:
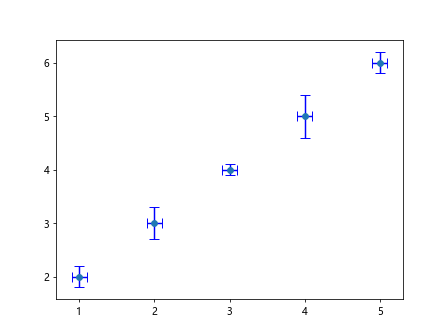
在上面的示例代码中,我们同时添加了对称的水平和垂直误差线到图表中。参数xerr和yerr分别用于指定水平和垂直误差线的长度,其中xerr为0.1表示水平误差线为对称误差线。
4. 使用不同颜色和样式展示误差线
import matplotlib.pyplot as plt

x = [1, 2, 3, 4, 5]
y = [2, 3, 4, 5, 6]
y_err = [0.2, 0.3, 0.1, 0.4, 0.2]

plt.errorbar(x, y, yerr=y_err, fmt='o', ecolor='red', capsize=5, elinewidth=2, capthick=2)
plt.show()
Output:
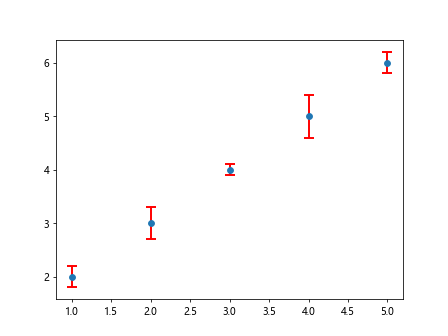
在上面的示例代码中,我们使用了elinewidth参数来指定误差线的线宽,capthick参数来指定误差线末端的线条宽度。
5. 在一张图表中添加多组数据点和误差线
import matplotlib.pyplot as plt

x1 = [1, 2, 3, 4, 5]
y1 = [2, 3, 4, 5, 6]
y_err1 = [0.2, 0.3, 0.1, 0.4, 0.2]

x2 = [1, 2, 3, 4, 5]
y2 = [3, 4, 5, 6, 7]
y_err2 = [0.1, 0.2, 0.15, 0.3, 0.1]

plt.errorbar(x1, y1, yerr=y_err1, fmt='o', ecolor='red', capsize=5, label='Data 1')
plt.errorbar(x2, y2, yerr=y_err2, fmt='s', ecolor='blue', capsize=5, label='Data 2')
plt.legend()
plt.show()
Output:
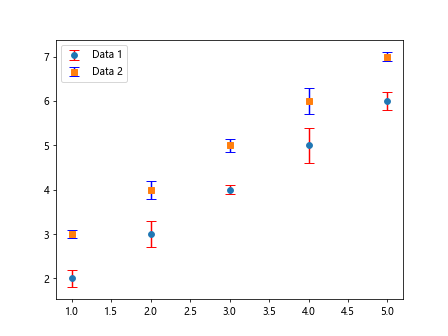
在上面的示例代码中,我们在同一张图表中添加了两组数据点和误差线,通过在errorbar函数中指定不同的参数来区分两组数据。
6. 自定义误差线的显示方式
import matplotlib.pyplot as plt

x = [1, 2, 3, 4, 5]
y = [2, 3, 4, 5, 6]
y_err = [0.2, 0.3, 0.1, 0.4, 0.2]

plt.errorbar(x, y, yerr=y_err, fmt='o', ecolor='red', capsize=5, errorevery=2, capthick=2)
plt.show()
Output:
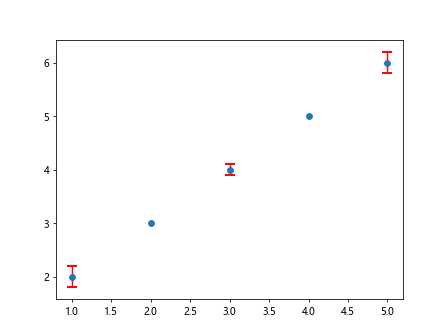
在上面的示例代码中,我们使用了errorevery参数来指定仅显示部分数据点的误差线,这可以帮助减少图表的混乱程度。
7. 使用bar函数添加柱状图和误差线
import matplotlib.pyplot as plt

x = [1, 2, 3, 4, 5]
y = [2, 3, 4, 5, 6]
y_err = [0.2, 0.3, 0.1, 0.4, 0.2]

plt.bar(x, y, yerr=y_err, color='orange', ecolor='black', capsize=5)
plt.show()
Output:
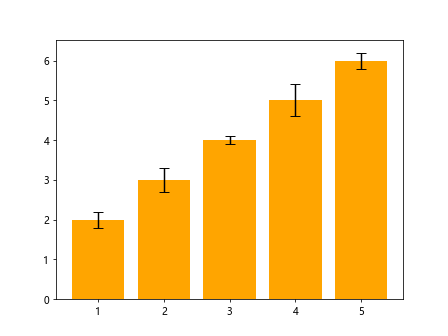
在上面的示例代码中,我们使用了bar函数来添加柱状图,并通过yerr参数来指定柱状图的误差线。
8. 在不同图形中添加误差线
import matplotlib.pyplot as plt

x = [1, 2, 3, 4, 5]
y = [2, 3, 4, 5, 6]
y_err = [0.2, 0.3, 0.1, 0.4, 0.2]

plt.errorbar(x, y, yerr=y_err, fmt='o', ecolor='red', capsize=5)
plt.bar(x, y, yerr=y_err, color='orange', ecolor='black', capsize=5, alpha=0.5)
plt.show()
Output:
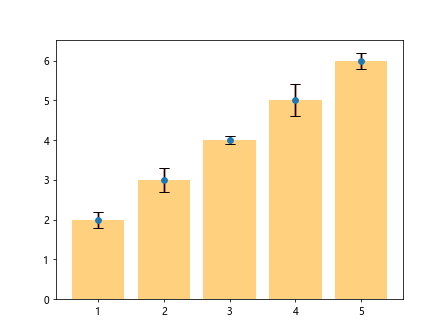
在上面的示例代码中,我们在不同的图形中分别使用errorbar和bar函数来添加数据点和误差线,并通过alpha参数来指定柱状图的透明度。
9. 使用ax.errorbar方法添加误差线
import matplotlib.pyplot as plt

fig, ax = plt.subplots()

x = [1, 2, 3, 4, 5]
y = [2, 3, 4, 5, 6]
y_err = [0.2, 0.3, 0.1, 0.4, 0.2]

ax.errorbar(x, y, yerr=y_err, fmt='o', ecolor='red', capsize=5)
plt.show()
Output:
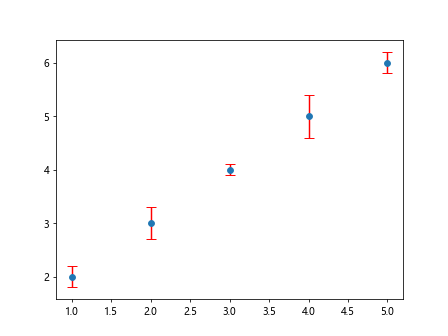
在上面的示例代码中,我们通过创建一个Figure对象和一个Axes对象,使用ax.errorbar方法来添加数据点和误差线到图表中。
10. 使用ax.errorbarh方法添加水平误差线
import matplotlib.pyplot as plt

fig, ax = plt.subplots()

x = [1, 2, 3, 4, 5]
y = [2, 3, 4, 5, 6]
x_err = [0.1, 0.2, 0.1, 0.2, 0.1]

ax.errorbarh(y, x, xerr=x_err, fmt='o', ecolor='green', capsize=5)
plt.show()
在上面的示例代码中,我们使用了ax.errorbarh方法来添加具有水平误差线的点到图表中。
通过以上示例代码,我们详细介绍了在matplotlib中如何添加误差线到图表中。误差线能够有效地展示数据的离散程度和可靠性,帮助观众更好地理解数据。利用matplotlib提供的errorbar函数和ax.errorbar方法,我们可以轻松地对数据点添加误差线,并灵活控制其样式和显示方式。
 极客笔记
极客笔记