Matplotlib散点图添加图例的全面指南
参考:How to add a legend to a scatter plot in Matplotlib
Matplotlib是Python中最流行的数据可视化库之一,它提供了强大的工具来创建各种类型的图表,包括散点图。在数据可视化中,散点图是一种常用的图表类型,用于展示两个变量之间的关系。而图例则是帮助读者理解图表内容的重要元素。本文将详细介绍如何在Matplotlib中为散点图添加图例,包括基本方法、自定义选项以及一些高级技巧。
1. 基本的散点图和图例
首先,让我们从创建一个基本的散点图开始,然后为其添加一个简单的图例。
import matplotlib.pyplot as plt
import numpy as np

# 生成示例数据
x = np.linspace(0, 10, 50)
y1 = np.sin(x)
y2 = np.cos(x)

# 创建散点图
plt.scatter(x, y1, label='Sin(x) - how2matplotlib.com')
plt.scatter(x, y2, label='Cos(x) - how2matplotlib.com')

# 添加图例
plt.legend()

# 设置标题和轴标签
plt.title('Sin and Cos Functions')
plt.xlabel('X-axis')
plt.ylabel('Y-axis')

# 显示图表
plt.show()
Output:
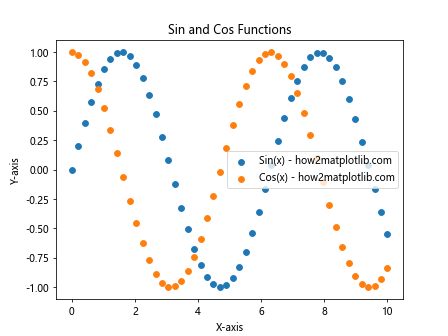
在这个例子中,我们使用plt.scatter()函数创建了两个散点图,分别表示正弦和余弦函数。通过设置label参数,我们为每个散点系列指定了标签。然后,我们使用plt.legend()函数添加图例。Matplotlib会自动使用我们设置的标签创建图例。
2. 自定义图例位置
默认情况下,Matplotlib会尝试将图例放置在最佳位置,以避免遮挡数据点。但有时我们可能想要更精确地控制图例的位置。
import matplotlib.pyplot as plt
import numpy as np

x = np.random.rand(50)
y = np.random.rand(50)

plt.scatter(x, y, label='Random Data - how2matplotlib.com')

# 自定义图例位置
plt.legend(loc='upper right')

plt.title('Scatter Plot with Custom Legend Location')
plt.xlabel('X-axis')
plt.ylabel('Y-axis')

plt.show()
Output:
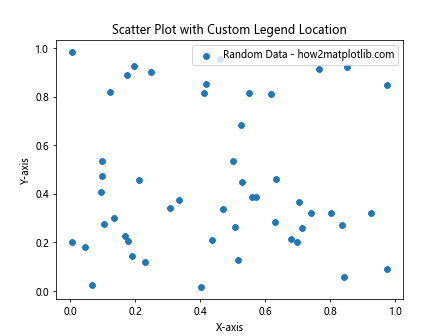
在这个例子中,我们使用loc参数指定图例的位置。常用的位置包括:’upper right’、’upper left’、’lower right’、’lower left’、’center’等。你也可以使用数字代码(0-10)来指定位置。
3. 多个数据系列的图例
当你有多个数据系列时,为每个系列添加不同的标签和样式可以使图表更加清晰。
import matplotlib.pyplot as plt
import numpy as np

x = np.linspace(0, 10, 50)
y1 = np.sin(x)
y2 = np.cos(x)
y3 = np.tan(x)

plt.scatter(x, y1, c='red', label='Sin(x) - how2matplotlib.com')
plt.scatter(x, y2, c='blue', label='Cos(x) - how2matplotlib.com')
plt.scatter(x, y3, c='green', label='Tan(x) - how2matplotlib.com')

plt.legend()

plt.title('Trigonometric Functions')
plt.xlabel('X-axis')
plt.ylabel('Y-axis')

plt.show()
Output:
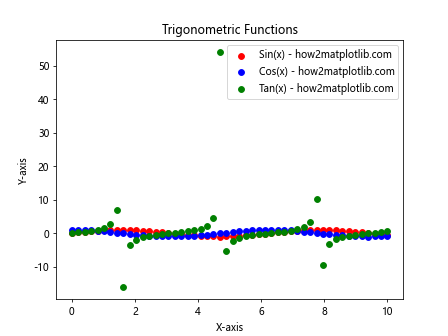
在这个例子中,我们为三个不同的三角函数创建了散点图,并为每个系列指定了不同的颜色和标签。
4. 自定义图例样式
Matplotlib允许我们自定义图例的各种属性,如字体大小、边框颜色、背景色等。
import matplotlib.pyplot as plt
import numpy as np

x = np.random.rand(50)
y = np.random.rand(50)

plt.scatter(x, y, label='Data - how2matplotlib.com')

plt.legend(fontsize=12,
           facecolor='lightgray',
           edgecolor='black',
           title='Legend Title',
           title_fontsize=14)

plt.title('Scatter Plot with Customized Legend')
plt.xlabel('X-axis')
plt.ylabel('Y-axis')

plt.show()
Output:
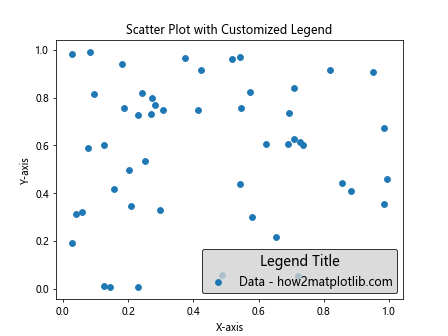
在这个例子中,我们自定义了图例的字体大小、背景色、边框颜色,并添加了一个标题。
5. 图例中使用不同的标记
有时,你可能想在图例中显示与实际数据点不同的标记。这可以通过创建自定义的图例元素来实现。
import matplotlib.pyplot as plt
import numpy as np

x = np.random.rand(50)
y = np.random.rand(50)

scatter = plt.scatter(x, y, c=y, cmap='viridis')

# 创建自定义图例元素
legend_element = plt.Line2D([0], [0], marker='o', color='w',
                            label='Data Points - how2matplotlib.com',
                            markerfacecolor='purple', markersize=10)

plt.legend(handles=[legend_element])

plt.title('Scatter Plot with Custom Legend Marker')
plt.xlabel('X-axis')
plt.ylabel('Y-axis')

plt.show()
Output:
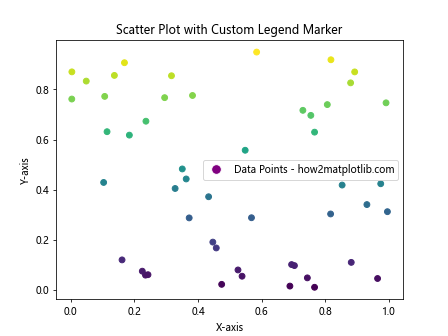
在这个例子中,我们使用plt.Line2D创建了一个自定义的图例元素,它使用紫色圆点作为标记。
6. 为散点图添加颜色条和图例
当散点图使用颜色映射来表示第三个维度的数据时,添加一个颜色条(colorbar)可以帮助理解颜色的含义。
import matplotlib.pyplot as plt
import numpy as np

x = np.random.rand(100)
y = np.random.rand(100)
colors = np.random.rand(100)

scatter = plt.scatter(x, y, c=colors, cmap='viridis', label='Data - how2matplotlib.com')

plt.colorbar(scatter, label='Color Value')

plt.legend()

plt.title('Scatter Plot with Colorbar and Legend')
plt.xlabel('X-axis')
plt.ylabel('Y-axis')

plt.show()
Output:
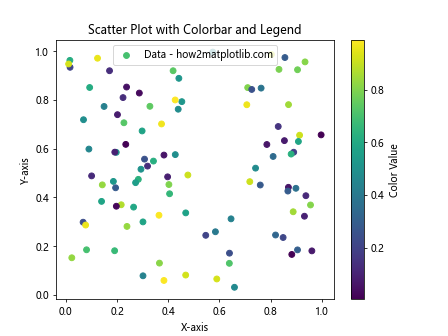
这个例子展示了如何同时添加颜色条和图例。颜色条显示了颜色值的范围,而图例则标识了数据点的含义。
7. 在图例中显示多个元素
有时,你可能需要在图例中显示多个元素,每个元素代表数据的不同方面。
import matplotlib.pyplot as plt
import numpy as np

x = np.random.rand(50)
y = np.random.rand(50)
sizes = np.random.rand(50) * 100

scatter = plt.scatter(x, y, s=sizes, c=y, cmap='viridis')

# 创建自定义图例元素
legend_elements = [plt.Line2D([0], [0], marker='o', color='w', label='Size - how2matplotlib.com',
                              markerfacecolor='gray', markersize=10),
                   plt.Line2D([0], [0], marker='o', color='w', label='Color - how2matplotlib.com',
                              markerfacecolor='purple', markersize=10)]

plt.legend(handles=legend_elements)

plt.colorbar(scatter, label='Color Value')

plt.title('Scatter Plot with Multiple Legend Elements')
plt.xlabel('X-axis')
plt.ylabel('Y-axis')

plt.show()
Output:
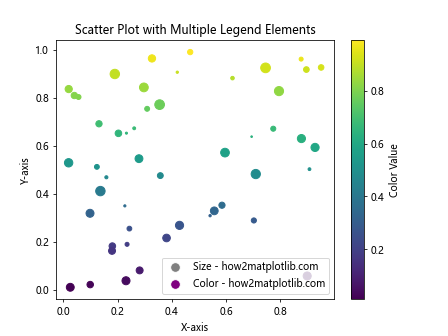
在这个例子中,我们创建了两个自定义的图例元素,一个表示点的大小,另一个表示点的颜色。
8. 使用图例分组数据
图例不仅可以用来标识不同的数据系列,还可以用来对数据进行分组。
import matplotlib.pyplot as plt
import numpy as np

np.random.seed(42)
x = np.random.rand(100)
y = np.random.rand(100)
colors = np.random.choice(['red', 'blue', 'green'], 100)
sizes = np.random.randint(20, 100, 100)

for color in ['red', 'blue', 'green']:
    mask = colors == color
    plt.scatter(x[mask], y[mask], c=color, s=sizes[mask],
                label=f'{color.capitalize()} Group - how2matplotlib.com', alpha=0.6)

plt.legend()

plt.title('Scatter Plot with Grouped Data')
plt.xlabel('X-axis')
plt.ylabel('Y-axis')

plt.show()
Output:
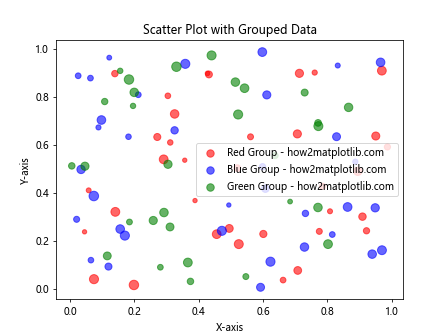
这个例子展示了如何使用不同的颜色对数据点进行分组,并在图例中显示这些分组。
9. 在图例中显示统计信息
有时,你可能想在图例中显示一些统计信息,比如每个组的平均值或数量。
import matplotlib.pyplot as plt
import numpy as np

np.random.seed(42)
x = np.random.rand(100)
y = np.random.rand(100)
groups = np.random.choice(['A', 'B', 'C'], 100)

for group in ['A', 'B', 'C']:
    mask = groups == group
    group_x = x[mask]
    group_y = y[mask]
    plt.scatter(group_x, group_y, label=f'Group {group} (n={sum(mask)}) - how2matplotlib.com')

plt.legend(title='Group (Sample Size)')

plt.title('Scatter Plot with Statistical Information in Legend')
plt.xlabel('X-axis')
plt.ylabel('Y-axis')

plt.show()
Output:
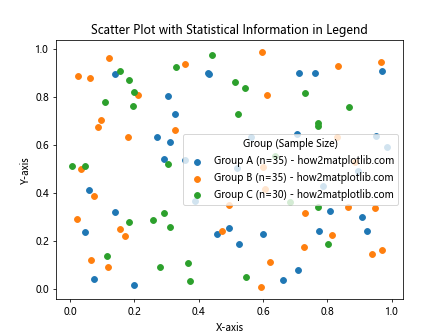
这个例子展示了如何在图例中显示每个组的样本大小。
10. 使用图例突出显示特定数据点
图例不仅可以用来解释不同的数据系列,还可以用来突出显示特定的数据点或区域。
import matplotlib.pyplot as plt
import numpy as np

x = np.linspace(0, 10, 100)
y = np.sin(x)

plt.scatter(x, y, label='Sin(x) - how2matplotlib.com')

# 突出显示最大值和最小值
max_index = np.argmax(y)
min_index = np.argmin(y)

plt.scatter(x[max_index], y[max_index], color='red', s=100,
            label='Maximum - how2matplotlib.com')
plt.scatter(x[min_index], y[min_index], color='blue', s=100,
            label='Minimum - how2matplotlib.com')

plt.legend()

plt.title('Sine Function with Highlighted Points')
plt.xlabel('X-axis')
plt.ylabel('Y-axis')

plt.show()
Output:
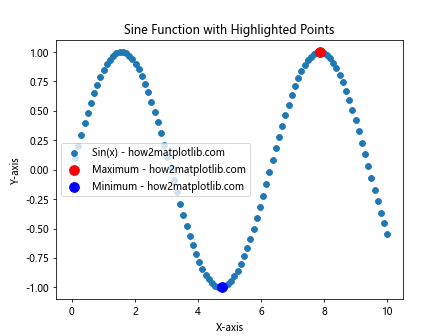
这个例子展示了如何使用不同的颜色和大小来突出显示最大值和最小值点,并在图例中解释这些特殊点的含义。
11. 使用图例显示拟合曲线
当你对散点图数据进行拟合时,可以使用图例来显示拟合曲线的信息。
import matplotlib.pyplot as plt
import numpy as np

# 生成带有噪声的数据
x = np.linspace(0, 10, 50)
y = 2 * x + 1 + np.random.normal(0, 1, 50)

# 绘制散点图
plt.scatter(x, y, label='Data - how2matplotlib.com')

# 进行线性拟合
coeffs = np.polyfit(x, y, 1)
poly = np.poly1d(coeffs)

# 绘制拟合线
plt.plot(x, poly(x), color='red',
         label=f'Fit: y={coeffs[0]:.2f}x + {coeffs[1]:.2f} - how2matplotlib.com')

plt.legend()

plt.title('Scatter Plot with Fitted Line')
plt.xlabel('X-axis')
plt.ylabel('Y-axis')

plt.show()
Output:
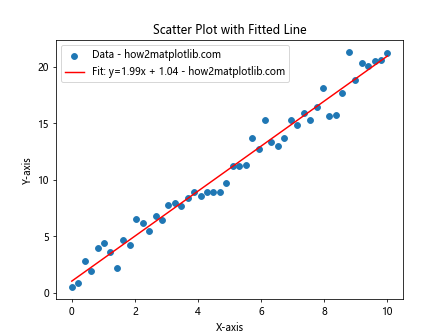
这个例子展示了如何在散点图上添加拟合线,并在图例中显示拟合方程。
12. 使用图例显示置信区间
在某些情况下,你可能想要显示数据的置信区间或误差范围。图例可以用来解释这些额外的信息。
import matplotlib.pyplot as plt
import numpy as np

x = np.linspace(0, 10, 50)
y = np.sin(x) + np.random.normal(0, 0.1, 50)

plt.scatter(x, y, label='Data - how2matplotlib.com')

# 计算平均值和标准差
mean = np.mean(y)
std = np.std(y)

# 绘制平均值线和置信区间
plt.axhline(mean, color='red', linestyle='--', label='Mean - how2matplotlib.com')
plt.fill_between(x, mean-std, mean+std, alpha=0.2, color='gray',
                 label='1 Std Dev - how2matplotlib.com')

plt.legend()

plt.title('Scatter Plot with Confidence Interval')
plt.xlabel('X-axis')
plt.ylabel('Y-axis')

plt.show()
Output:
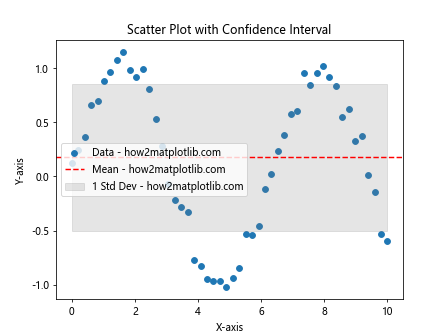
这个例子展示了如何添加平均值线和一个标准差的置信区间,并在图例中解释这些元素。
13. 使用图例显示数据密度
当数据点非常多时,可能会出现重叠,使得难以判断数据的密度。在这种情况下,可以使用颜色来表示密度,并在图例中解释。
import matplotlib.pyplot as plt
import numpy as np
from scipy.stats import gaussian_kde

# 生成大量数据点
np.random.seed(42)
x = np.random.normal(0, 1, 1000)
y = x * 0.5 + np.random.normal(0, 1, 1000)

# 计算点密度
xy = np.vstack([x,y])
z = gaussian_kde(xy)(xy)

# 绘制散点图,颜色表示密度
scatter = plt.scatter(x, y, c=z, s=50, alpha=0.5, cmap='viridis',
                      label='Data Density - how2matplotlib.com')

plt.colorbar(scatter, label='Density')

plt.legend()

plt.title('Scatter Plot with Density Visualization')
plt.xlabel('X-axis')
plt.ylabel('Y-axis')

plt.show()
Output:
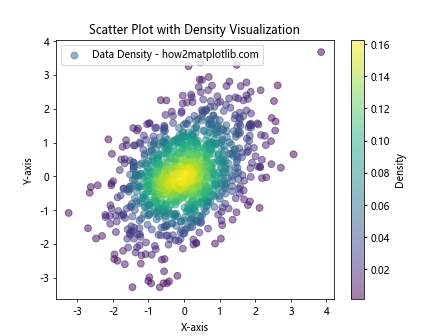
这个例子展示了如何使用颜色来表示数据点的密度,并在图例和颜色条中解释这一信息。
14. 使用图例显示多个子图
当你有多个相关的散点图时,可以使用子图来并排显示它们,并使用一个共享的图例来解释所有图表。
import matplotlib.pyplot as plt
import numpy as np

# 创建示例数据
x = np.linspace(0, 10, 50)
y1 = np.sin(x)
y2 = np.cos(x)
y3 = np.tan(x)

# 创建3个子图
fig, (ax1, ax2, ax3) = plt.subplots(1, 3, figsize=(15, 5))

# 在每个子图上绘制散点图
scatter1 = ax1.scatter(x, y1, c='red', label='Sin(x) - how2matplotlib.com')
scatter2 = ax2.scatter(x, y2, c='blue', label='Cos(x) - how2matplotlib.com')
scatter3 = ax3.scatter(x, y3, c='green', label='Tan(x) - how2matplotlib.com')

# 设置每个子图的标题
ax1.set_title('Sine Function')
ax2.set_title('Cosine Function')
ax3.set_title('Tangent Function')

# 创建一个共享的图例
fig.legend(loc='lower center', ncol=3, bbox_to_anchor=(0.5, -0.05))

plt.tight_layout()
plt.show()
Output:
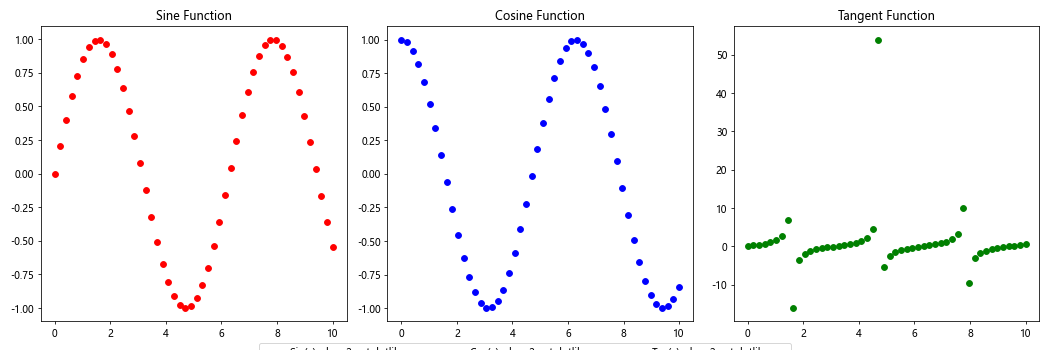
这个例子展示了如何创建多个子图,每个子图包含一个散点图,并使用一个共享的图例来解释所有图表。
15. 使用图例显示数据分类
当你的散点图包含不同类别的数据时,可以使用图例来解释这些类别。
import matplotlib.pyplot as plt
import numpy as np

# 生成示例数据
np.random.seed(42)
n_points = 200
x = np.random.randn(n_points)
y = np.random.randn(n_points)
categories = np.random.choice(['A', 'B', 'C'], n_points)

# 为每个类别定义颜色
colors = {'A': 'red', 'B': 'blue', 'C': 'green'}

# 绘制散点图
for category in colors:
    mask = categories == category
    plt.scatter(x[mask], y[mask], c=colors[category], label=f'Category {category} - how2matplotlib.com', alpha=0.6)

plt.legend()

plt.title('Scatter Plot with Categorized Data')
plt.xlabel('X-axis')
plt.ylabel('Y-axis')

plt.show()
Output:
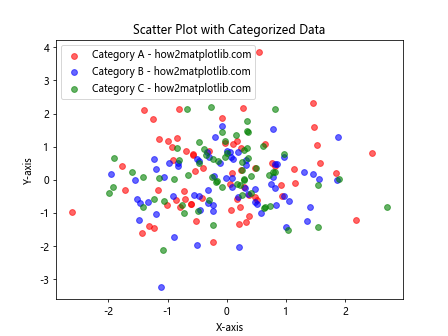
这个例子展示了如何使用不同的颜色来表示不同的数据类别,并在图例中解释这些类别。
16. 使用图例显示数据趋势
当你想要在散点图中显示数据的整体趋势时,可以添加趋势线并在图例中解释。
import matplotlib.pyplot as plt
import numpy as np
from scipy import stats

# 生成示例数据
np.random.seed(42)
x = np.linspace(0, 10, 50)
y = 2 * x + 1 + np.random.normal(0, 2, 50)

# 绘制散点图
plt.scatter(x, y, label='Data Points - how2matplotlib.com')

# 计算趋势线
slope, intercept, r_value, p_value, std_err = stats.linregress(x, y)
line = slope * x + intercept

# 绘制趋势线
plt.plot(x, line, color='red', label=f'Trend Line (R² = {r_value**2:.2f}) - how2matplotlib.com')

plt.legend()

plt.title('Scatter Plot with Trend Line')
plt.xlabel('X-axis')
plt.ylabel('Y-axis')

plt.show()
Output:
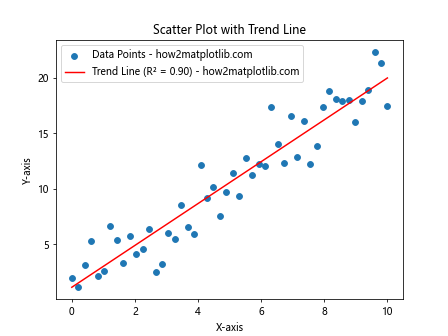
这个例子展示了如何添加趋势线并在图例中显示R²值来表示拟合程度。
17. 使用图例显示数据聚类
当你对散点图数据进行聚类分析时,可以使用图例来解释不同的聚类。
import matplotlib.pyplot as plt
import numpy as np
from sklearn.cluster import KMeans

# 生成示例数据
np.random.seed(42)
x = np.random.randn(200, 2)

# 进行K-means聚类
kmeans = KMeans(n_clusters=3)
kmeans.fit(x)
labels = kmeans.labels_

# 绘制散点图
plt.scatter(x[:, 0], x[:, 1], c=labels, cmap='viridis',
            label='Data Points - how2matplotlib.com')

# 绘制聚类中心
centers = kmeans.cluster_centers_
plt.scatter(centers[:, 0], centers[:, 1], c='red', s=200, alpha=0.5,
            label='Cluster Centers - how2matplotlib.com')

plt.legend()

plt.title('Scatter Plot with K-means Clustering')
plt.xlabel('X-axis')
plt.ylabel('Y-axis')

plt.show()
Output:
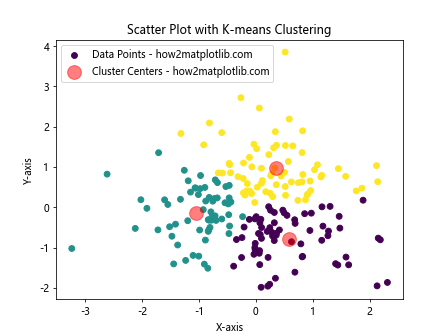
这个例子展示了如何对数据进行K-means聚类,并在图例中解释数据点和聚类中心。
18. 使用图例显示数据的时间演变
当你的散点图数据包含时间信息时,可以使用颜色来表示时间的变化,并在图例中解释。
import matplotlib.pyplot as plt
import numpy as np
from matplotlib.colors import LinearSegmentedColormap

# 生成示例数据
np.random.seed(42)
n_points = 100
x = np.cumsum(np.random.randn(n_points))
y = np.cumsum(np.random.randn(n_points))
time = np.arange(n_points)

# 创建自定义颜色映射
colors = ['blue', 'green', 'yellow', 'red']
n_bins = 100
cmap = LinearSegmentedColormap.from_list('custom', colors, N=n_bins)

# 绘制散点图
scatter = plt.scatter(x, y, c=time, cmap=cmap,
                      label='Data Points - how2matplotlib.com')

plt.colorbar(scatter, label='Time')

plt.legend()

plt.title('Scatter Plot Showing Data Evolution Over Time')
plt.xlabel('X-axis')
plt.ylabel('Y-axis')

plt.show()
Output:
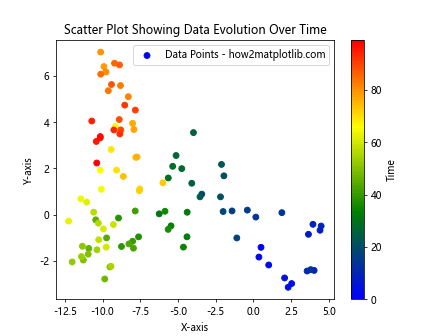
这个例子展示了如何使用颜色来表示数据点随时间的变化,并使用颜色条和图例来解释这一信息。
19. 使用图例显示数据的不确定性
当你的数据点包含不确定性或误差范围时,可以使用误差条来表示,并在图例中解释。
import matplotlib.pyplot as plt
import numpy as np

# 生成示例数据
np.random.seed(42)
x = np.linspace(0, 10, 10)
y = np.sin(x) + np.random.normal(0, 0.1, 10)
yerr = np.random.uniform(0.05, 0.2, 10)

# 绘制带有误差条的散点图
plt.errorbar(x, y, yerr=yerr, fmt='o', label='Data with Error - how2matplotlib.com')

# 绘制真实的正弦函数
x_true = np.linspace(0, 10, 100)
y_true = np.sin(x_true)
plt.plot(x_true, y_true, 'r-', label='True Sin Function - how2matplotlib.com')

plt.legend()

plt.title('Scatter Plot with Error Bars')
plt.xlabel('X-axis')
plt.ylabel('Y-axis')

plt.show()
Output:
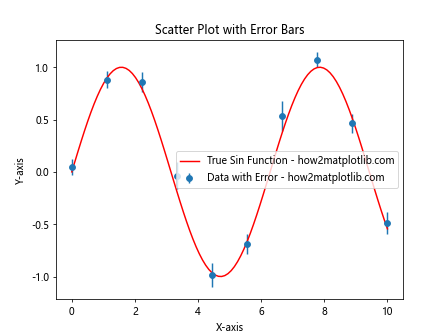
这个例子展示了如何添加误差条来表示数据点的不确定性,并在图例中解释数据点和真实函数。
20. 使用图例显示数据的多个特征
当你的散点图需要同时显示多个特征时,可以使用不同的视觉元素(如颜色、大小、形状)来表示这些特征,并在图例中解释。
import matplotlib.pyplot as plt
import numpy as np

# 生成示例数据
np.random.seed(42)
n_points = 50
x = np.random.rand(n_points)
y = np.random.rand(n_points)
sizes = np.random.randint(20, 200, n_points)
colors = np.random.rand(n_points)
shapes = np.random.choice(['o', 's', '^', 'D'], n_points)

# 绘制散点图
for shape in set(shapes):
    mask = shapes == shape
    scatter = plt.scatter(x[mask], y[mask], s=sizes[mask], c=colors[mask],
                          marker=shape, cmap='viridis', alpha=0.7)

# 添加颜色条
plt.colorbar(scatter, label='Color Value')

# 创建自定义图例
legend_elements = [
    plt.Line2D([0], [0], marker='o', color='w', label='Circle - how2matplotlib.com',
               markerfacecolor='gray', markersize=10),
    plt.Line2D([0], [0], marker='s', color='w', label='Square - how2matplotlib.com',
               markerfacecolor='gray', markersize=10),
    plt.Line2D([0], [0], marker='^', color='w', label='Triangle - how2matplotlib.com',
               markerfacecolor='gray', markersize=10),
    plt.Line2D([0], [0], marker='D', color='w', label='Diamond - how2matplotlib.com',
               markerfacecolor='gray', markersize=10),
    plt.Line2D([0], [0], marker='o', color='w', label='Size - how2matplotlib.com',
               markerfacecolor='gray', markersize=5),
    plt.Line2D([0], [0], marker='o', color='w', label='Size - how2matplotlib.com',
               markerfacecolor='gray', markersize=15)
]

plt.legend(handles=legend_elements, title='Shape and Size')

plt.title('Scatter Plot with Multiple Features')
plt.xlabel('X-axis')
plt.ylabel('Y-axis')

plt.show()
Output:
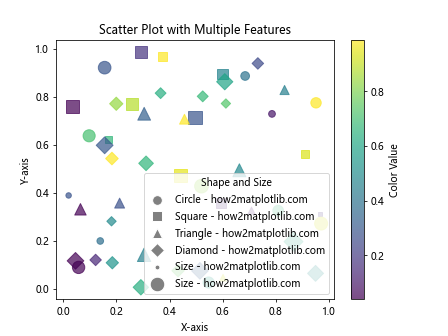
这个例子展示了如何使用不同的形状、大小和颜色来表示数据点的多个特征,并在图例和颜色条中解释这些特征。
结论
在Matplotlib中为散点图添加图例是一个强大的工具,可以大大提高图表的可读性和信息量。通过本文介绍的各种技巧,你可以创建出既美观又信息丰富的散点图。记住,好的图例应该清晰、简洁,并且能够有效地解释图表中的关键信息。在实际应用中,你可能需要根据具体的数据和目标来选择最合适的图例样式和内容。通过实践和调整,你将能够掌握创建优秀散点图和图例的技巧,从而更好地展示和解释你的数据。
 极客笔记
极客笔记