Matplotlib中隐藏坐标轴边框和白色空间的全面指南
参考:Hide Axis Borders and White Spaces in Matplotlib
Matplotlib是Python中最流行的数据可视化库之一,它提供了丰富的功能来创建各种类型的图表和绘图。在创建图表时,有时我们需要隐藏坐标轴边框和白色空间,以使图表更加简洁和美观。本文将详细介绍如何在Matplotlib中隐藏坐标轴边框和白色空间,并提供多个示例代码来帮助您更好地理解和应用这些技术。
1. 隐藏坐标轴边框
在Matplotlib中,坐标轴边框是指围绕图表的四条线。有时,我们可能希望隐藏这些边框,以使图表看起来更加简洁。以下是几种隐藏坐标轴边框的方法:
1.1 使用spines属性
我们可以使用spines属性来控制坐标轴边框的可见性。每个边框都有一个对应的spine对象,我们可以通过设置其visible属性来隐藏它。
import matplotlib.pyplot as plt
import numpy as np

# 创建数据
x = np.linspace(0, 10, 100)
y = np.sin(x)

# 创建图表
fig, ax = plt.subplots()
ax.plot(x, y, label='sin(x)')

# 隐藏所有边框
for spine in ax.spines.values():
    spine.set_visible(False)

ax.set_title('How to hide axis borders - how2matplotlib.com')
ax.legend()
plt.show()
Output:
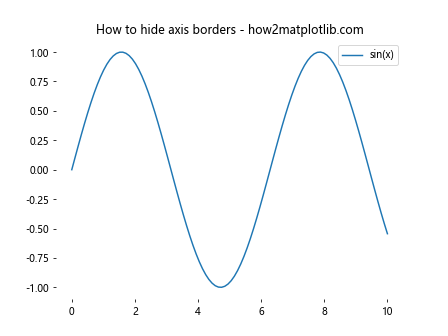
在这个示例中,我们使用循环遍历所有的spine对象,并将它们的visible属性设置为False,从而隐藏所有边框。
1.2 使用axis方法
另一种隐藏坐标轴边框的方法是使用axis方法。我们可以通过设置axis参数为'off'来隐藏所有的坐标轴和边框。
import matplotlib.pyplot as plt
import numpy as np

# 创建数据
x = np.linspace(0, 10, 100)
y = np.cos(x)

# 创建图表
fig, ax = plt.subplots()
ax.plot(x, y, label='cos(x)')

# 隐藏所有坐标轴和边框
ax.axis('off')

ax.set_title('Hide all axes and borders - how2matplotlib.com')
ax.legend()
plt.show()
Output:
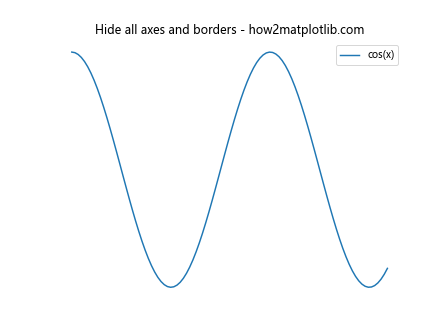
这个方法会同时隐藏坐标轴和边框,使图表看起来更加简洁。
1.3 选择性隐藏边框
有时,我们可能只想隐藏某些边框,而保留其他边框。我们可以通过单独设置每个spine的可见性来实现这一点。
import matplotlib.pyplot as plt
import numpy as np

# 创建数据
x = np.linspace(0, 10, 100)
y = np.tan(x)

# 创建图表
fig, ax = plt.subplots()
ax.plot(x, y, label='tan(x)')

# 隐藏上边框和右边框
ax.spines['top'].set_visible(False)
ax.spines['right'].set_visible(False)

ax.set_title('Hide top and right borders - how2matplotlib.com')
ax.legend()
plt.show()
Output:
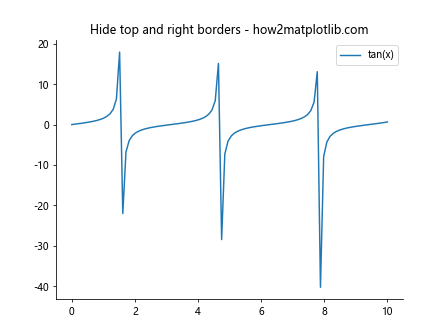
在这个示例中,我们只隐藏了上边框和右边框,保留了下边框和左边框,这是一种常见的图表样式。
2. 移除白色空间
白色空间是指图表周围的空白区域。有时,我们可能希望移除这些空白区域,使图表更加紧凑。以下是几种移除白色空间的方法:
2.1 使用tight_layout()
tight_layout()函数可以自动调整子图参数,以给定的填充适应图形区域。这可以有效地减少图表周围的白色空间。
import matplotlib.pyplot as plt
import numpy as np

# 创建数据
x = np.linspace(0, 10, 100)
y1 = np.sin(x)
y2 = np.cos(x)

# 创建图表
fig, (ax1, ax2) = plt.subplots(2, 1, figsize=(8, 6))
ax1.plot(x, y1, label='sin(x)')
ax2.plot(x, y2, label='cos(x)')

ax1.set_title('Sin function - how2matplotlib.com')
ax2.set_title('Cos function - how2matplotlib.com')

ax1.legend()
ax2.legend()

# 应用tight_layout
plt.tight_layout()

plt.show()
Output:
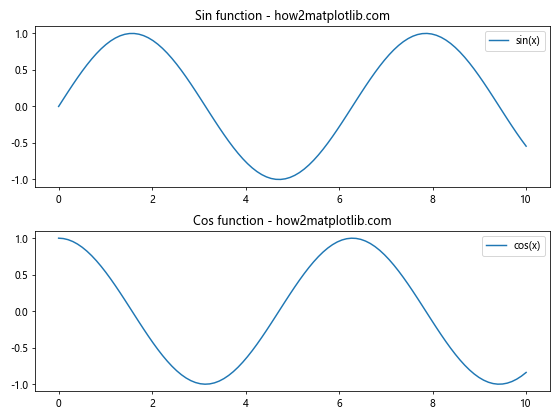
在这个示例中,我们创建了两个子图,并使用tight_layout()函数来自动调整它们的布局,减少白色空间。
2.2 调整子图参数
我们可以通过调整子图参数来手动控制图表周围的空白区域。subplots_adjust()函数允许我们设置左、右、上、下、子图之间的间距等参数。
import matplotlib.pyplot as plt
import numpy as np

# 创建数据
x = np.linspace(0, 10, 100)
y = np.exp(x)

# 创建图表
fig, ax = plt.subplots()
ax.plot(x, y, label='exp(x)')

# 调整子图参数
plt.subplots_adjust(left=0.05, right=0.95, top=0.95, bottom=0.05)

ax.set_title('Exponential function - how2matplotlib.com')
ax.legend()

plt.show()
Output:
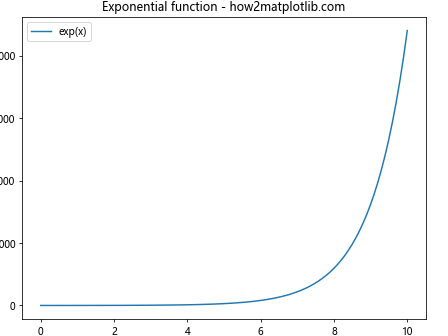
在这个示例中,我们使用subplots_adjust()函数来减少图表周围的白色空间,使图表更加紧凑。
2.3 使用bbox_inches参数保存图表
当保存图表时,我们可以使用bbox_inches='tight'参数来自动裁剪白色空间。
import matplotlib.pyplot as plt
import numpy as np

# 创建数据
x = np.linspace(0, 10, 100)
y = np.log(x)

# 创建图表
fig, ax = plt.subplots()
ax.plot(x, y, label='log(x)')

ax.set_title('Logarithmic function - how2matplotlib.com')
ax.legend()

# 保存图表,自动裁剪白色空间
plt.savefig('log_function.png', bbox_inches='tight')
plt.show()
Output:
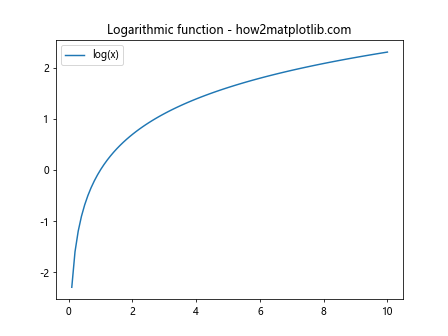
这个方法在保存图表时特别有用,可以确保保存的图像不包含多余的白色空间。
3. 结合隐藏边框和移除白色空间
我们可以结合上述技术来创建更加简洁和紧凑的图表。以下是一些综合示例:
3.1 创建无边框、紧凑的散点图
import matplotlib.pyplot as plt
import numpy as np

# 创建数据
np.random.seed(42)
x = np.random.rand(50)
y = np.random.rand(50)

# 创建图表
fig, ax = plt.subplots()
ax.scatter(x, y, alpha=0.5)

# 隐藏所有边框
for spine in ax.spines.values():
    spine.set_visible(False)

# 隐藏刻度
ax.tick_params(left=False, bottom=False, labelleft=False, labelbottom=False)

ax.set_title('Scatter plot without borders - how2matplotlib.com')

# 应用tight_layout
plt.tight_layout()

plt.show()
Output:
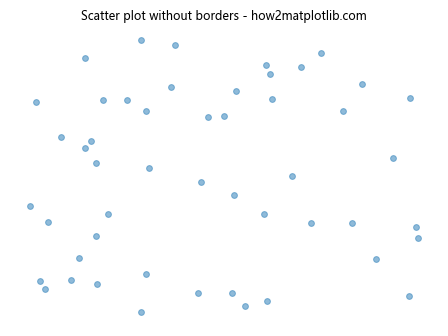
这个示例创建了一个无边框、无刻度的散点图,并使用tight_layout()来减少白色空间。
3.2 创建简洁的柱状图
import matplotlib.pyplot as plt
import numpy as np

# 创建数据
categories = ['A', 'B', 'C', 'D', 'E']
values = np.random.randint(1, 100, 5)

# 创建图表
fig, ax = plt.subplots()
ax.bar(categories, values)

# 隐藏上边框和右边框
ax.spines['top'].set_visible(False)
ax.spines['right'].set_visible(False)

# 只保留底部刻度
ax.tick_params(left=False, labelleft=False)

ax.set_title('Simple bar chart - how2matplotlib.com')

# 调整子图参数
plt.subplots_adjust(left=0.05, right=0.95, top=0.95, bottom=0.1)

plt.show()
Output:
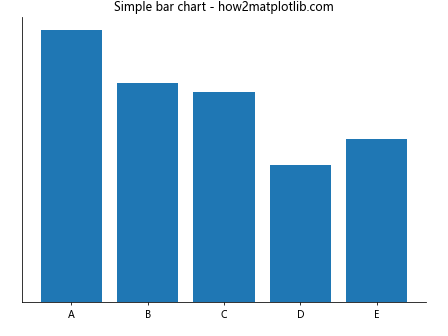
这个示例创建了一个简洁的柱状图,隐藏了上边框和右边框,并调整了子图参数以减少白色空间。
3.3 创建无边框的饼图
import matplotlib.pyplot as plt

# 创建数据
sizes = [30, 25, 20, 15, 10]
labels = ['A', 'B', 'C', 'D', 'E']

# 创建图表
fig, ax = plt.subplots()
ax.pie(sizes, labels=labels, autopct='%1.1f%%', startangle=90)

# 隐藏所有边框
ax.axis('off')

ax.set_title('Pie chart without borders - how2matplotlib.com')

# 应用tight_layout
plt.tight_layout()

plt.show()
Output:
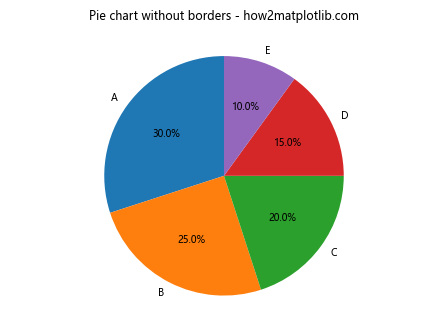
这个示例创建了一个无边框的饼图,并使用tight_layout()来减少白色空间。
4. 高级技巧
除了基本的隐藏边框和移除白色空间的方法,还有一些高级技巧可以帮助我们创建更加精美的图表:
4.1 使用constrained_layout
constrained_layout是一个更高级的自动布局调整工具,它可以处理更复杂的图表布局。
import matplotlib.pyplot as plt
import numpy as np

# 创建数据
x = np.linspace(0, 10, 100)
y1 = np.sin(x)
y2 = np.cos(x)

# 创建图表
fig, (ax1, ax2) = plt.subplots(1, 2, figsize=(10, 4), constrained_layout=True)
ax1.plot(x, y1)
ax2.plot(x, y2)

ax1.set_title('Sin function - how2matplotlib.com')
ax2.set_title('Cos function - how2matplotlib.com')

# 隐藏上边框和右边框
for ax in (ax1, ax2):
    ax.spines['top'].set_visible(False)
    ax.spines['right'].set_visible(False)

plt.show()
Output:
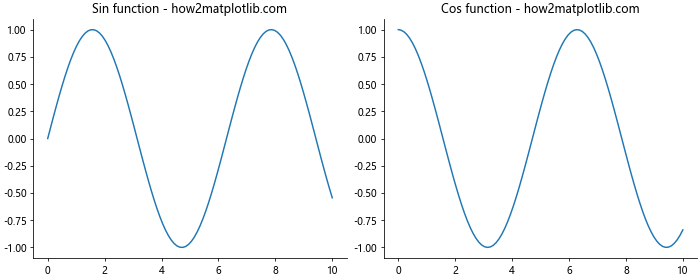
在这个示例中,我们使用constrained_layout=True来自动调整子图的布局,同时隐藏了上边框和右边框。
4.2 使用GridSpec创建复杂布局
对于更复杂的图表布局,我们可以使用GridSpec来精确控制子图的位置和大小。
import matplotlib.pyplot as plt
import matplotlib.gridspec as gridspec
import numpy as np

# 创建数据
x = np.linspace(0, 10, 100)
y1 = np.sin(x)
y2 = np.cos(x)
y3 = np.tan(x)

# 创建图表
fig = plt.figure(figsize=(12, 8))
gs = gridspec.GridSpec(2, 2, figure=fig)

ax1 = fig.add_subplot(gs[0, 0])
ax2 = fig.add_subplot(gs[0, 1])
ax3 = fig.add_subplot(gs[1, :])

ax1.plot(x, y1)
ax2.plot(x, y2)
ax3.plot(x, y3)

ax1.set_title('Sin function - how2matplotlib.com')
ax2.set_title('Cos function - how2matplotlib.com')
ax3.set_title('Tan function - how2matplotlib.com')

# 隐藏所有边框
for ax in (ax1, ax2, ax3):
    for spine in ax.spines.values():
        spine.set_visible(False)

# 应用tight_layout
plt.tight_layout()

plt.show()
Output:
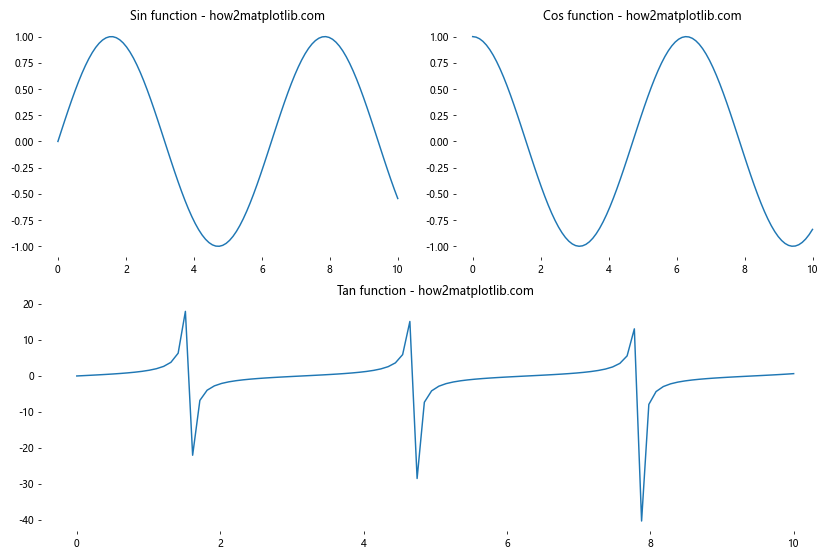
这个示例使用GridSpec创建了一个复杂的布局,包含三个子图,并隐藏了所有边框。
4.3 使用seaborn风格
Seaborn是基于Matplotlib的统计数据可视化库,它提供了一些预设的样式,可以轻松创建美观的图表。
import matplotlib.pyplot as plt
import seaborn as sns
import numpy as np

# 设置seaborn风格
sns.set_style("whitegrid")

# 创建数据
x = np.linspace(0, 10, 100)
y = np.sin(x) * np.exp(-0.1 * x)

# 创建图表
fig, ax = plt.subplots(figsize=(10, 6))
ax.plot(x, y)

ax.set_title('Damped sine wave - how2matplotlib.com')

# 移除上边框和右边框
sns.despine()

plt.tight_layout()
plt.show()
Output:
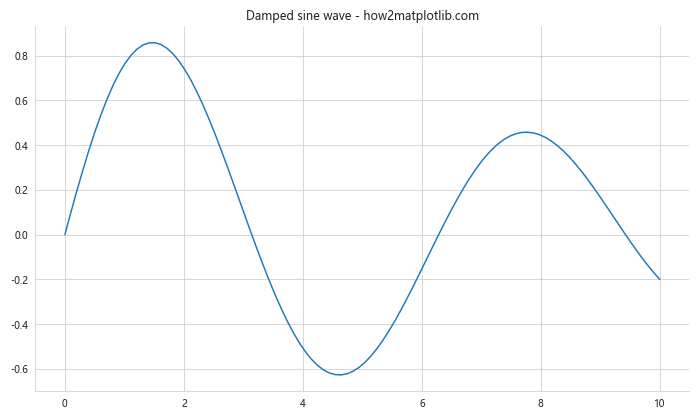
这个示例使用Seaborn的whitegrid风格和despine()函数来创建一个简洁的图表。
5. 注意事项和最佳实践
在隐藏坐标轴边框和移除白色空间时,有一些注意事项和最佳实践需要考虑:
- 保持一致性:在同一个项目或报告中,保持图表样式的一致性很重要。如果决定隐藏某些边框,应该在所有相关图表中保持一致。
-
考虑可读性:虽然隐藏边框和减少白色空间可以使图表更加简洁,但要确保不会影响图表的可读性。确保标签、标题和图例仍然清晰可见。
-
适度使用:不是所有的图表都需要隐藏边框或移除白色空间。根据具体情况和目标受众来决定是否使用这些技术。
-
考虑输出格式:如果图表将被打印或嵌入到其他文档中,要确保在不同背景下图表仍然清晰可见。
-
使用版本控制:在对图表样式进行重大更改时,使用版本控制可以帮助您跟踪更改并在需要时恢复到之前的版本。
以下是一些额外的示例,展示了如何在实际应用中结合这些技术和最佳实践:
5.1 创建简洁的时间序列图
import matplotlib.pyplot as plt
import pandas as pd
import numpy as np

# 创建时间序列数据
dates = pd.date_range(start='2023-01-01', end='2023-12-31', freq='D')
values = np.cumsum(np.random.randn(len(dates))) + 100

# 创建图表
fig, ax = plt.subplots(figsize=(12, 6))
ax.plot(dates, values)

# 设置标题和标签
ax.set_title('Stock Price Simulation - how2matplotlib.com', fontsize=16)
ax.set_xlabel('Date', fontsize=12)
ax.set_ylabel('Price', fontsize=12)

# 隐藏上边框和右边框
ax.spines['top'].set_visible(False)
ax.spines['right'].set_visible(False)

# 设置刻度样式
ax.tick_params(axis='both', which='major', labelsize=10)

# 添加网格线
ax.grid(True, linestyle='--', alpha=0.7)

plt.tight_layout()
plt.show()
Output:
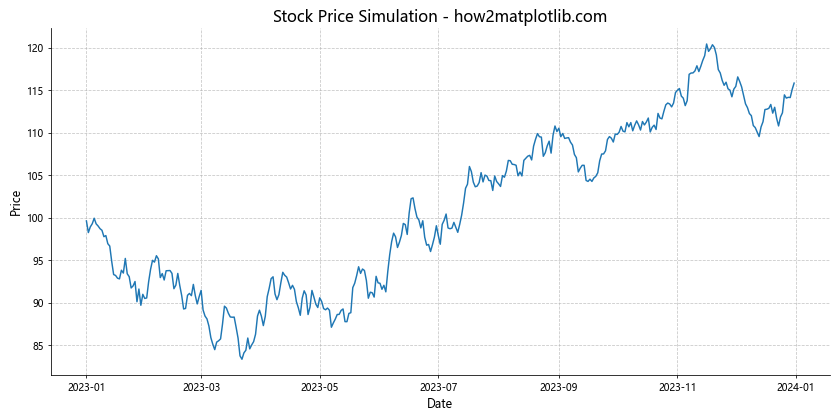
这个示例创建了一个简洁的时间序列图,隐藏了上边框和右边框,同时保留了清晰的标签和网格线以提高可读性。
5.2 创建多子图比较
import matplotlib.pyplot as plt
import numpy as np

# 创建数据
x = np.linspace(0, 10, 100)
y1 = np.sin(x)
y2 = np.cos(x)
y3 = np.tan(x)
y4 = np.exp(x)

# 创建图表
fig, axs = plt.subplots(2, 2, figsize=(12, 10))
fig.suptitle('Trigonometric and Exponential Functions - how2matplotlib.com', fontsize=16)

# 绘制子图
axs[0, 0].plot(x, y1)
axs[0, 0].set_title('Sin(x)')
axs[0, 1].plot(x, y2)
axs[0, 1].set_title('Cos(x)')
axs[1, 0].plot(x, y3)
axs[1, 0].set_title('Tan(x)')
axs[1, 1].plot(x, y4)
axs[1, 1].set_title('Exp(x)')

# 设置样式
for ax in axs.flat:
    # 隐藏上边框和右边框
    ax.spines['top'].set_visible(False)
    ax.spines['right'].set_visible(False)
    # 添加网格线
    ax.grid(True, linestyle='--', alpha=0.7)
    # 设置刻度样式
    ax.tick_params(axis='both', which='major', labelsize=8)

plt.tight_layout()
plt.show()
Output:
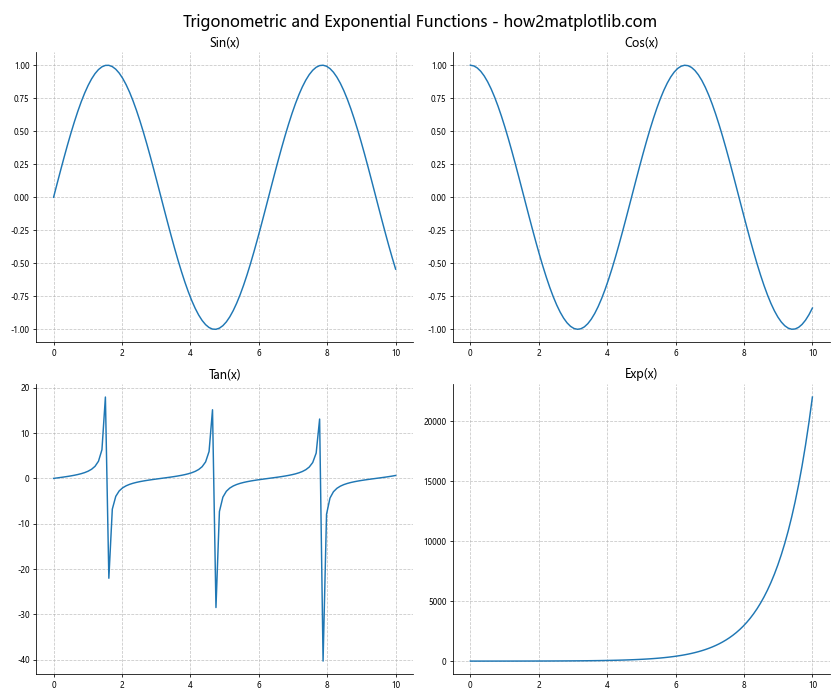
这个示例创建了一个包含四个子图的比较图,每个子图都采用了相同的简洁样式,保持了整体的一致性。
5.3 创建自定义样式的柱状图
import matplotlib.pyplot as plt
import numpy as np

# 创建数据
categories = ['A', 'B', 'C', 'D', 'E']
values = np.random.randint(50, 100, 5)

# 创建图表
fig, ax = plt.subplots(figsize=(10, 6))

# 绘制柱状图
bars = ax.bar(categories, values, color='skyblue', edgecolor='navy')

# 添加数值标签
for bar in bars:
    height = bar.get_height()
    ax.text(bar.get_x() + bar.get_width()/2., height,
            f'{height}',
            ha='center', va='bottom')

# 设置标题和标签
ax.set_title('Custom Bar Chart - how2matplotlib.com', fontsize=16)
ax.set_xlabel('Categories', fontsize=12)
ax.set_ylabel('Values', fontsize=12)

# 隐藏所有边框
for spine in ax.spines.values():
    spine.set_visible(False)

# 只保留底部刻度
ax.tick_params(left=False, labelleft=False)
ax.tick_params(bottom=True, labelbottom=True)

# 添加水平网格线
ax.yaxis.grid(True, linestyle='--', alpha=0.7)

plt.tight_layout()
plt.show()
Output:
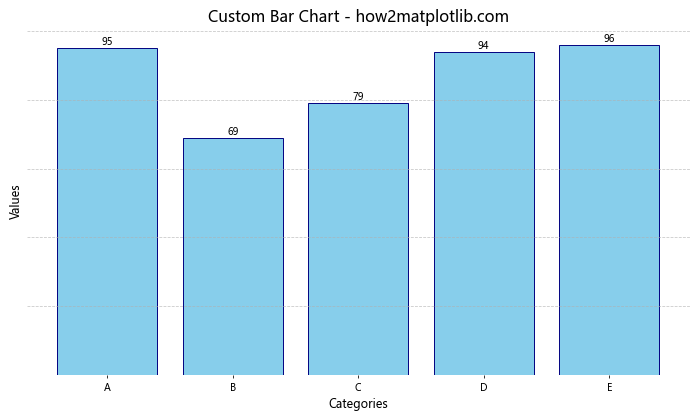
这个示例创建了一个自定义样式的柱状图,隐藏了所有边框,只保留了底部刻度,并添加了数值标签和水平网格线,以提高可读性。
6. 总结
在Matplotlib中隐藏坐标轴边框和白色空间是创建简洁、专业图表的重要技巧。通过本文介绍的各种方法和技术,您可以:
- 使用
spines属性或axis方法隐藏坐标轴边框 - 使用
tight_layout()、subplots_adjust()或bbox_inches='tight'参数移除白色空间 - 结合这些技术创建更加紧凑和美观的图表
- 使用高级技巧如
constrained_layout、GridSpec和Seaborn样式来进一步优化图表布局和样式 - 遵循最佳实践,确保图表的一致性、可读性和适用性
记住,图表设计的目标是清晰、有效地传达信息。隐藏边框和移除白色空间应该服务于这个目标,而不是成为自身的目的。根据具体的数据、受众和展示环境,灵活运用这些技巧,创建既美观又实用的数据可视化作品。
通过实践和经验,您将能够熟练掌握这些技巧,并在适当的时候应用它们,以创建出既专业又富有吸引力的图表。无论是用于学术论文、商业报告还是数据新闻,这些技能都将帮助您的数据可视化作品脱颖而出。
最后,不要忘记Matplotlib的强大和灵活性。本文介绍的技巧只是冰山一角,您可以继续探索更多高级功能和自定义选项,以满足各种复杂的数据可视化需求。持续学习和实验将帮助您不断提升数据可视化技能,创造出更加出色的图表作品。
 极客笔记
极客笔记