diverging colormaps matplotlib
参考:diverging colormaps matplotlib
在Matplotlib中,colormap是用于将数据映射到颜色空间的工具,它可以帮助我们更直观地理解数据趋势和差异。在这篇文章中,我们将重点介绍diverging colormaps,这种colormap可以突出数据集中的两个极端值,并清晰地显示它们之间的变化趋势。
1. 创建一个简单的diverging colormap
首先,让我们创建一个简单的diverging colormap来展示数据的变化。我们可以使用ListedColormap来实现这一目的。
import matplotlib.pyplot as plt
from matplotlib.colors import ListedColormap

colors = ['blue', 'white', 'red']
cmap = ListedColormap(colors)

data = [1, 2, 3, 4, 5]
plt.scatter(range(len(data)), data, c=data, cmap=cmap)
plt.colorbar()
plt.show()
Output:

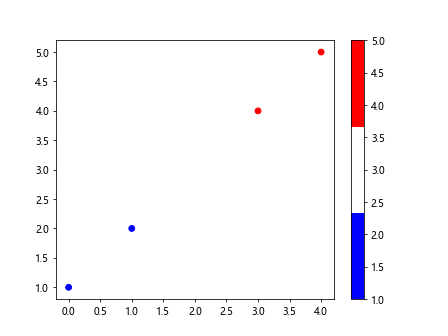
在这个示例代码中,我们定义了一个包含三种颜色的colors列表,并使用ListedColormap创建了一个diverging colormap。接着,我们绘制了一个散点图,并将数据用颜色来表示。
2. 使用seaborn库中的diverging colormap
除了Matplotlib自带的colormap外,我们还可以使用Seaborn库中提供的diverging colormap来可视化数据。Seaborn库中包含一系列美观的colormap供我们选择。
import seaborn as sns
import numpy as np

data = np.random.randn(100, 100)
sns.heatmap(data, cmap='coolwarm')
plt.show()
在这个示例中,我们生成了一个随机的二维数组data,然后使用Seaborn中的heatmap函数将数据展示为热图,并指定了colormap为coolwarm,这是一个经典的diverging colormap。
3. 调整diverging colormap的颜色亮度和对比度
有时候,我们可能希望调整diverging colormap的颜色亮度和对比度,以更好地突出数据的差异。我们可以使用LightSource类来实现这一目的。
import matplotlib.pyplot as plt
from matplotlib.colors import LightSource

ls = LightSource(azdeg=0, altdeg=65)
data = np.random.rand(10, 10)

plt.imshow(ls.shade(data, cmap=plt.cm.coolwarm, vert_exag=0.1, blend_mode='soft'), cmap='coolwarm')
plt.show()
在这个示例中,我们使用LightSource类来对数据进行阴影处理,使得数据在diverging colormap下更具立体感。通过调整azdeg和altdeg参数,我们可以改变光源的方向和高度,从而影响颜色的亮度和对比度。
4. 自定义diverging colormap的颜色分布
除了使用预定义的颜色来创建diverging colormap外,我们还可以自定义颜色分布,以满足特定的数据可视化需求。这可以通过LinearSegmentedColormap来实现。
from matplotlib.colors import LinearSegmentedColormap

cdict = {'red':   [(0.0, 0.0, 0.0),
                   (0.5, 1.0, 1.0),
                   (1.0, 1.0, 1.0)],

         'green': [(0.0, 0.0, 0.0),
                   (0.5, 1.0, 1.0),
                   (1.0, 0.0, 0.0)],

         'blue':  [(0.0, 1.0, 1.0),
                   (0.5, 0.0, 0.0),
                   (1.0, 0.0, 0.0)]}

cmap = LinearSegmentedColormap('custom_cmap', segmentdata=cdict)

data = np.arange(100).reshape(10, 10)
plt.imshow(data, cmap=cmap)
plt.colorbar()
plt.show()
在这个示例中,我们定义了一个自定义的颜色字典cdict,其中包含了红、绿、蓝三个通道的颜色分布。然后我们使用LinearSegmentedColormap来创建一个自定义的diverging colormap,并将其应用到数据可视化中。
5. 使用工具箱中的diverging colormap
除了手动创建diverging colormap外,我们还可以使用工具箱中提供的现成colormap来简化数据可视化的过程。例如,cividis是一个用于可视化的diverging colormap,它有助于突出数据中的极端值。
import matplotlib.pyplot as plt
import numpy as np

data = np.random.randn(100, 100)
plt.imshow(data, cmap='cividis')
plt.colorbar()
plt.show()
Output:

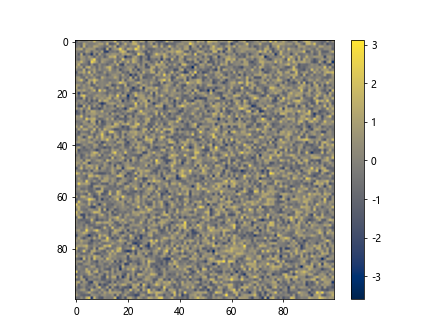
在这个示例中,我们使用cividiscolormap来展示一个随机生成的二维数组数据。cividis是一个很好的diverging colormap,它在黑白打印和彩色显示时效果都非常出色。
6. 使用colormap中的截断范围
有时候,我们可能只关心数据中某个范围的变化,而不关心极端值的分布。在这种情况下,我们可以使用TruncNorm来定义一个范围内的colormap。
import matplotlib.pyplot as plt
from matplotlib.colors import Normalize, TruncNorm

cmap = plt.cm.coolwarm
norm = Normalize(vmax=10)
tnorm = TruncNorm(vmin=-2, vmax=2, vmin_bound=norm.vmin, vmax_bound=norm.vmax)
plt.imshow(data, cmap=cmap, norm=norm)
plt.show()
在这个示例中,我们使用了TruncNorm来限制colormap的取值范围在-2到2之间,超出这个范围的值将被截断。这样一来,我们可以更清晰地看到数据在特定范围内的变化趋势。
7. 绘制带有diverging colormap的直方图
除了在二维数据上应用diverging colormap外,我们还可以在一维数据上绘制直方图,通过颜色来展示数据的分布。我们可以使用hist函数来实现这一目的。
data = np.random.randn(1000)
plt.hist(data, bins=30, cmap='coolwarm', edgecolor='black')
plt.show()
在这个示例中,我们生成了一个包含1000个随机数的一维数组data,然后使用hist函数来绘制直方图,并将colormap设为coolwarm,这样我们可以通过颜色来直观地看出数据的分布状况。
8. 绘制带有diverging colormap的等高线图
等高线图是一种常见的数据可视化方式,我们可以使用diverging colormap来突出等高线图中的高低点。下面是一个绘制带有div有colormap的等高线图的示例代码:
import numpy as np
import matplotlib.pyplot as plt

x = np.linspace(-5, 5, 100)
y = np.linspace(-5, 5, 100)
X, Y = np.meshgrid(x, y)
Z = np.sin(X) * np.cos(Y)

plt.contourf(X, Y, Z, cmap='coolwarm')
plt.colorbar()
plt.show()
Output:

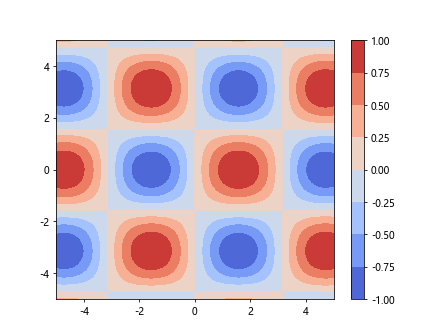
在这个示例中,我们生成了一个二维的正弦函数乘以余弦函数的数据,然后使用contourf函数绘制了等高线图,并将colormap设为coolwarm,这样我们可以直观地看到数据在平面上的分布情况。
9. 使用不同的diverging colormap展示多个子图
有时候,我们可能需要在一个图中展示多个子图,并使用不同的colormap来突出它们之间的差异。下面是一个绘制多个子图并应用不同的diverging colormap的示例。
fig, axs = plt.subplots(1, 2, figsize=(10, 5))

data1 = np.random.randn(100, 100)
data2 = np.random.rand(100, 100)

axs[0].imshow(data1, cmap='coolwarm')
axs[0].set_title('Data 1')

axs[1].imshow(data2, cmap='viridis')
axs[1].set_title('Data 2')

plt.show()
在这个示例中,我们创建了一个包含两个子图的图表,并分别在两个子图中展示了不同的数据data1和data2,并分别应用了不同的diverging colormap。这样可以更直观地比较两组数据的变化趋势。
10. 绘制带有标签的diverging colormap
在数据可视化中,有时我们需要为colormap添加标签,以便更清晰地理解数据中的差异。我们可以使用ListedColormap和BoundaryNorm来实现带有标签的diverging colormap。
from matplotlib.colors import BoundaryNorm

cmap = ListedColormap(['blue', 'white', 'red'])
bounds = [-1, 0, 1]
norm = BoundaryNorm(bounds, cmap.N)

data = np.random.rand(10, 10) * 2 - 1
plt.imshow(data, cmap=cmap, norm=norm)
plt.colorbar(ticks=[-1, 0, 1], label='Labels')
plt.show()
在这个示例中,我们定义了一个带有标签的diverging colormap,其中蓝色代表负值,红色代表正值,白色代表中性。通过设置ticks和label参数,我们可以为颜色添加标签,更直观地理解数据的含义。
通过以上示例代码,我们展示了如何在Matplotlib中使用diverging colormap来可视化数据集中的两个极端值,并清晰地显示它们之间的变化趋势。
 极客笔记
极客笔记