Matplotlib ax.scatter 的详细介绍与应用
参考:ax.scatter
ax.scatter 是 Matplotlib 库中用于创建散点图的函数。散点图是数据可视化中常用的图表类型,主要用于展示两个(或更多)变量之间的关系。本文将详细介绍 ax.scatter 的使用方法,并通过多个示例展示如何利用这个功能创建各种散点图。
1. ax.scatter 基础
ax.scatter 函数主要用于在图表中绘制散点。其基本语法如下:
scatter(x, y, s=None, c=None, marker=None, cmap=None, norm=None, vmin=None, vmax=None, alpha=None, linewidths=None, edgecolors=None)
x,y:表示点的位置。s:点的大小。c:点的颜色。marker:标记的样式,如'o'表示圆形。cmap:Colormap,用于根据数据生成颜色。norm:用于在数据和颜色映射之间进行归一化。vmin,vmax:用于归一化数据的颜色映射的最小值和最大值。alpha:透明度。linewidths:标记边缘的宽度。edgecolors:标记边缘的颜色。
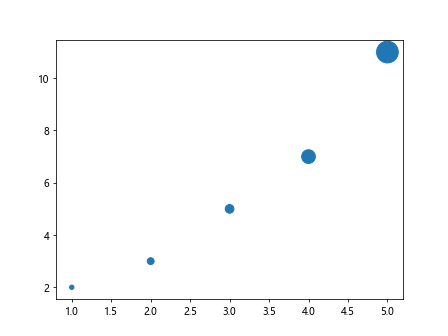
示例代码 1:基础散点图
import matplotlib.pyplot as plt

x = [1, 2, 3, 4, 5]
y = [2, 3, 5, 7, 11]
sizes = [20, 50, 80, 200, 500]

fig, ax = plt.subplots()
ax.scatter(x, y, s=sizes)
plt.show()
Output:
示例代码 2:调整颜色和透明度
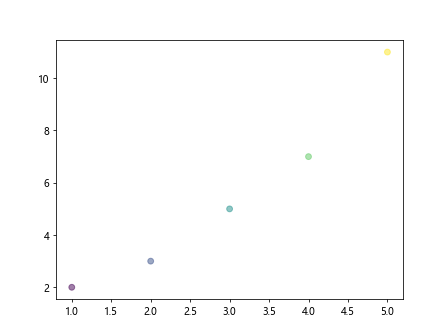
import matplotlib.pyplot as plt

x = [1, 2, 3, 4, 5]
y = [2, 3, 5, 7, 11]
colors = [10, 20, 30, 40, 50]

fig, ax = plt.subplots()
ax.scatter(x, y, c=colors, cmap='viridis', alpha=0.5)
plt.show()
Output:
2. 颜色映射和归一化
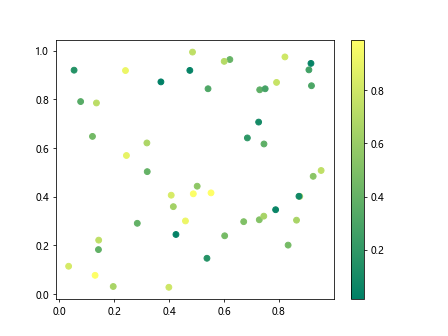
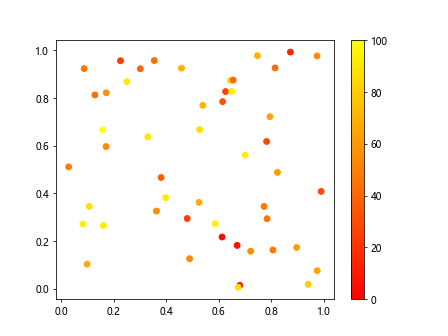
在使用 ax.scatter 时,颜色映射(cmap)和归一化(norm)是两个重要的参数,它们可以帮助我们更好地表示数据的分布。
示例代码 3:使用颜色映射
import matplotlib.pyplot as plt
import numpy as np

x = np.random.rand(50)
y = np.random.rand(50)
colors = np.random.rand(50)

fig, ax = plt.subplots()
scatter = ax.scatter(x, y, c=colors, cmap='summer')
fig.colorbar(scatter)
plt.show()
Output:
示例代码 4:自定义归一化
import matplotlib.pyplot as plt
import numpy as np
from matplotlib.colors import Normalize

x = np.random.rand(50)
y = np.random.rand(50)
colors = np.random.rand(50) * 100

norm = Normalize(vmin=0, vmax=100)

fig, ax = plt.subplots()
scatter = ax.scatter(x, y, c=colors, cmap='autumn', norm=norm)
fig.colorbar(scatter)
plt.show()
Output:
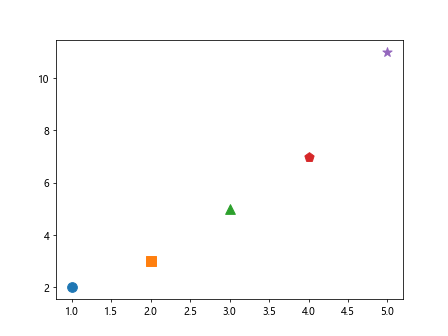
3. 标记样式和边缘处理
ax.scatter 允许用户自定义标记的样式和边缘,这可以通过 marker、linewidths 和 edgecolors 参数来实现。
示例代码 5:自定义标记样式
import matplotlib.pyplot as plt

x = [1, 2, 3, 4, 5]
y = [2, 3, 5, 7, 11]
markers = ['o', 's', '^', 'p', '*']

fig, ax = plt.subplots()
for i in range(len(x)):
    ax.scatter(x[i], y[i], marker=markers[i], s=100)
plt.show()
Output:
示例代码 6:调整标记边缘
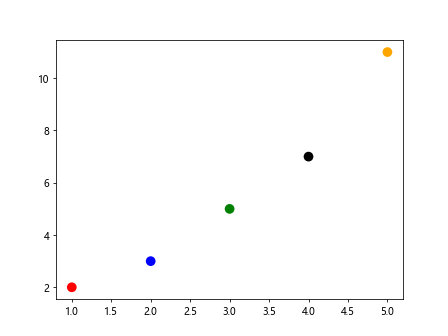
import matplotlib.pyplot as plt

x = [1, 2, 3, 4, 5]
y = [2, 3, 5, 7, 11]
colors = ['red', 'blue', 'green', 'black', 'orange']

fig, ax = plt.subplots()
ax.scatter(x, y, edgecolors='none', s=100, c=colors)
plt.show()
Output:
4. 散点图的高级应用
散点图不仅可以用于显示两个变量之间的关系,还可以通过调整点的大小、颜色等属性来表达更多的信息。
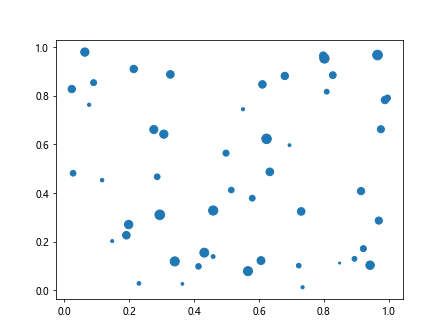
示例代码 7:点大小表示第三个变量
import matplotlib.pyplot as plt
import numpy as np

x = np.random.rand(50)
y = np.random.rand(50)
sizes = np.random.rand(50) * 100

fig, ax = plt.subplots()
ax.scatter(x, y, s=sizes)
plt.show()
Output:
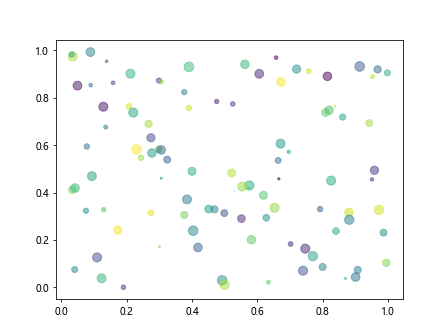
示例代码 8:点颜色和大小同时表示数据
import matplotlib.pyplot as plt
import numpy as np

x = np.random.rand(100)
y = np.random.rand(100)
colors = np.random.rand(100)
sizes = np.random.rand(100) * 100

fig, ax = plt.subplots()
ax.scatter(x, y, c=colors, s=sizes, cmap='viridis', alpha=0.5)
plt.show()
Output:
5. 结合 Pandas 使用
在处理实际数据时,我们经常使用 Pandas 库来管理和操作数据。ax.scatter 可以直接与 Pandas DataFrame 配合使用,从而更方便地处理数据。
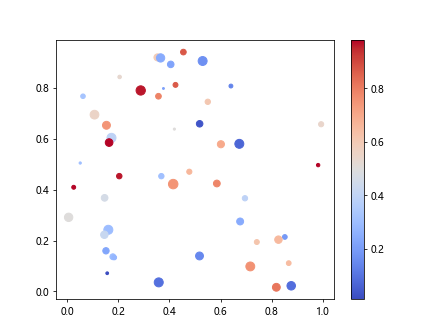
示例代码 9:使用 Pandas DataFrame
import matplotlib.pyplot as plt
import pandas as pd
import numpy as np

# 创建数据
data = pd.DataFrame({
    'x': np.random.rand(50),
    'y': np.random.rand(50),
    'color': np.random.rand(50),
    'size': np.random.rand(50) * 100
})

fig, ax = plt.subplots()
scatter = ax.scatter('x', 'y', c='color', s='size', data=data, cmap='coolwarm')
fig.colorbar(scatter)
plt.show()
Output:
6. 结论
ax.scatter 是一个非常强大的工具,可以帮助我们在 Python 中创建各种复杂和美观的散点图。通过调整其参数,我们可以轻松地控制散点图的各个方面,如点的大小、颜色、形状等。
 极客笔记
极客笔记