Matplotlib 添加坐标轴标签的方法
Matplotlib是一个常用的Python绘图库,可以用来制作各种类型的图表。在Matplotlib中,我们可以通过添加坐标轴标签来增强图表的可读性和清晰度。本文将介绍如何在Matplotlib中添加坐标轴标签的方法。
在X轴和Y轴添加标签
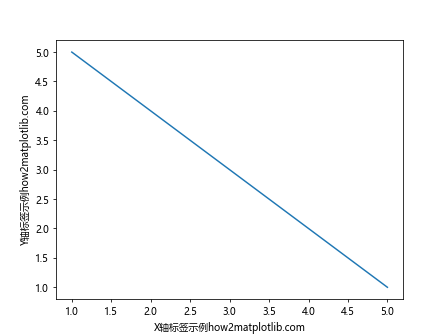
在Matplotlib中,我们可以使用xlabel()和ylabel()函数在X轴和Y轴上添加标签。以下是一个示例代码:
import matplotlib.pyplot as plt

x = [1, 2, 3, 4, 5]
y = [5, 4, 3, 2, 1]

plt.plot(x, y)
plt.xlabel('X轴标签示例how2matplotlib.com')
plt.ylabel('Y轴标签示例how2matplotlib.com')
plt.show()
Output:
自定义标签的字体样式
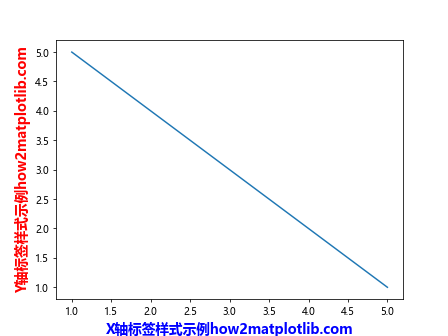
我们可以通过fontdict参数来自定义坐标轴标签的字体样式。以下是一个示例代码:
import matplotlib.pyplot as plt

x = [1, 2, 3, 4, 5]
y = [5, 4, 3, 2, 1]

plt.plot(x, y)
plt.xlabel('X轴标签样式示例how2matplotlib.com', fontdict={'fontsize': 14, 'color': 'blue', 'weight': 'bold'})
plt.ylabel('Y轴标签样式示例how2matplotlib.com', fontdict={'fontsize': 14, 'color': 'red', 'weight': 'bold'})
plt.show()
Output:
旋转标签
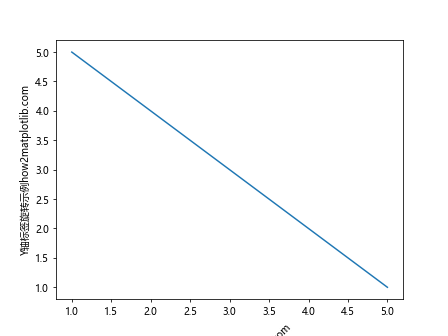
在Matplotlib中,我们可以通过rotation参数来旋转标签的方向。以下是一个示例代码:
import matplotlib.pyplot as plt

x = [1, 2, 3, 4, 5]
y = [5, 4, 3, 2, 1]

plt.plot(x, y)
plt.xlabel('X轴标签旋转示例how2matplotlib.com', rotation=45)
plt.ylabel('Y轴标签旋转示例how2matplotlib.com', rotation=90)
plt.show()
Output:
标签位置
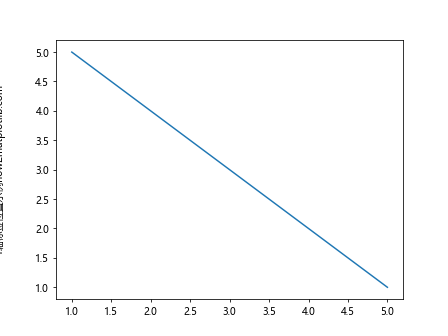
我们可以通过labelpad参数来调整标签与轴线之间的间距。以下是一个示例代码:
import matplotlib.pyplot as plt

x = [1, 2, 3, 4, 5]
y = [5, 4, 3, 2, 1]

plt.plot(x, y)
plt.xlabel('X轴标签位置示例how2matplotlib.com', labelpad=20)
plt.ylabel('Y轴标签位置示例how2matplotlib.com', labelpad=30)
plt.show()
Output:
标签颜色
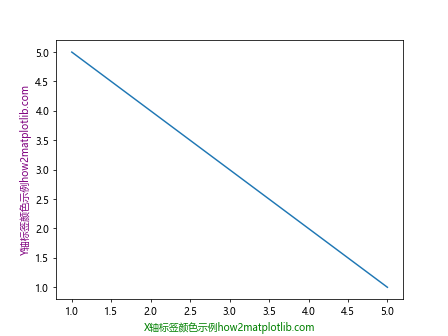
我们可以通过color参数来指定标签的颜色。以下是一个示例代码:
import matplotlib.pyplot as plt

x = [1, 2, 3, 4, 5]
y = [5, 4, 3, 2, 1]

plt.plot(x, y)
plt.xlabel('X轴标签颜色示例how2matplotlib.com', color='green')
plt.ylabel('Y轴标签颜色示例how2matplotlib.com', color='purple')
plt.show()
Output:
多行标签
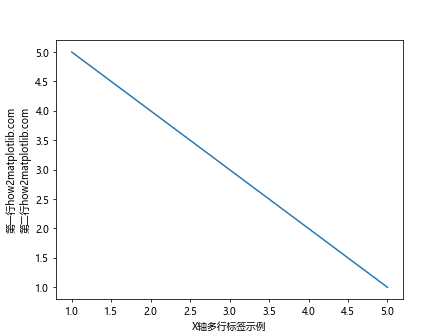
在Matplotlib中,我们可以使用\n来换行,从而实现多行标签的显示。以下是一个示例代码:
import matplotlib.pyplot as plt

x = [1, 2, 3, 4, 5]
y = [5, 4, 3, 2, 1]

plt.plot(x, y)
plt.xlabel('X轴多行标签示例\n第一行how2matplotlib.com\n第二行how2matplotlib.com')
plt.ylabel('Y轴多行标签示例\n第一行how2matplotlib.com\n第二行how2matplotlib.com')
plt.show()
Output:
标签边距
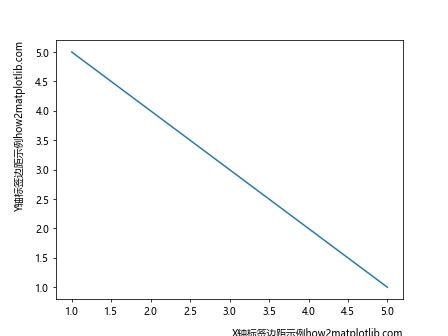
我们可以使用loc参数来指定标签的位置。以下是一个示例代码:
import matplotlib.pyplot as plt

x = [1, 2, 3, 4, 5]
y = [5, 4, 3, 2, 1]

plt.plot(x, y)
plt.xlabel('X轴标签边距示例how2matplotlib.com', labelpad=10, loc='right')
plt.ylabel('Y轴标签边距示例how2matplotlib.com', labelpad=10, loc='top')
plt.show()
Output:
坐标轴标题
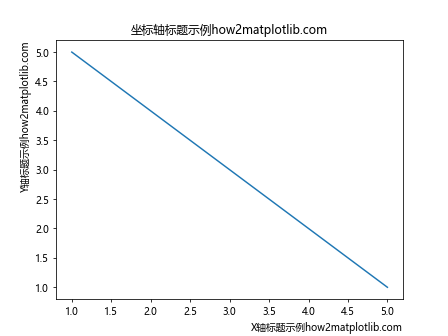
除了X轴和Y轴标签,我们还可以为坐标轴添加标题。以下是一个示例代码:
import matplotlib.pyplot as plt

x = [1, 2, 3, 4, 5]
y = [5, 4, 3, 2, 1]

plt.plot(x, y)
plt.xlabel('X轴标题示例how2matplotlib.com', loc='right')
plt.ylabel('Y轴标题示例how2matplotlib.com', loc='top')
plt.title('坐标轴标题示例how2matplotlib.com')
plt.show()
Output:
修改坐标轴标题样式
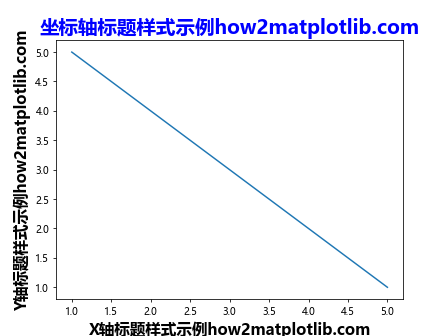
我们可以使用fontdict参数来自定义坐标轴标题的样式。以下是一个示例代码:
import matplotlib.pyplot as plt

x = [1, 2, 3, 4, 5]
y = [5, 4, 3, 2, 1]

plt.plot(x, y)
plt.xlabel('X轴标题样式示例how2matplotlib.com', fontdict={'fontsize': 16, 'color': 'black', 'weight': 'bold'})
plt.ylabel('Y轴标题样式示例how2matplotlib.com', fontdict={'fontsize': 16, 'color': 'black', 'weight': 'bold'})
plt.title('坐标轴标题样式示例how2matplotlib.com', fontdict={'fontsize': 20, 'color': 'blue', 'weight': 'bold'})
plt.show()
Output:
隐藏坐标轴
有时候我们可能需要隐藏掉坐标轴,只显示图表本身。以下是一个示例代码:
import matplotlib.pyplot as plt

x = [1, 2, 3, 4, 5]
y = [5, 4, 3, 2, 1]

plt.plot(x, y)
plt.axis('off')
plt.show()
Output:

调整坐标轴范围
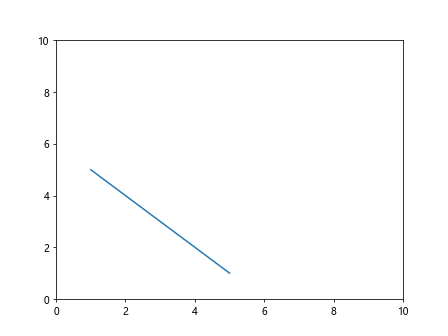
我们可以使用xlim()和ylim()函数来调整坐标轴的范围。以下是一个示例代码:
import matplotlib.pyplot as plt

x = [1, 2, 3, 4, 5]
y = [5, 4, 3, 2, 1]

plt.plot(x, y)
plt.xlim(0, 10)
plt.ylim(0, 10)
plt.show()
Output:
自定义坐标轴
在Matplotlib中,我们可以使用matplotlib.ticker模块来自定义坐标轴。以下是一个示例代码:
import matplotlib.pyplot as plt
import matplotlib.ticker as ticker

x = [1, 2, 3, 4, 5]
y = [5, 4, 3, 2, 1]

plt.plot(x, y)

formatter = ticker.ScalarFormatter(useMathText=True)
formatter.set_scientific(True)
plt.gca().xaxis.set_major_formatter(formatter)

plt.show()
Output:
坐标轴标签对齐
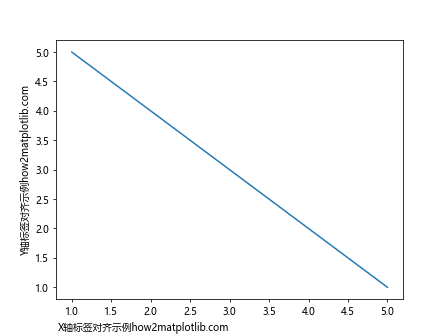
我们可以使用
import matplotlib.pyplot as plt

x = [1, 2, 3, 4, 5]
y = [5, 4, 3, 2, 1]

plt.plot(x, y)
plt.xlabel('X轴标签对齐示例how2matplotlib.com', ha='right')
plt.ylabel('Y轴标签对齐示例how2matplotlib.com', ha='center')
plt.show()
Output:
反向显示坐标轴
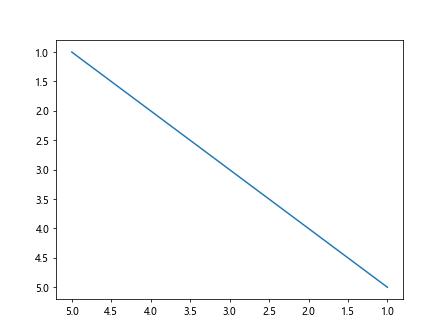
有时候我们需要将坐标轴进行反向显示,可以使用invert_xaxis()和invert_yaxis()函数。以下是一个示例代码:
import matplotlib.pyplot as plt

x = [1, 2, 3, 4, 5]
y = [5, 4, 3, 2, 1]

plt.plot(x, y)
plt.gca().invert_xaxis()
plt.gca().invert_yaxis()
plt.show()
Output:
设置坐标轴刻度
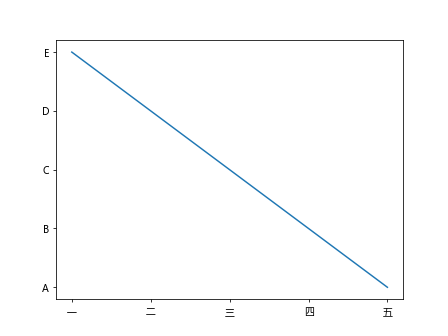
我们可以通过xticks()和yticks()函数来设置坐标轴的刻度。以下是一个示例代码:
import matplotlib.pyplot as plt

x = [1, 2, 3, 4, 5]
y = [5, 4, 3, 2, 1]

plt.plot(x, y)
plt.xticks([1, 2, 3, 4, 5], ['一', '二', '三', '四', '五'])
plt.yticks([1, 2, 3, 4, 5], ['A', 'B', 'C', 'D', 'E'])
plt.show()
Output:
调整坐标轴刻度标签大小
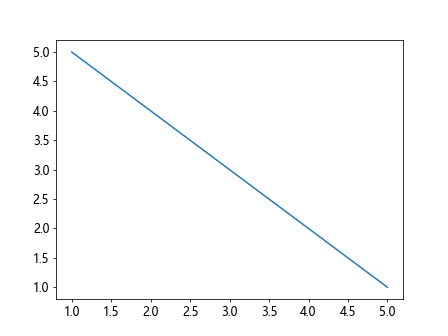
我们可以通过xticks()和yticks()函数的fontsize参数来调整坐标轴刻度标签的大小。以下是一个示例代码:
import matplotlib.pyplot as plt

x = [1, 2, 3, 4, 5]
y = [5, 4, 3, 2, 1]

plt.plot(x, y)
plt.xticks(fontsize=12)
plt.yticks(fontsize=12)
plt.show()
Output:
坐标轴范围自适应
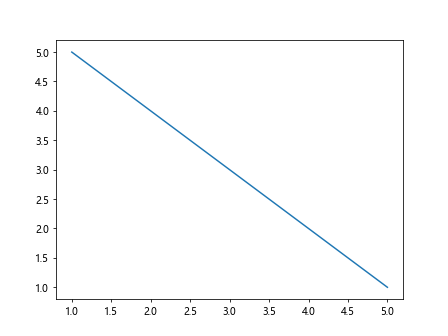
有时候我们希望让Matplotlib自动调整坐标轴范围,可以使用autoscale()函数。以下是一个示例代码:
import matplotlib.pyplot as plt

x = [1, 2, 3, 4, 5]
y = [5, 4, 3, 2, 1]

plt.plot(x, y)
plt.autoscale()
plt.show()
Output:
调整坐标轴刻度步长
我们可以通过xticks()和yticks()函数的step参数来调整坐标轴刻度的步长。以下是一个示例代码:
import matplotlib.pyplot as plt

x = [1, 2, 3, 4, 5]
y = [5, 4, 3, 2, 1]

plt.plot(x, y)
plt.xticks([1, 2, 3, 4, 5], step=2)
plt.yticks([1, 2, 3, 4, 5], step=2)
plt.show()
设置坐标轴刻度方向
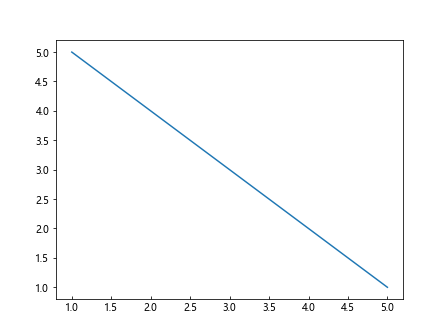
我们可以通过tick_params()函数来设置坐标轴刻度的方向。以下是一个示例代码:
import matplotlib.pyplot as plt

x = [1, 2, 3, 4, 5]
y = [5, 4, 3, 2, 1]

plt.plot(x, y)
plt.tick_params(axis='x', direction='in')
plt.tick_params(axis='y', direction='out')
plt.show()
Output:
以上是关于在Matplotlib中添加坐标轴标签的一些方法和示例代码。
 极客笔记
极客笔记