Matplotlib ax.annotate详解
参考:ax.annotate
在matplotlib中,ax.annotate函数是一个非常有用的工具,它允许在图形中添加文本注释。通过ax.annotate函数,可以在指定的位置添加文本注释,并可以通过设置不同的参数来控制注释的外观和位置。在本文中,我们将详细介绍ax.annotate函数的用法,并提供多个示例代码来帮助读者理解该函数的实际应用。
简介
在Matplotlib中,ax.annotate函数用于在图形中添加文本注释。该函数的基本语法为:
ax.annotate(text, xy, xytext, arrowprops)
其中,text参数为要添加的文本内容,xy参数为所注释点的位置,xytext参数为文本注释的位置,arrowprops参数用于设置箭头的样式。通过调整这些参数的值,可以实现不同风格和位置的注释。
在下面的示例中,我们将演示如何使用ax.annotate函数添加不同风格和位置的文本注释。
示例代码
示例1:在指定位置添加简单文本注释
import matplotlib.pyplot as plt

fig, ax = plt.subplots()
ax.plot([1, 2, 3, 4], [1, 4, 9, 16])

# 在点(2, 4)处添加文本注释
ax.annotate('Point (2, 4)', (2, 4))

plt.show()
Output:
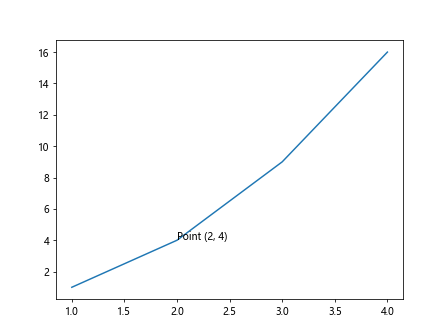
在这个示例中,我们在图形中的点(2, 4)处添加了一个简单的文本注释”Point (2, 4)”。
示例2:调整注释文本的样式和位置
import matplotlib.pyplot as plt

fig, ax = plt.subplots()
ax.plot([1, 2, 3, 4], [1, 4, 9, 16])

# 在点(2, 4)处添加文本注释,并调整文本样式和位置
ax.annotate('Point (2, 4)', xy=(2, 4), xytext=(3, 6),
            arrowprops=dict(facecolor='black', shrink=0.05))

plt.show()
Output:
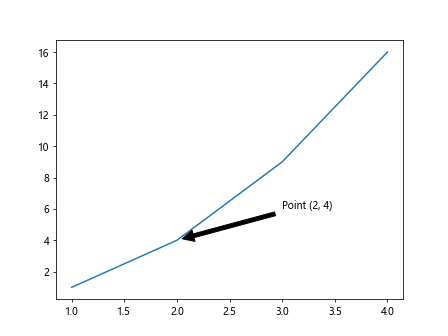
在这个示例中,我们在点(2, 4)处添加了一个文本注释”Point (2, 4)”,并调整了文本的位置和样式。
示例3:在图形中心添加文本注释
import matplotlib.pyplot as plt

fig, ax = plt.subplots()
ax.plot([1, 2, 3, 4], [1, 4, 9, 16])

# 在图形中心添加文本注释
ax.annotate('Center', xy=(2, 4), xytext=(2, 8),
            arrowprops=dict(facecolor='blue', shrink=0.05))

plt.show()
Output:
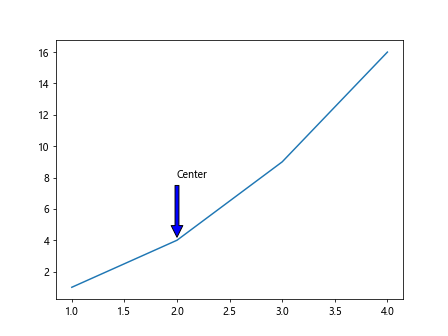
在这个示例中,我们在图形中心添加了一个文本注释”Center”。
示例4:添加带有箭头的文本注释
import matplotlib.pyplot as plt

fig, ax = plt.subplots()
ax.plot([1, 2, 3, 4], [1, 4, 9, 16])

# 在点(2, 4)处添加带有箭头的文本注释
ax.annotate('Point (2, 4)', xy=(2, 4), xytext=(3, 6),
            arrowprops=dict(arrowstyle="->"))

plt.show()
Output:
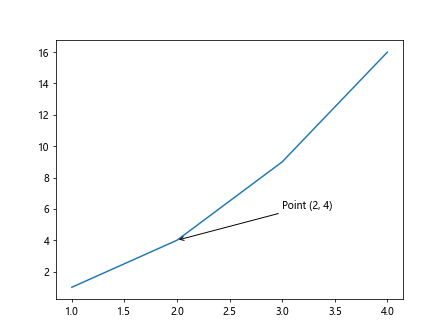
在这个示例中,我们在点(2, 4)处添加了一个带有箭头的文本注释”Point (2, 4)”。
示例5:添加方框样式的文本注释
import matplotlib.pyplot as plt

fig, ax = plt.subplots()
ax.plot([1, 2, 3, 4], [1, 4, 9, 16])

# 在点(2, 4)处添加方框样式的文本注释
ax.annotate('Point (2, 4)', xy=(2, 4), xytext=(2, 6),
            bbox=dict(boxstyle="round,pad=0.3", fc="cyan", ec="b", lw=2))

plt.show()
Output:
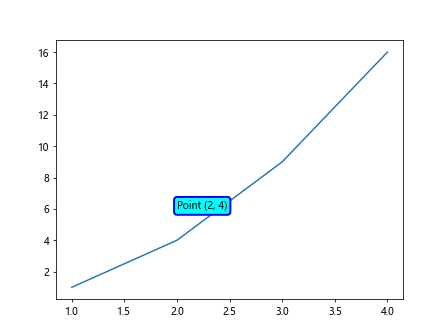
在这个示例中,我们在点(2, 4)处添加了一个方框样式的文本注释”Point (2, 4)”。
示例6:添加连接线和箭头的文本注释
import matplotlib.pyplot as plt

fig, ax = plt.subplots()
ax.plot([1, 2, 3, 4], [1, 4, 9, 16])

# 在点(2, 4)处添加带连接线和箭头的文本注释
ax.annotate('Point (2, 4)', xy=(2, 4), xytext=(3, 6),
            arrowprops=dict(arrowstyle="->", connectionstyle="arc3,rad=.5"))

plt.show()
Output:
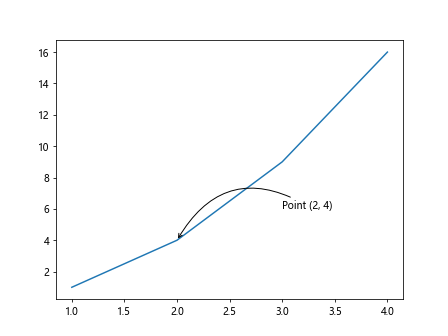
在这个示例中,我们在点(2, 4)处添加了一个带有连接线和箭头的文本注释”Point (2, 4)”。
示例7:调整箭头的样式和位置
import matplotlib.pyplot as plt

fig, ax = plt.subplots()
ax.plot([1, 2, 3, 4], [1, 4, 9, 16])

# 在点(2, 4)处添加文本注释,并调整箭头的样式和位置
ax.annotate('Point (2, 4)', xy=(2, 4), xytext=(3, 6),
            arrowprops=dict(arrowstyle="->", connectionstyle="angle,angleA=0,angleB=90,rad=10"))

plt.show()
Output:
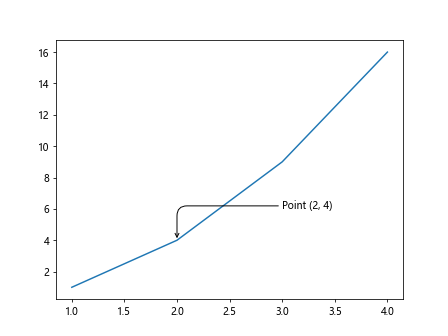
在这个示例中,我们在点(2, 4)处添加了一个文本注释”Point (2, 4)”,并调整了箭头的样式和位置。
示例8:添加注释文本的旋转角度
import matplotlib.pyplot as plt

fig, ax = plt.subplots()
ax.plot([1, 2, 3, 4], [1, 4, 9, 16])

# 在点(2, 4)处添加文本注释,并设置文本旋转角度
ax.annotate('Point (2, 4)', xy=(2, 4), rotation=45)

plt.show()
Output:
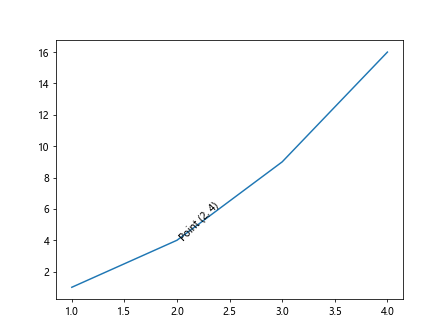
在这个示例中,我们在点(2, 4)处添加了一个文本注释”Point (2, 4)”,并设置了文本的旋转角度为45度。
示例9:添加带有背景色的文本注释
import matplotlib.pyplot as plt

fig, ax = plt.subplots()
ax.plot([1, 2, 3, 4], [1, 4, 9, 16])

# 在点(2, 4)处添加带有背景色的文本注释
ax.annotate('Point (2, 4)', xy=(2, 4), xytext=(3, 6),
            arrowprops=dict(arrowstyle="->"), backgroundcolor='yellow')

plt.show()
Output:
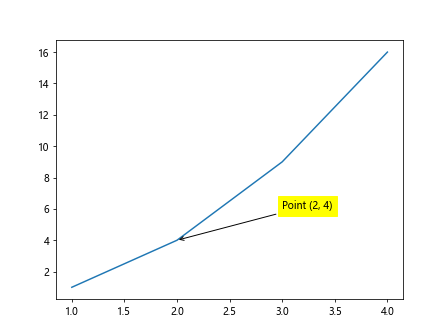
在这个示例中,我们在点(2, 4)处添加了一个带有背景色的文本注释”Point (2, 4)”。
示例10:自定义文本字体和大小
import matplotlib.pyplot as plt

fig, ax = plt.subplots()
ax.plot([1, 2, 3, 4], [1, 4, 9, 16])

# 在点(2, 4)处添加文本注释,并设置字体和大小
ax.annotate('Point (2, 4)', xy=(2, 4), xytext=(3, 6),
            arrowprops=dict(arrowstyle="->"), fontname='Arial', fontsize=12)

plt.show()
Output:
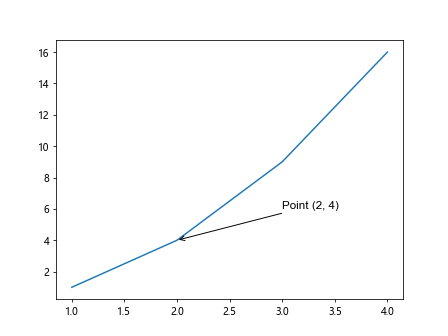
在这个示例中,我们在点(2, 4)处添加了一个文本注释”Point (2, 4)”,并设置了文本的字体为Arial,大小为12。
示例11:添加多个文本注释
import matplotlib.pyplot as plt

fig, ax = plt.subplots()
ax.plot([1, 2, 3, 4], [1, 4, 9, 16])

# 添加多个文本注释
ax.annotate('Point (2, 4)', xy=(2, 4), xytext=(3, 6),
            arrowprops=dict(arrowstyle="->"))

ax.annotate('Point (3, 9)', xy=(3, 9), xytext=(4, 10),
            arrowprops=dict(arrowstyle="->"))

plt.show()
Output:
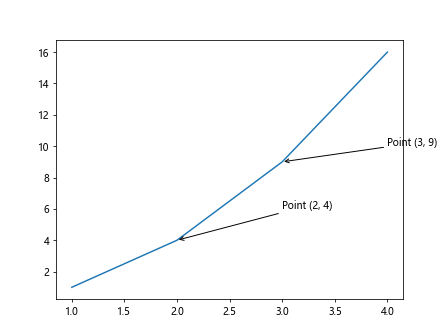
在这个示例中,我们在图形中添加了两个文本注释。
示例12:添加多行文本注释
import matplotlib.pyplot as plt

fig, ax = plt.subplots()
ax.plot([1, 2, 3, 4], [1, 4, 9, 16])

# 添加多行文本注释
ax.annotate('Line 1\nLine 2\nLine 3', xy=(2, 4), xytext=(3, 6),
            arrowprops=dict(arrowstyle="->"))

plt.show()
Output:
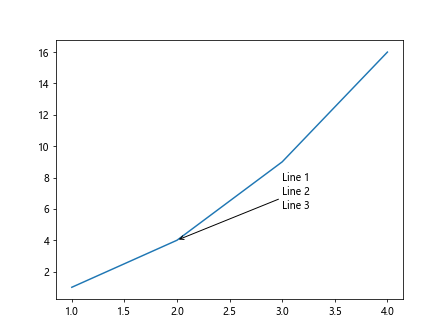
在这个示例中,我们在点(2, 4)处添加了一个多行文本注释。
结论
通过以上示例代码,我们详细介绍了ax.annotate函数的用法及其在Matplotlib中的实际应用。通过调整不同的参数,我们可以实现各种不同风格和位置的文本注释,从而使图形更加直观和具有信息性。读者可以根据自己的需求和实际场景,灵活运用ax.annotate函数,为图形添加更多有趣的注释内容。
 极客笔记
极客笔记