如何在Matplotlib中给散点添加标签
在使用Matplotlib绘制散点图时,经常需要给散点添加标签,以便更清晰地展示数据。在Matplotlib中,我们可以利用ax.scatter函数来创建散点图,并使用annotate函数来添加标签。本文将通过多个示例代码来详细介绍如何在Matplotlib中给散点添加标签。
创建基本散点图
首先,我们先创建一个简单的散点图,并在散点上添加标签。
import matplotlib.pyplot as plt

fig, ax = plt.subplots()
x = [1, 2, 3, 4, 5]
y = [10, 15, 13, 18, 16]
labels = ['A', 'B', 'C', 'D', 'E']

scatter = ax.scatter(x, y)
for i, txt in enumerate(labels):
    ax.annotate(txt, (x[i], y[i]))

plt.show()
Output:
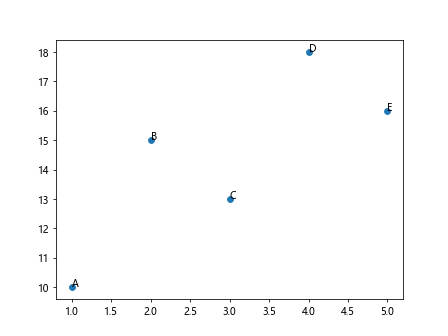
在这个示例中,我们创建了一个包含5个数据点的散点图,并在每个数据点上添加了对应的标签。通过enumerate函数,我们可以遍历数据点的坐标和标签,并使用annotate函数来添加标签。
修改标签位置和样式
有时候标签的位置可能会重叠,我们可以通过调整标签的位置和样式来避免这种情况。
import matplotlib.pyplot as plt

fig, ax = plt.subplots()
x = [1, 2, 3, 4, 5]
y = [10, 15, 13, 18, 16]
labels = ['A', 'B', 'C', 'D', 'E']

scatter = ax.scatter(x, y)
for i, txt in enumerate(labels):
    ax.annotate(txt, (x[i], y[i]), xytext=(5,5), textcoords='offset points', fontsize=12)

plt.show()
Output:
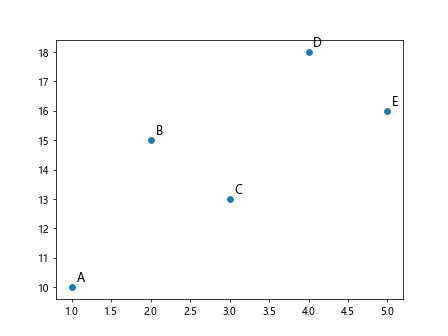
在这个示例中,我们修改了标签的位置和字体大小。通过设置xytext参数和textcoords参数,可以让标签相对于数据点进行偏移。同时,我们也调整了标签的字体大小为12。
添加箭头指示标签
我们还可以添加箭头指示标签的方向,让标签更具有导向性。
import matplotlib.pyplot as plt

fig, ax = plt.subplots()
x = [1, 2, 3, 4, 5]
y = [10, 15, 13, 18, 16]
labels = ['A', 'B', 'C', 'D', 'E']

scatter = ax.scatter(x, y)
for i, txt in enumerate(labels):
    ax.annotate(txt, (x[i], y[i]), xytext=(5,5), textcoords='offset points', arrowprops=dict(arrowstyle='->'))

plt.show()
Output:
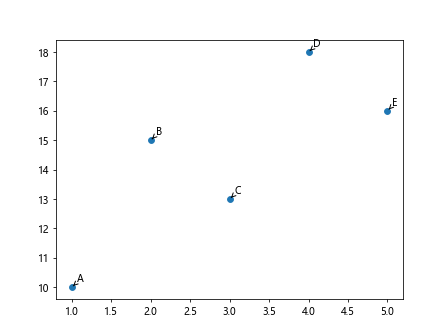
在这个示例中,我们通过设置arrowprops参数,给标签添加了箭头指示标签的方向。箭头的样式可以通过arrowstyle参数进行设置。
使用自定义标签格式
除了简单的文本标签外,我们还可以使用自定义格式的标签来展示数据。
import matplotlib.pyplot as plt

fig, ax = plt.subplots()
x = [1, 2, 3, 4, 5]
y = [10, 15, 13, 18, 16]
labels = ['A', 'B', 'C', 'D', 'E']

scatter = ax.scatter(x, y)
for i, txt in enumerate(labels):
    ax.annotate(f'{txt}: ({x[i]}, {y[i]})', (x[i], y[i]), xytext=(5,-5), textcoords='offset points', fontsize=12)

plt.show()
Output:
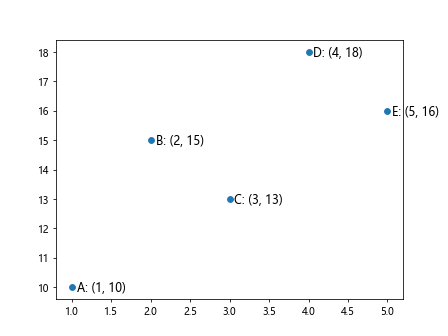
在这个示例中,我们使用了f-string来自定义标签的格式,展示了数据的坐标。这样可以让标签更加具有信息性。
添加多个标签
有时候我们可能需要在散点上添加多个标签,这时可以通过循环的方式来添加多个标签。
import matplotlib.pyplot as plt

fig, ax = plt.subplots()
x = [1, 2, 3, 4, 5]
y = [10, 15, 13, 18, 16]
labels = [['A', 'B'], ['C', 'D'], ['E']]

scatter = ax.scatter(x, y)
for i, group in enumerate(labels):
    for j, txt in enumerate(group):
        ax.annotate(txt, (x[i], y[i]), xytext=(5+j*10,5+j*10), textcoords='offset points', fontsize=12)

plt.show()
Output:
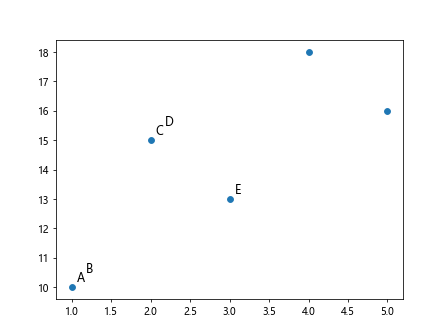
在这个示例中,我们将标签按组进行添加,每组标签在散点周围显示,并且位置有微小偏移。
使用循环添加标签
如果需要在散点上添加大量标签,可以使用循环的方式批量添加标签。
import matplotlib.pyplot as plt
import numpy as np

fig, ax = plt.subplots()
x = np.random.rand(50)
y = np.random.rand(50)
labels = [f'Point {i+1}' for i in range(50)]

scatter = ax.scatter(x, y)
for i, txt in enumerate(labels):
    ax.annotate(txt, (x[i], y[i]), fontsize=8)

plt.show()
Output:
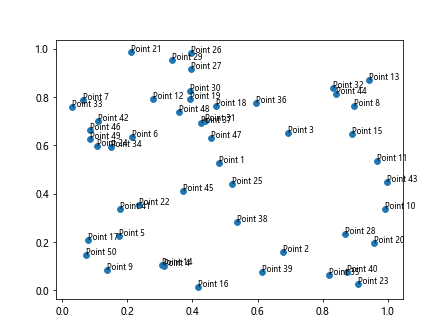
在这个示例中,我们使用循环来批量添加50个标签到随机生成的散点数据上。
修改标签颜色和边框
除了修改标签的位置和样式外,我们还可以修改标签的颜色和边框以增强可视效果。
import matplotlib.pyplot as plt

fig, ax = plt.subplots()
x = [1, 2, 3, 4, 5]
y = [10, 15, 13, 18, 16]
labels = ['A', 'B', 'C', 'D', 'E']

scatter = ax.scatter(x, y)
for i, txt in enumerate(labels):
    ax.annotate(txt, (x[i], y[i]), xytext=(5,-5), textcoords='offset points', fontsize=12, color='red', bbox=dict(facecolor='yellow', edgecolor='blue'))

plt.show()
Output:
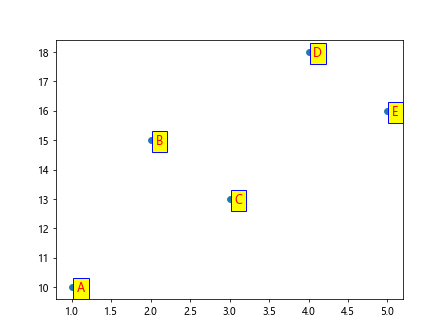
在这个示例中,我们修改了标签的颜色为红色,同时给标签添加了黄色背景和蓝色边框。
添加自定义标签图片
除了文本标签外,我们还可以在散点上添加自定义的图片标签。
import matplotlib.pyplot as plt
from matplotlib.offsetbox import OffsetImage, AnnotationBbox
import numpy as np

fig, ax = plt.subplots()
x = np.random.rand(5)
y = np.random.rand(5)
imgs = ['img1.png', 'img2.png', 'img3.png', 'img4.png', 'img5.png']

scatter = ax.scatter(x, y)
for i, img_path in enumerate(imgs):
    img = OffsetImage(plt.imread(img_path), zoom=0.1)
    ab = AnnotationBbox(img, (x[i], y[i]), frameon=False)
    ax.add_artist(ab)

plt.show()
在这个示例中,我们首先导入OffsetImage和AnnotationBbox模块,然后使用plt.imread函数加载图片文件,并通过OffsetImage将图片添加到标签上。
交互式标签
有时候我们需要根据用户的交互来调整标签的显示与隐藏,这时可以通过事件处理来实现。
import matplotlib.pyplot as plt

fig, ax = plt.subplots()
x = [1, 2, 3, 4, 5]
y = [10, 15, 13, 18, 16]
labels = ['A', 'B', 'C', 'D', 'E']

scatter = ax.scatter(x, y)
annot = ax.annotate("", xy=(0,0), xytext=(20,20), textcoords="offset points",
                    bbox=dict(boxstyle="round", fc="w"), arrowprops=dict(arrowstyle="->"))

annot.set_visible(False)

def update_annot(ind):
    pos = scatter.get_offsets()[ind["ind"][0]]
    annot.xy = pos
    text = labels[ind["ind"][0]]
    annot.set_text(text)
    annot.get_bbox_patch().set_facecolor("red")
    annot.get_bbox_patch().set_alpha(0.4)

def hover(event):
    visibility_changed = False
    if event.inaxes == ax:
        cont, ind = scatter.contains(event)
        if cont:
            update_annot(ind)
            annot.set_visible(True)
            visibility_changed = True
        else:
            if annot.get_visible():
                annot.set_visible(False)
                visibility_changed = True
    if visibility_changed:
        plt.draw()

fig.canvas.mpl_connect("motion_notify_event", hover)
plt.show()
Output:
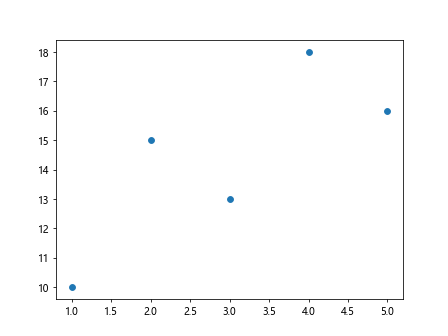
在这个示例中,我们定义了一个update_annot函数用于更新标签的位置和内容,定义了一个hover函数用于处理鼠标悬停事件。通过连接motion_notify_event事件和hover函数,实现了根据鼠标悬停在散点上的交互式显示标签。
结语
通过本文的多个示例代码,我们详细介绍了在Matplotlib中如何给散点添加标签。无论是简单文本标签、自定义样式标签、图片标签还是交互式标签,我们都可以通过适当的代码来实现。在实际应用中,根据具体需求选择合适的标签方式,可以使散点图更加清晰、信息更加丰富,提升可视化效果和用户体验。
 极客笔记
极客笔记