如何在 Matplotlib 中使用 annotation box
Matplotlib 是一个非常流行的 Python 绘图库,可以用来创建各种类型的图表和可视化效果。在绘制图表的过程中,有时候我们需要在图中添加一些文字或注释,来说明数据的含义或者提供额外信息。其中,annotation box 是一种非常常用的工具,可以在图中指定的位置显示一个带有文本的框,提供更清晰的信息展示。本文将详细介绍如何在 Matplotlib 中使用 annotation box。
创建基本的 annotation box
首先,我们来看一个简单的例子,如何在图中添加一个 annotation box:
import matplotlib.pyplot as plt

plt.figure()
plt.plot([1, 2, 3, 4], [1, 4, 9, 16])

# 添加 annotation box
plt.annotate('Sample Text',
             xy=(2, 4),
             xytext=(3, 5),
             arrowprops=dict(facecolor='red', shrink=0.05))

plt.show()
Output:
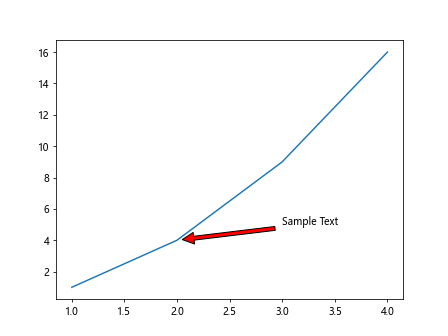
在这个示例中,我们使用 plt.annotate() 函数来添加一个 annotation box。参数 xy=(2, 4) 指定了文本框的箭头指向的位置,参数 xytext=(3, 5) 指定了文本框的位置。arrowprops 参数用于定义箭头的样式,设置了箭头的颜色为红色,缩小箭头的长度。
在子图中添加多个 annotation box
有时候我们需要在图中的多个位置添加 annotation box,可以使用循环来实现:
import matplotlib.pyplot as plt

fig, axs = plt.subplots(2, 2)

for i in range(2):
    for j in range(2):
        axs[i, j].plot([1, 2, 3, 4], [1, 4, 9, 16])
        axs[i, j].annotate('Sample Text {}'.format(i*2+j+1),
                           xy=(2, 4),
                           xytext=(3, 5),
                           arrowprops=dict(facecolor='blue', shrink=0.05))

plt.show()
Output:
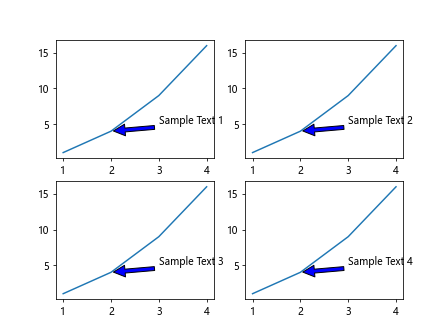
在这个示例中,我们使用循环在子图中依次添加了四个 annotation box,每个文本框都包含一个不同的 Sample Text。
设置 annotation box 样式
我们可以通过调整参数来设置 annotation box 的样式,包括文本样式、文本框样式、箭头样式等:
import matplotlib.pyplot as plt

plt.figure()
plt.plot([1, 2, 3, 4], [1, 4, 9, 16])

# 设置 annotation box 样式
plt.annotate('Sample Text',
             xy=(2, 4),
             xytext=(3, 5),
             arrowprops=dict(facecolor='green', shrink=0.1, headwidth=10, headlength=10),
             fontsize=12, color='blue', fontweight='bold', bbox=dict(facecolor='yellow', alpha=0.5))

plt.show()
Output:
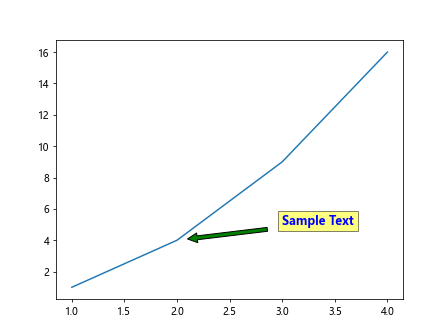
在这个示例中,我们设置了文本的颜色为蓝色,字体加粗,字体大小为 12;设置了文本框的背景颜色为黄色,透明度为 0.5;设置了箭头的颜色为绿色,缩小箭头长度,且箭头头部宽度和长度为 10。
添加基于文本的 annotation box
除了在指定位置添加 annotation box 外,我们还可以根据文本的内容自动确定文本框的位置:
import matplotlib.pyplot as plt

plt.figure()
plt.plot([1, 2, 3, 4], [1, 4, 9, 16])

# 添加基于文本的 annotation box
plt.annotate('Sample Text',
             xy=(2, 4),
             xycoords='data', textcoords='offset points', xytext=(20, 10))

plt.show()
Output:
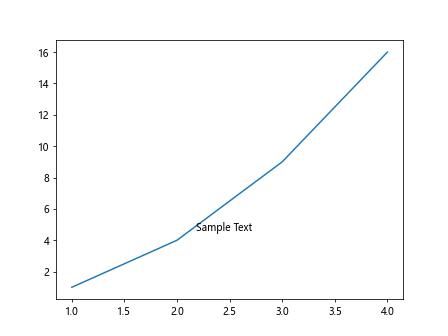
在这个示例中,参数 xycoords='data' 表示 xy 坐标是数据坐标,参数 textcoords='offset points' 表示 xytext 是偏移值,参数 xytext=(20, 10) 表示相对于数据点的偏移值。
添加透明度的 annotation box
有时候我们需要控制 annotation box 的透明度,可以通过设置 alpha 参数来实现:
import matplotlib.pyplot as plt

plt.figure()
plt.plot([1, 2, 3, 4], [1, 4, 9, 16])

# 添加透明度的 annotation box
plt.annotate('Sample Text',
             xy=(2, 4),
             xytext=(3, 5),
             arrowprops=dict(facecolor='purple', shrink=0.05),
             alpha=0.7,
             bbox=dict(facecolor='pink'))

plt.show()
Output:
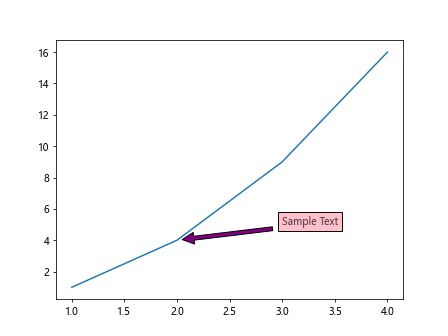
在这个示例中,设置了 annotation box 的透明度为 0.7,背景颜色为粉色。
隐藏 annotation box
有时候我们需要在特定条件下隐藏 annotation box,可以通过设置 visible=False 参数来实现:
import matplotlib.pyplot as plt

plt.figure()
plt.plot([1, 2, 3, 4], [1, 4, 9, 16])

# 隐藏 annotation box
annotation = plt.annotate('Sample Text',
                          xy=(2, 4),
                          xytext=(3, 5),
                          arrowprops=dict(facecolor='orange', shrink=0.05))

annotation.set_visible(False)

plt.show()
Output:
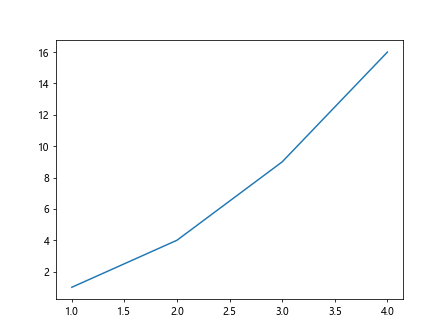
在这个示例中,我们先创建了一个 annotation box,然后通过 set_visible(False) 方法隐藏了它,不再显示在图中。
添加辅助线的 annotation box
有时候我们需要在 annotation box 的位置添加一条辅助线,可以通过设置 arrowprops 参数的 arrowstyle 来实现:
import matplotlib.pyplot as plt

plt.figure()
plt.plot([1, 2, 3, 4], [1, 4, 9, 16])

# 添加辅助线的 annotation box
plt.annotate('Sample Text',
             xy=(2, 4),
             xytext=(3, 5),
             arrowprops=dict(facecolor='brown', shrink=0.05, arrowstyle='-|>'))

plt.show()
在这个示例中,设置了 arrowprops 参数的 arrowstyle='-|>',表示箭头样式为实线。
添加连接到特定轴坐标的 annotation box
有时候我们需要将 annotation box 与特定轴坐标点相连,可以通过设置 coordinate 参数来实现:
import matplotlib.pyplot as plt

plt.figure()
plt.plot([1, 2, 3, 4], [1, 4, 9, 16])

# 添加连接到特定轴坐标的 annotation box
plt.annotate('Sample Text',
             xy=(2, 4),
             xycoords='data',
             xytext=(0.5, 0),
             textcoords='axes fraction',
             arrowprops=dict(facecolor='black', shrink=0.05))

plt.show()
Output:
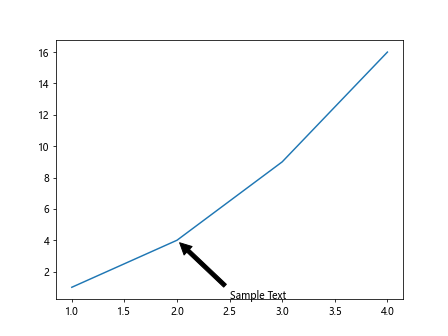
在这个示例中,设置了 xycoords='data' 表示 xy 坐标是数据坐标,设置了 textcoords='axes fraction' 表示 xytext 坐标是轴坐标系的百分比。
添加 annotation box
import matplotlib.pyplot as plt

plt.figure()
plt.plot([1, 2, 3, 4], [1, 4, 9, 16])

# 添加带有箭头的 annotation box
plt.annotate('Sample Text',
             xy=(2, 4),
             xytext=(3, 5),
             arrowprops=dict(arrowstyle='->', connectionstyle='arc3,rad=0.5'))

plt.show()
Output:
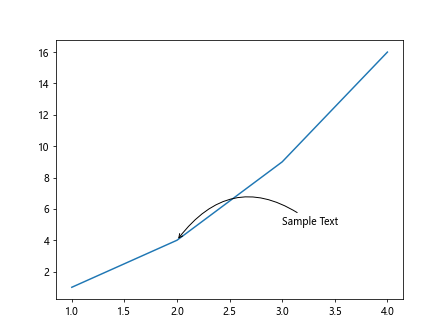
在这个示例中,设置了 arrowprops 参数的 arrowstyle='->' 表示箭头样式为箭头,设置了 connectionstyle='arc3,rad=0.5' 表示箭头的连接点为三次贝塞尔曲线。
添加拓展箭头的 annotation box
有时候我们需要添加一个带有拓展箭头的 annotation box,可以通过设置 arrowprops 参数的 arrowstyle 来实现:
import matplotlib.pyplot as plt

plt.figure()
plt.plot([1, 2, 3, 4], [1, 4, 9, 16])

# 添加拓展箭头的 annotation box
plt.annotate('Sample Text',
             xy=(2, 4),
             xytext=(3, 5),
             arrowprops=dict(arrowstyle='<|-', shrinkA=5, shrinkB=5))

plt.show()
Output:
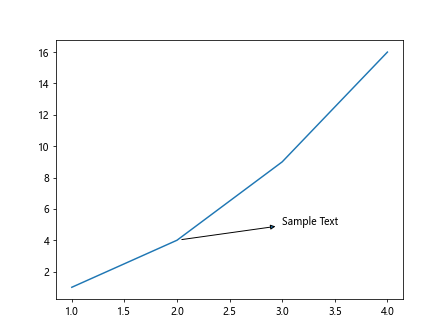
在这个示例中,设置了 arrowprops 参数的 arrowstyle='<|-' 表示箭头样式为带有一段拓展的箭头。
自定义 annotation box 外观
有时候我们需要完全自定义 annotation box 的外观,包括边框、填充、箭头等,可以通过 FancyBboxPatch 类来实现:
import matplotlib.pyplot as plt
from matplotlib.patches import FancyBboxPatch

plt.figure()
plt.plot([1, 2, 3, 4], [1, 4, 9, 16])

# 自定义 annotation box 外观
bbox_props = dict(boxstyle='round,pad=0.3', facecolor='yellow', edgecolor='green', alpha=0.5)
t = plt.text(2, 4, 'Sample Text', bbox=bbox_props)

plt.show()
Output:
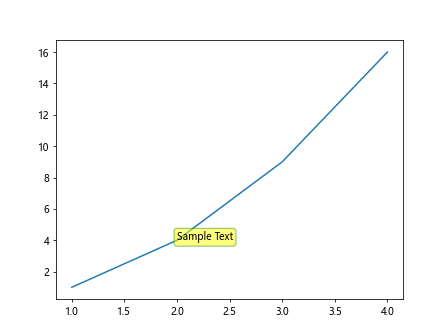
在这个示例中,我们使用了 FancyBboxPatch 类来创建一个自定义的文本框,设置了边框样式为圆形,背景色为黄色,边框颜色为绿色,透明度为 0.5。
添加 annotation box 在图中的绝对位置
有时候我们需要在图中的绝对位置添加 annotation box,可以通过设置 xycoords 参数为 figure points 来实现:
import matplotlib.pyplot as plt

plt.figure()
plt.plot([1, 2, 3, 4], [1, 4, 9, 16])

# 添加在图中绝对位置的 annotation box
plt.annotate('Sample Text',
             xy=(0.5, 0.5),
             xycoords='figure points',
             xytext=(100, 100),
             textcoords='offset points')

plt.show()
Output:
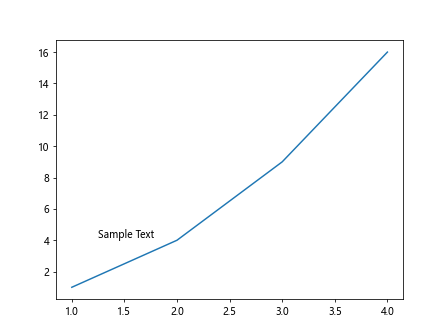
在这个示例中,设置了 xycoords='figure points' 表示 xy 坐标是相对于图的绝对位置,xytext=(100, 100) 表示文本框的位置相对于当前位置的偏移。
通过以上示例,我们详细介绍了如何在 Matplotlib 中使用 annotation box,包括基本的创建、样式设置、基于文本的添加、透明度控制、隐藏、辅助线等功能。annotation box 是一个非常实用的工具,可以帮助我们更清晰地展示数据图表,给用户提供更多信息。
 极客笔记
极客笔记