Matplotlib中使用Python为线条末端添加注释的全面指南
参考:Annotating the End of Lines Using Python and Matplotlib
Matplotlib是Python中强大的数据可视化库,它提供了丰富的功能来创建各种类型的图表和绘图。在数据可视化中,为线条末端添加注释是一种常见且有效的方法,可以帮助读者更好地理解图表中的信息。本文将详细介绍如何使用Python和Matplotlib为线条末端添加注释,包括各种注释类型、样式设置以及高级技巧。
1. 基本概念和准备工作
在开始为线条末端添加注释之前,我们需要了解一些基本概念并做好准备工作。
1.1 什么是线条末端注释?
线条末端注释是指在线条的终点或特定位置添加文本、箭头或其他标记,以提供额外的信息或解释。这种注释可以帮助读者快速理解数据点的含义、趋势或重要性。
1.2 环境准备
首先,确保你已经安装了Python和Matplotlib库。如果还没有安装,可以使用以下命令安装:
pip install matplotlib
1.3 基本导入
在开始编写代码之前,我们需要导入必要的库:
import matplotlib.pyplot as plt
import numpy as np
2. 简单的线条末端注释
让我们从最基本的线条末端注释开始。
2.1 使用text()函数添加文本注释
import matplotlib.pyplot as plt
import numpy as np

x = np.linspace(0, 10, 100)
y = np.sin(x)

plt.figure(figsize=(10, 6))
plt.plot(x, y, label='Sine wave')
plt.text(x[-1], y[-1], 'End point', fontsize=12, ha='right', va='bottom')
plt.title('Simple Line End Annotation - how2matplotlib.com')
plt.legend()
plt.grid(True)
plt.show()
Output:
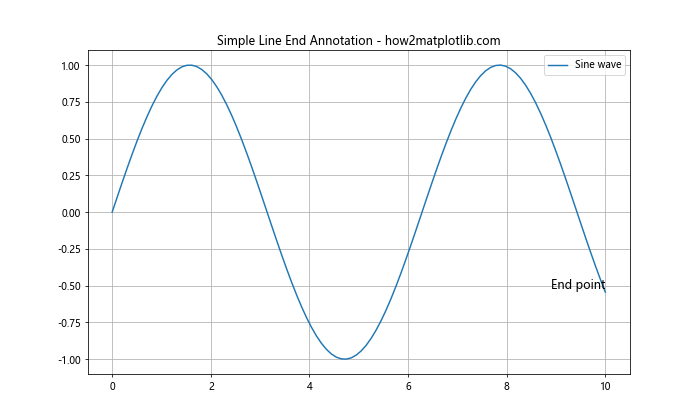
在这个例子中,我们使用text()函数在正弦波的末端添加了一个简单的文本注释。x[-1]和y[-1]表示线条的最后一个点的坐标。ha='right'和va='bottom'用于调整文本的水平和垂直对齐方式。
2.2 使用annotate()函数添加带箭头的注释
import matplotlib.pyplot as plt
import numpy as np

x = np.linspace(0, 10, 100)
y = np.cos(x)

plt.figure(figsize=(10, 6))
plt.plot(x, y, label='Cosine wave')
plt.annotate('End point', xy=(x[-1], y[-1]), xytext=(x[-1]+0.5, y[-1]+0.2),
             arrowprops=dict(facecolor='black', shrink=0.05),
             fontsize=12)
plt.title('Annotate with Arrow - how2matplotlib.com')
plt.legend()
plt.grid(True)
plt.show()
Output:
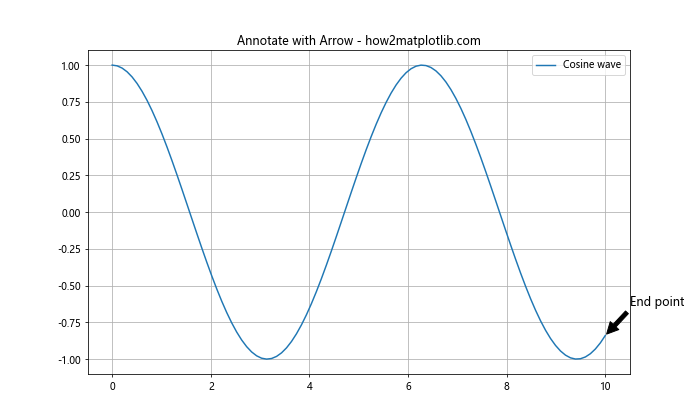
这个例子展示了如何使用annotate()函数添加带箭头的注释。xy参数指定箭头的目标点,xytext参数指定文本的位置,arrowprops用于自定义箭头的属性。
3. 自定义注释样式
Matplotlib提供了丰富的选项来自定义注释的样式,让我们来探索一些常用的自定义方法。
3.1 更改文本颜色和字体
import matplotlib.pyplot as plt
import numpy as np

x = np.linspace(0, 5, 50)
y = x**2

plt.figure(figsize=(10, 6))
plt.plot(x, y, label='Quadratic function')
plt.annotate('End point', xy=(x[-1], y[-1]), xytext=(x[-1]-1, y[-1]+5),
             arrowprops=dict(facecolor='red', shrink=0.05),
             fontsize=14, color='blue', fontweight='bold', fontstyle='italic')
plt.title('Customized Text Style - how2matplotlib.com')
plt.legend()
plt.grid(True)
plt.show()
Output:
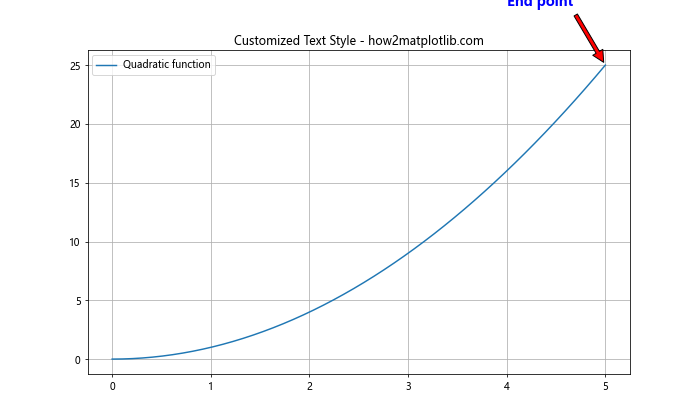
在这个例子中,我们自定义了注释文本的颜色、字体大小、粗细和样式。同时,我们还将箭头的颜色更改为红色。
3.2 使用不同的箭头样式
import matplotlib.pyplot as plt
import numpy as np

x = np.linspace(0, 4*np.pi, 100)
y = np.sin(x) * np.exp(-0.1*x)

plt.figure(figsize=(12, 6))
plt.plot(x, y, label='Damped sine wave')

styles = ['->', '<-', '<->', 'fancy', 'simple', 'wedge']
for i, style in enumerate(styles):
    plt.annotate(f'Style: {style}', xy=(x[i*15], y[i*15]), xytext=(x[i*15]+1, y[i*15]+0.2),
                 arrowprops=dict(arrowstyle=style, color=f'C{i}'),
                 fontsize=10, color=f'C{i}')

plt.title('Different Arrow Styles - how2matplotlib.com')
plt.legend()
plt.grid(True)
plt.show()
Output:
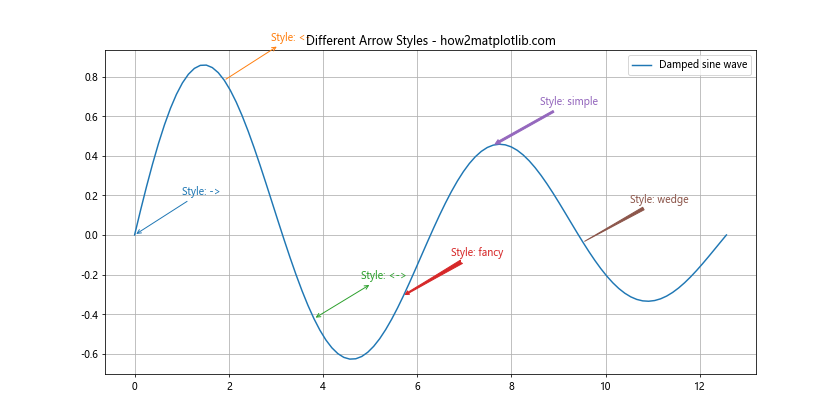
这个例子展示了Matplotlib中不同的箭头样式。我们使用循环为同一条曲线的不同点添加了不同样式的箭头注释。
3.3 添加背景框
import matplotlib.pyplot as plt
import numpy as np

x = np.linspace(0, 10, 100)
y = np.exp(-0.1*x) * np.sin(5*x)

plt.figure(figsize=(10, 6))
plt.plot(x, y, label='Oscillating decay')
plt.annotate('End point', xy=(x[-1], y[-1]), xytext=(x[-1]-2, y[-1]+0.2),
             arrowprops=dict(facecolor='black', shrink=0.05),
             fontsize=12, bbox=dict(boxstyle='round,pad=0.5', fc='yellow', alpha=0.5))
plt.title('Annotation with Background Box - how2matplotlib.com')
plt.legend()
plt.grid(True)
plt.show()
Output:
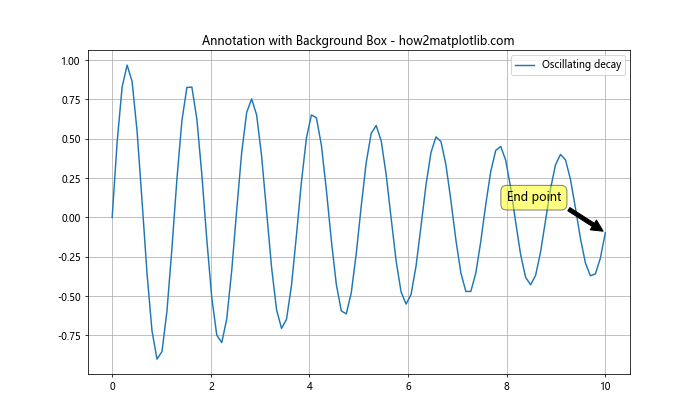
在这个例子中,我们为注释文本添加了一个背景框。bbox参数用于自定义背景框的样式,包括形状、填充颜色和透明度。
4. 多线条注释
在实际应用中,我们经常需要为多条线添加注释。让我们来看看如何处理这种情况。
4.1 为多条线添加末端注释
import matplotlib.pyplot as plt
import numpy as np

x = np.linspace(0, 10, 100)
y1 = np.sin(x)
y2 = np.cos(x)
y3 = np.tan(x)

plt.figure(figsize=(12, 8))
plt.plot(x, y1, label='Sine')
plt.plot(x, y2, label='Cosine')
plt.plot(x, y3, label='Tangent')

annotations = [('Sine end', x[-1], y1[-1]),
               ('Cosine end', x[-1], y2[-1]),
               ('Tangent end', x[-1], y3[-1])]

for text, x_pos, y_pos in annotations:
    plt.annotate(text, xy=(x_pos, y_pos), xytext=(x_pos+0.5, y_pos),
                 arrowprops=dict(facecolor='black', shrink=0.05),
                 fontsize=10)

plt.title('Multiple Line End Annotations - how2matplotlib.com')
plt.legend()
plt.grid(True)
plt.ylim(-2, 2)
plt.show()
Output:
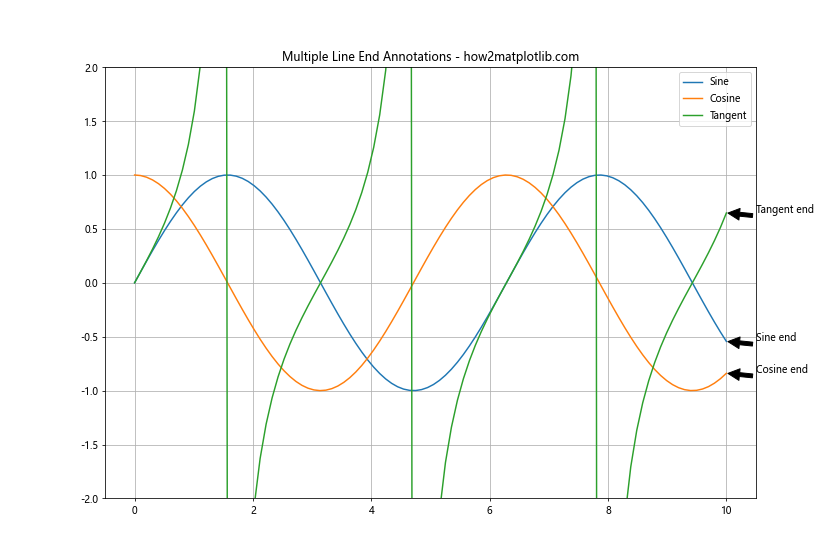
这个例子展示了如何为多条线的末端添加注释。我们使用一个循环来为每条线添加注释,使代码更加简洁和可维护。
4.2 使用不同颜色和样式
import matplotlib.pyplot as plt
import numpy as np

x = np.linspace(0, 5, 100)
y1 = x**2
y2 = x**3
y3 = np.exp(x)

plt.figure(figsize=(12, 8))
plt.plot(x, y1, 'r-', label='Quadratic')
plt.plot(x, y2, 'g--', label='Cubic')
plt.plot(x, y3, 'b:', label='Exponential')

annotations = [('Quadratic', x[-1], y1[-1], 'red'),
               ('Cubic', x[-1], y2[-1], 'green'),
               ('Exponential', x[-1], y3[-1], 'blue')]

for text, x_pos, y_pos, color in annotations:
    plt.annotate(text, xy=(x_pos, y_pos), xytext=(x_pos-1, y_pos+10),
                 arrowprops=dict(facecolor=color, shrink=0.05),
                 fontsize=10, color=color)

plt.title('Colored Annotations for Multiple Lines - how2matplotlib.com')
plt.legend()
plt.grid(True)
plt.show()
Output:
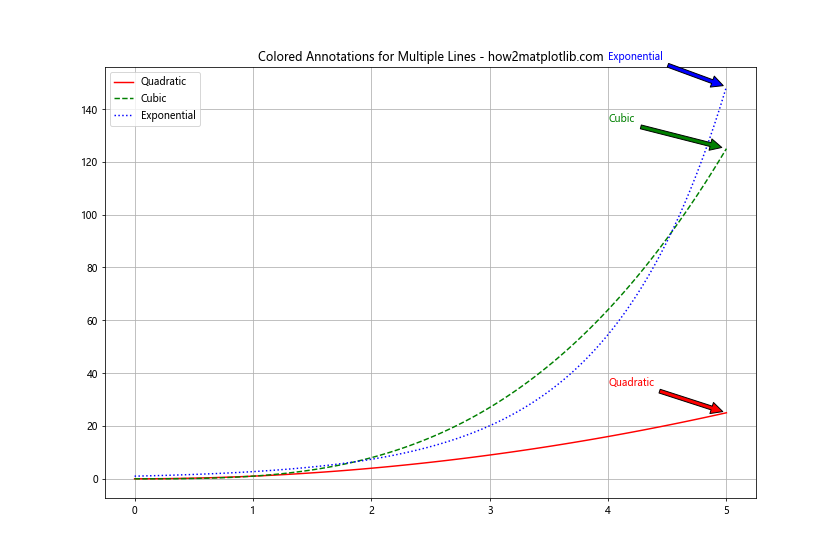
在这个例子中,我们为每条线使用了不同的颜色和线型,并相应地调整了注释的颜色。这样可以使图表更加清晰和易于理解。
5. 动态注释
有时,我们需要根据数据动态地添加注释。让我们来看看如何实现这一点。
5.1 根据数据值添加注释
import matplotlib.pyplot as plt
import numpy as np

np.random.seed(42)
x = np.linspace(0, 10, 50)
y = np.random.normal(0, 1, 50).cumsum()

plt.figure(figsize=(12, 6))
plt.plot(x, y, label='Random walk')

# 找到最大值和最小值
max_index = np.argmax(y)
min_index = np.argmin(y)

# 添加注释
plt.annotate(f'Max: {y[max_index]:.2f}', xy=(x[max_index], y[max_index]),
             xytext=(x[max_index]+0.5, y[max_index]+1),
             arrowprops=dict(facecolor='red', shrink=0.05),
             fontsize=10, color='red')

plt.annotate(f'Min: {y[min_index]:.2f}', xy=(x[min_index], y[min_index]),
             xytext=(x[min_index]+0.5, y[min_index]-1),
             arrowprops=dict(facecolor='blue', shrink=0.05),
             fontsize=10, color='blue')

plt.title('Dynamic Annotations Based on Data - how2matplotlib.com')
plt.legend()
plt.grid(True)
plt.show()
Output:
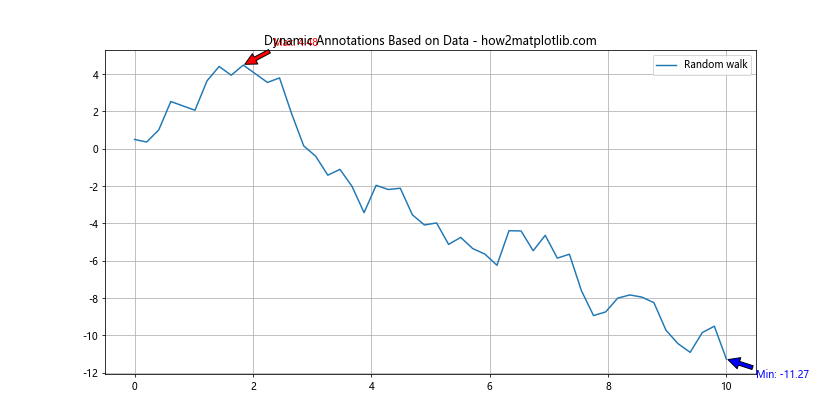
这个例子展示了如何根据数据的最大值和最小值动态添加注释。我们使用np.argmax()和np.argmin()函数找到最大值和最小值的索引,然后在相应的位置添加注释。
5.2 条件注释
import matplotlib.pyplot as plt
import numpy as np

x = np.linspace(0, 10, 100)
y = np.sin(x) * np.exp(-0.1*x)

plt.figure(figsize=(12, 6))
plt.plot(x, y, label='Damped sine wave')

threshold = 0.5
for i in range(len(x)):
    if abs(y[i]) > threshold:
        plt.annotate(f'{y[i]:.2f}', xy=(x[i], y[i]), xytext=(x[i]+0.1, y[i]),
                     arrowprops=dict(facecolor='black', shrink=0.05),
                     fontsize=8)

plt.title('Conditional Annotations - how2matplotlib.com')
plt.legend()
plt.grid(True)
plt.show()
Output:
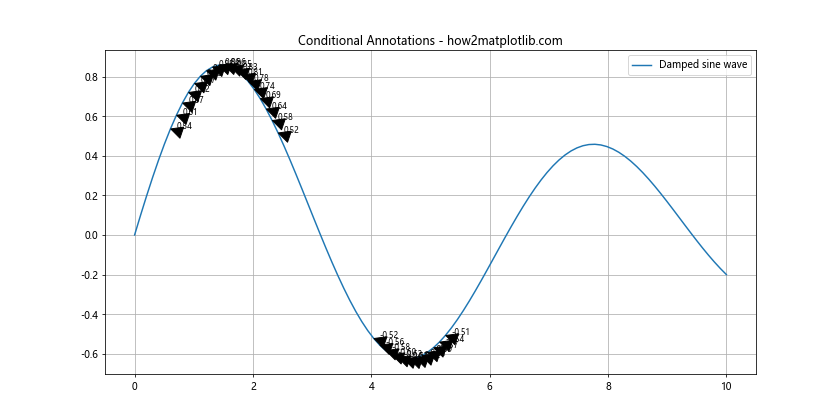
在这个例子中,我们只为绝对值大于某个阈值的点添加注释。这种方法可以帮助我们突出显示重要的数据点,而不会使图表变得过于杂乱。
6. 高级注释技巧
让我们探索一些更高级的注释技巧,这些技巧可以帮助我们创建更专业和信息丰富的图表。
6.1 使用LaTeX公式
Matplotlib支持在注释中使用LaTeX公式,这对于添加数学表达式非常有用。
import matplotlib.pyplot as plt
import numpy as np

x = np.linspace(0, 2*np.pi, 100)
y = np.sin(x)

plt.figure(figsize=(10, 6))
plt.plot(x, y, label='Sine wave')

plt.annotate(r'\sin(x) = 0', xy=(np.pi, 0), xytext=(np.pi+0.5, 0.5),
             arrowprops=dict(facecolor='black', shrink=0.05),
             fontsize=12)

plt.annotate(r'\frac{d}{dx}\sin(x) = \cos(x)', xy=(np.pi/2, 1), xytext=(np.pi/2+0.5, 0.5),
             arrowprops=dict(facecolor='black', shrink=0.05),
             fontsize=12)

plt.title('LaTeX Annotations - how2matplotlib.com')
plt.legend()
plt.grid(True)
plt.show()
Output:
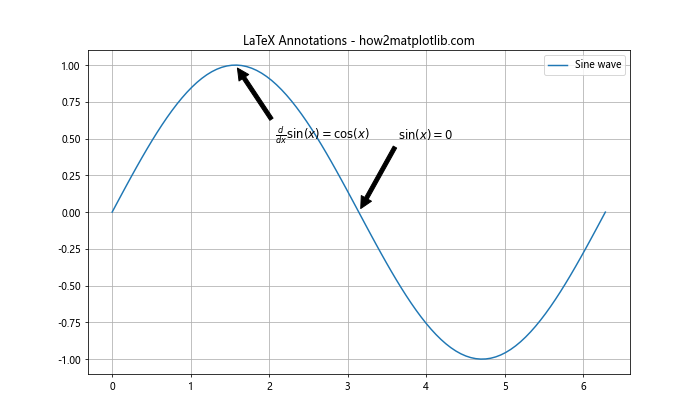
在这个例子中,我们使用LaTeX公式来添加数学表达式。注意使用r前缀来表示原始字符串,这样可以避免转义字符的问题。
6.2 添加图像注释
除了文本,我们还可以在注释中添加小图像。
import matplotlib.pyplot as plt
import numpy as np
from matplotlib.offsetbox import OffsetImage, AnnotationBbox

def add_image_annotation(ax, im, xy, box_xy):
    imagebox = OffsetImage(im,zoom=0.5)
    ab = AnnotationBbox(imagebox, xy,
                        xybox=box_xy,
                        xycoords='data',
                        boxcoords="offset points",
                        arrowprops=dict(arrowstyle="->"))
    ax.add_artist(ab)

x = np.linspace(0, 10, 100)
y = np.sin(x)

fig, ax = plt.subplots(figsize=(12, 6))
ax.plot(x, y, label='Sine wave')

# 创建一个小的正弦波图像
small_fig, small_ax = plt.subplots(figsize=(2, 2))
small_ax.plot(x, y)
small_ax.axis('off')
plt.close(small_fig)

add_image_annotation(ax, small_fig, (x[-1], y[-1]), (50, 50))

ax.set_title('Image Annotation - how2matplotlib.com')
ax.legend()
ax.grid(True)
plt.show()
这个例子展示了如何在注释中添加一个小图像。我们首先创建了一个小的正弦波图像,然后使用OffsetImage和AnnotationBbox将其添加到主图中。
6.3 交互式注释
Matplotlib还支持交互式注释,这在探索数据时非常有用。
import matplotlib.pyplot as plt
import numpy as np
from matplotlib.widgets import Button

x = np.linspace(0, 10, 100)
y = np.sin(x)

fig, ax = plt.subplots(figsize=(10, 6))
line, = ax.plot(x, y, label='Sine wave')
ax.set_title('Interactive Annotation - how2matplotlib.com')
ax.legend()
ax.grid(True)

annotation = ax.annotate('', xy=(0, 0), xytext=(20, 20),
                         textcoords="offset points",
                         bbox=dict(boxstyle="round", fc="w"),
                         arrowprops=dict(arrowstyle="->"))
annotation.set_visible(False)

def update_annotation(event):
    x, y = event.xdata, event.ydata
    annotation.xy = (x, y)
    annotation.set_text(f'x={x:.2f}, y={y:.2f}')
    annotation.set_visible(True)
    fig.canvas.draw_idle()

fig.canvas.mpl_connect('motion_notify_event', update_annotation)

plt.show()
Output:
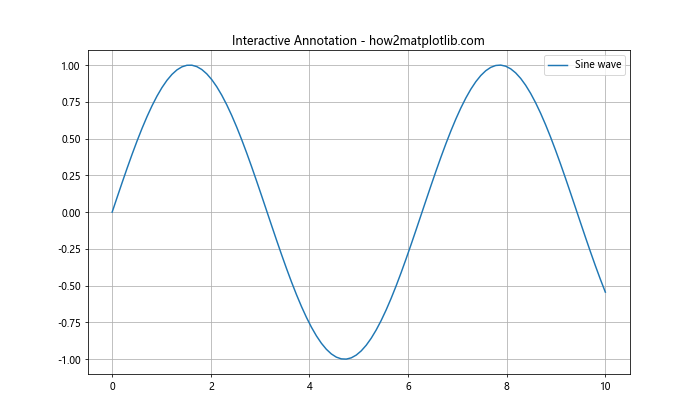
这个例子创建了一个交互式注释。当鼠标移动到图表上时,会显示当前点的坐标。
7. 注释的最佳实践
在使用注释时,有一些最佳实践可以帮助我们创建更清晰、更有效的图表:
- 保持简洁:只添加必要的注释,避免过度拥挤。
- 使用一致的样式:在整个图表中保持一致的字体、颜色和大小。
- 考虑可读性:确保注释不会与图表的其他元素重叠。
- 使用对比色:选择与背景形成良好对比的颜色。
- 适当的位置:将注释放在不会干扰数据理解的位置。
- 使用清晰的语言:使用简洁、明确的语言来描述数据点。
8. 常见问题和解决方案
在使用Matplotlib添加线条末端注释时,可能会遇到一些常见问题。以下是一些问题及其解决方案:
8.1 注释重叠
当多个数据点靠近时,注释可能会重叠。解决这个问题的一种方法是使用不同的xytext位置:
import matplotlib.pyplot as plt
import numpy as np

x = np.linspace(0, 10, 5)
y1 = np.sin(x)
y2 = np.sin(x) + 0.1

plt.figure(figsize=(10, 6))
plt.plot(x, y1, label='Line 1')
plt.plot(x, y2, label='Line 2')

plt.annotate('End of Line 1', xy=(x[-1], y1[-1]), xytext=(x[-1]+0.5, y1[-1]-0.2),
             arrowprops=dict(facecolor='black', shrink=0.05))
plt.annotate('End of Line 2', xy=(x[-1], y2[-1]), xytext=(x[-1]+0.5, y2[-1]+0.2),
             arrowprops=dict(facecolor='black', shrink=0.05))

plt.title('Avoiding Annotation Overlap - how2matplotlib.com')
plt.legend()
plt.grid(True)
plt.show()
Output:
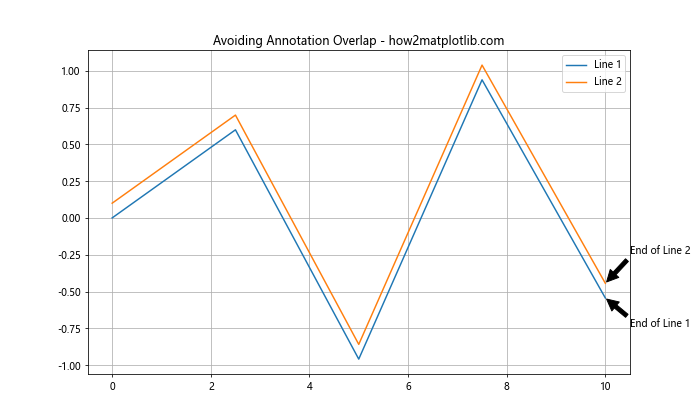
在这个例子中,我们通过调整xytext的y坐标来避免注释重叠。
8.2 注释超出图表边界
当注释位置靠近图表边缘时,可能会超出图表边界。解决这个问题的一种方法是使用clip_on=True参数:
import matplotlib.pyplot as plt
import numpy as np

x = np.linspace(0, 10, 100)
y = np.exp(x)

plt.figure(figsize=(10, 6))
plt.plot(x, y, label='Exponential')

plt.annotate('End point', xy=(x[-1], y[-1]), xytext=(x[-1]-2, y[-1]),
             arrowprops=dict(facecolor='black', shrink=0.05),
             clip_on=True)

plt.title('Clipping Annotation - how2matplotlib.com')
plt.legend()
plt.grid(True)
plt.show()
Output:
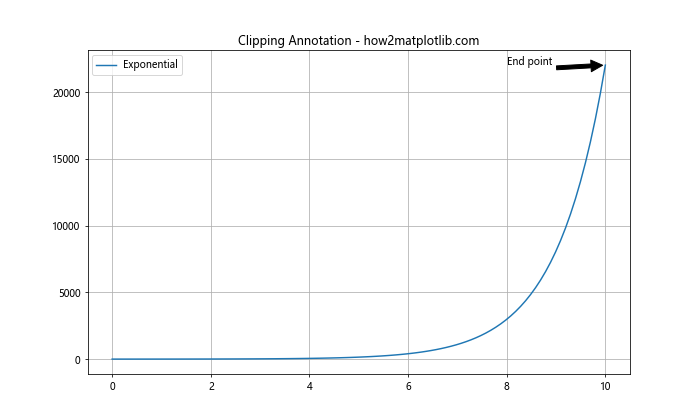
clip_on=True参数确保注释不会超出图表的边界。
8.3 自动调整注释位置
对于复杂的图表,手动调整每个注释的位置可能很麻烦。我们可以创建一个函数来自动调整注释位置:
import matplotlib.pyplot as plt
import numpy as np

def smart_annotate(ax, text, xy, xytext=None):
    annotation = ax.annotate(text, xy, xytext=xytext,
                             arrowprops=dict(arrowstyle='->'),
                             bbox=dict(boxstyle='round,pad=0.5', fc='yellow', alpha=0.5))

    # 获取图表的边界
    bbox = ax.get_window_extent().transformed(plt.gcf().dpi_scale_trans.inverted())

    # 调整注释位置
    annotation.set_position(smart_position(xy, bbox))

    return annotation

def smart_position(xy, bbox):
    x, y = xy
    width, height = bbox.width, bbox.height

    if x < width / 2:
        x_text = x + width * 0.1
    else:
        x_text = x - width * 0.1

    if y < height / 2:
        y_text = y + height * 0.1
    else:
        y_text = y - height * 0.1

    return x_text, y_text

x = np.linspace(0, 10, 100)
y1 = np.sin(x)
y2 = np.cos(x)

fig, ax = plt.subplots(figsize=(10, 6))
ax.plot(x, y1, label='Sine')
ax.plot(x, y2, label='Cosine')

smart_annotate(ax, 'Sine end', (x[-1], y1[-1]))
smart_annotate(ax, 'Cosine end', (x[-1], y2[-1]))

ax.set_title('Smart Annotation Positioning - how2matplotlib.com')
ax.legend()
ax.grid(True)
plt.show()
Output:
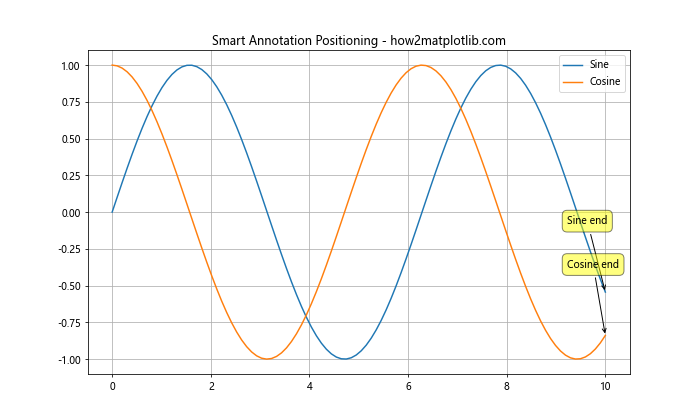
这个例子定义了一个smart_annotate函数,它会根据数据点的位置自动选择合适的注释位置。
9. 高级应用场景
让我们探索一些更高级的应用场景,这些场景可能在实际数据分析和可视化中非常有用。
9.1 时间序列数据注释
对于时间序列数据,我们可能想要标注特定的事件或转折点。
import matplotlib.pyplot as plt
import numpy as np
import pandas as pd

# 创建示例时间序列数据
dates = pd.date_range(start='2023-01-01', end='2023-12-31', freq='D')
values = np.cumsum(np.random.randn(len(dates))) + 100

# 创建DataFrame
df = pd.DataFrame({'Date': dates, 'Value': values})

# 找到最大值和最小值
max_point = df.loc[df['Value'].idxmax()]
min_point = df.loc[df['Value'].idxmin()]

fig, ax = plt.subplots(figsize=(12, 6))
ax.plot(df['Date'], df['Value'])

# 添加注释
ax.annotate(f'Max: {max_point["Value"]:.2f}',
            xy=(max_point['Date'], max_point['Value']),
            xytext=(10, 10), textcoords='offset points',
            arrowprops=dict(arrowstyle='->'))

ax.annotate(f'Min: {min_point["Value"]:.2f}',
            xy=(min_point['Date'], min_point['Value']),
            xytext=(10, -10), textcoords='offset points',
            arrowprops=dict(arrowstyle='->'))

ax.set_title('Time Series Annotation - how2matplotlib.com')
plt.xticks(rotation=45)
plt.tight_layout()
plt.show()
Output:
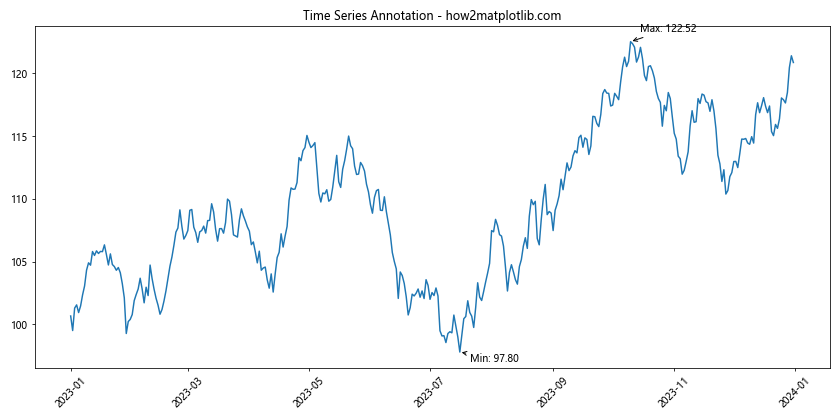
这个例子展示了如何在时间序列数据中标注最大值和最小值点。
9.2 多子图注释
在复杂的分析中,我们可能需要创建多个子图并为每个子图添加注释。
import matplotlib.pyplot as plt
import numpy as np

x = np.linspace(0, 10, 100)

fig, (ax1, ax2) = plt.subplots(2, 1, figsize=(10, 10))

# 第一个子图
y1 = np.sin(x)
ax1.plot(x, y1)
ax1.set_title('Sine Wave - how2matplotlib.com')
ax1.annotate('Peak', xy=(np.pi/2, 1), xytext=(np.pi/2+1, 0.5),
             arrowprops=dict(facecolor='black', shrink=0.05))

# 第二个子图
y2 = np.cos(x)
ax2.plot(x, y2)
ax2.set_title('Cosine Wave - how2matplotlib.com')
ax2.annotate('Trough', xy=(np.pi, -1), xytext=(np.pi+1, -0.5),
             arrowprops=dict(facecolor='black', shrink=0.05))

plt.tight_layout()
plt.show()
Output:
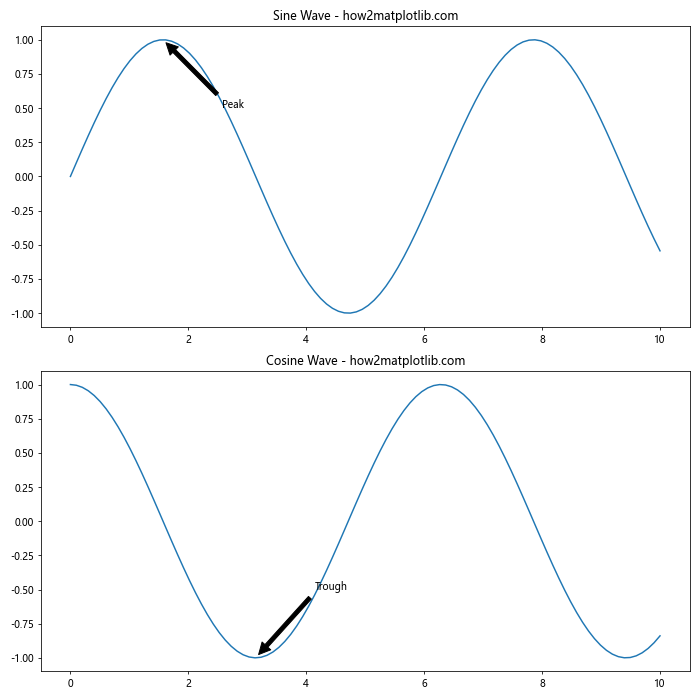
这个例子展示了如何在多个子图中添加注释。每个子图都有自己的注释,帮助解释各自的特征。
9.3 动态注释更新
在某些情况下,我们可能需要根据用户交互动态更新注释。
import matplotlib.pyplot as plt
import numpy as np
from matplotlib.widgets import Slider

x = np.linspace(0, 10, 1000)
y = np.sin(x)

fig, ax = plt.subplots(figsize=(10, 8))
line, = ax.plot(x, y)

# 添加滑块
axfreq = plt.axes([0.25, 0.02, 0.5, 0.03])
freq_slider = Slider(axfreq, 'Frequency', 0.1, 10.0, valinit=1)

# 添加初始注释
annotation = ax.annotate('', xy=(0, 0), xytext=(20, 20),
                         textcoords="offset points",
                         bbox=dict(boxstyle="round", fc="w"),
                         arrowprops=dict(arrowstyle="->"))
annotation.set_visible(False)

def update(val):
    freq = freq_slider.val
    y = np.sin(freq * x)
    line.set_ydata(y)

    # 更新注释
    max_index = np.argmax(y)
    annotation.xy = (x[max_index], y[max_index])
    annotation.set_text(f'Max: ({x[max_index]:.2f}, {y[max_index]:.2f})')
    annotation.set_visible(True)

    fig.canvas.draw_idle()

freq_slider.on_changed(update)

ax.set_title('Dynamic Annotation Update - how2matplotlib.com')
plt.show()
Output:
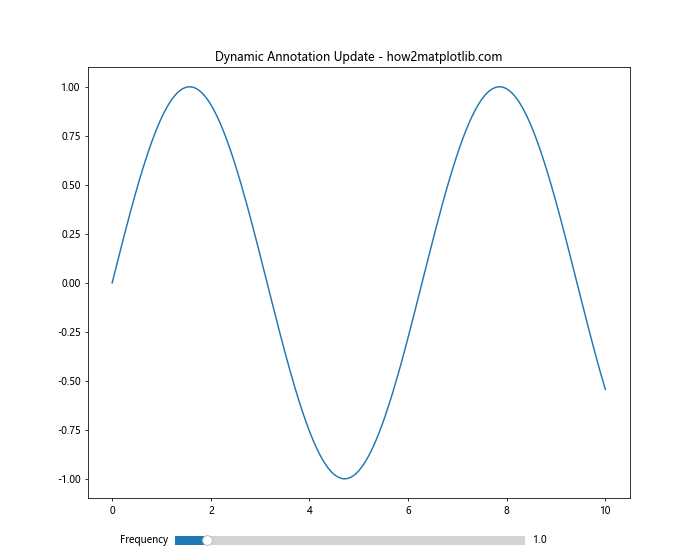
这个例子创建了一个交互式图表,用户可以通过滑块调整正弦波的频率,注释会动态更新以显示当前的最大值位置。
10. 结论
在本文中,我们深入探讨了如何使用Python和Matplotlib为线条末端添加注释。我们从基本的文本注释开始,逐步深入到更复杂的技巧,包括自定义样式、多线条注释、动态注释、LaTeX公式、图像注释和交互式注释等。我们还讨论了一些常见问题的解决方案和最佳实践。
注释是数据可视化中的一个强大工具,它可以帮助我们突出重要信息、解释复杂概念,并使图表更加清晰和易于理解。通过掌握这些技巧,你可以创建更加专业和信息丰富的图表,更好地传达你的数据洞察。
记住,好的注释应该是简洁、清晰和有目的的。过度使用注释可能会使图表变得杂乱和难以理解。始终考虑你的目标受众,并选择最适合你的数据和信息的注释方式。
随着实践和经验的积累,你将能够更加自如地运用这些技巧,创造出既美观又富有洞察力的数据可视化作品。继续探索Matplotlib的其他功能,将帮助你在数据可视化的道路上走得更远。
 极客笔记
极客笔记