Matplotlib动画散点图:如何创建生动的数据可视化
参考:Animating Scatter Plots in Matplotlib
Matplotlib是Python中最流行的数据可视化库之一,它不仅能够创建静态图表,还能制作动态的动画图表。在本文中,我们将深入探讨如何使用Matplotlib来创建动画散点图,这是一种非常有效的方式来展示数据随时间变化的趋势或模式。通过动画散点图,我们可以直观地观察数据点的移动、聚集或分散,从而更好地理解数据的动态特性。
1. 动画散点图的基础
要创建动画散点图,我们首先需要了解Matplotlib的动画模块。Matplotlib提供了animation模块,其中包含了创建动画所需的各种工具和类。最常用的是FuncAnimation类,它允许我们通过定义一个更新函数来创建动画。
让我们从一个简单的例子开始:
import numpy as np
import matplotlib.pyplot as plt
from matplotlib.animation import FuncAnimation

# 创建初始数据
x = np.random.rand(20)
y = np.random.rand(20)

# 创建图形和散点
fig, ax = plt.subplots()
scatter = ax.scatter(x, y)

# 定义更新函数
def update(frame):
    # 更新数据
    x = np.random.rand(20)
    y = np.random.rand(20)
    scatter.set_offsets(np.c_[x, y])
    ax.set_title(f"Frame {frame} - how2matplotlib.com")
    return scatter,

# 创建动画
anim = FuncAnimation(fig, update, frames=200, interval=50, blit=True)

plt.show()
Output:
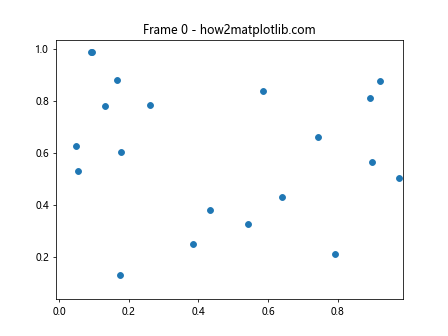
在这个例子中,我们首先创建了一些随机数据点。然后,我们定义了一个update函数,它在每一帧都会生成新的随机数据并更新散点的位置。FuncAnimation类使用这个update函数来创建动画,每50毫秒更新一次,总共200帧。
2. 自定义动画效果
我们可以通过修改update函数来创建各种有趣的动画效果。例如,我们可以让点沿着某个轨迹移动,或者根据某些条件改变点的大小和颜色。
以下是一个让点沿着圆形轨迹移动的例子:
import numpy as np
import matplotlib.pyplot as plt
from matplotlib.animation import FuncAnimation

# 创建初始数据
theta = np.linspace(0, 2*np.pi, 50)
x = np.cos(theta)
y = np.sin(theta)

# 创建图形和散点
fig, ax = plt.subplots()
scatter = ax.scatter(x, y)

# 设置图形范围
ax.set_xlim(-1.5, 1.5)
ax.set_ylim(-1.5, 1.5)

# 定义更新函数
def update(frame):
    # 更新数据
    x = np.cos(theta + frame/10)
    y = np.sin(theta + frame/10)
    scatter.set_offsets(np.c_[x, y])
    ax.set_title(f"Frame {frame} - how2matplotlib.com")
    return scatter,

# 创建动画
anim = FuncAnimation(fig, update, frames=200, interval=50, blit=True)

plt.show()
Output:
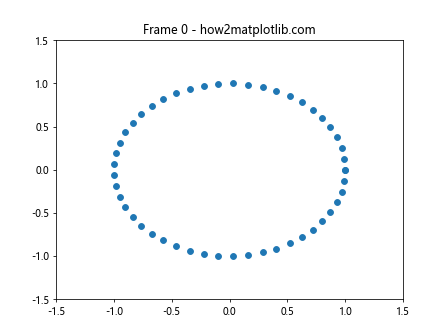
在这个例子中,我们创建了一组点,它们初始位置在一个圆上。在update函数中,我们通过改变角度来让点沿着圆形轨迹移动。
3. 添加颜色变化
我们还可以在动画中添加颜色变化,使得视觉效果更加丰富。以下是一个例子,展示了如何让点的颜色随时间变化:
import numpy as np
import matplotlib.pyplot as plt
from matplotlib.animation import FuncAnimation
import matplotlib.colors as colors

# 创建初始数据
x = np.random.rand(50)
y = np.random.rand(50)

# 创建图形和散点
fig, ax = plt.subplots()
scatter = ax.scatter(x, y, c=np.random.rand(50), cmap='viridis')

# 定义更新函数
def update(frame):
    # 更新数据
    x = np.random.rand(50)
    y = np.random.rand(50)
    c = np.random.rand(50)
    scatter.set_offsets(np.c_[x, y])
    scatter.set_array(c)
    ax.set_title(f"Frame {frame} - how2matplotlib.com")
    return scatter,

# 创建动画
anim = FuncAnimation(fig, update, frames=200, interval=50, blit=True)

plt.colorbar(scatter)
plt.show()
Output:
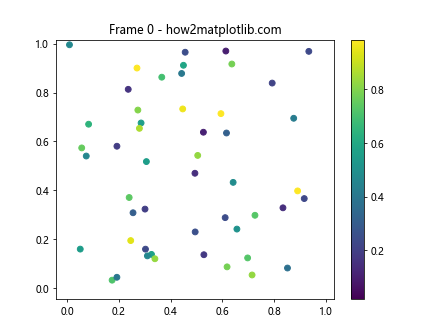
在这个例子中,我们为每个点分配了一个随机的颜色值,并使用viridis颜色映射。在update函数中,我们不仅更新了点的位置,还更新了它们的颜色。
4. 添加轨迹
有时,我们可能想要显示点的移动轨迹。这可以通过在每一帧保留前几帧的点位置来实现。以下是一个例子:
import numpy as np
import matplotlib.pyplot as plt
from matplotlib.animation import FuncAnimation

# 创建初始数据
x = np.random.rand(10)
y = np.random.rand(10)

# 创建图形和散点
fig, ax = plt.subplots()
scatter = ax.scatter(x, y)

# 存储历史位置
history_len = 10
x_history = np.zeros((history_len, len(x)))
y_history = np.zeros((history_len, len(y)))

# 定义更新函数
def update(frame):
    global x_history, y_history
    # 更新数据
    x = np.random.rand(10)
    y = np.random.rand(10)

    # 更新历史
    x_history = np.roll(x_history, 1, axis=0)
    y_history = np.roll(y_history, 1, axis=0)
    x_history[0] = x
    y_history[0] = y

    # 清除之前的绘图
    ax.clear()

    # 绘制历史轨迹
    for i in range(1, history_len):
        alpha = 1 - i/history_len
        ax.scatter(x_history[i], y_history[i], alpha=alpha, color='gray')

    # 绘制当前位置
    scatter = ax.scatter(x, y, color='red')

    ax.set_xlim(0, 1)
    ax.set_ylim(0, 1)
    ax.set_title(f"Frame {frame} - how2matplotlib.com")
    return scatter,

# 创建动画
anim = FuncAnimation(fig, update, frames=200, interval=50, blit=False)

plt.show()
Output:
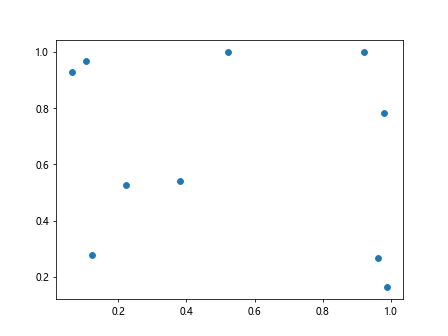
在这个例子中,我们使用了一个数组来存储每个点的历史位置。在每一帧,我们都会绘制这些历史位置,但是使用较低的透明度,这样就形成了一个渐变的轨迹效果。
5. 添加交互性
Matplotlib还允许我们为动画添加交互性。例如,我们可以添加一个滑块来控制动画的某些参数。以下是一个例子:
import numpy as np
import matplotlib.pyplot as plt
from matplotlib.animation import FuncAnimation
from matplotlib.widgets import Slider

# 创建初始数据
x = np.random.rand(20)
y = np.random.rand(20)

# 创建图形和散点
fig, ax = plt.subplots()
scatter = ax.scatter(x, y)

# 添加滑块
ax_slider = plt.axes([0.2, 0.02, 0.6, 0.03])
slider = Slider(ax_slider, 'Speed', 0.1, 2.0, valinit=1.0)

# 定义更新函数
def update(frame):
    # 更新数据
    global x, y
    x += np.random.normal(0, 0.01, 20) * slider.val
    y += np.random.normal(0, 0.01, 20) * slider.val
    x = np.clip(x, 0, 1)
    y = np.clip(y, 0, 1)
    scatter.set_offsets(np.c_[x, y])
    ax.set_title(f"Frame {frame} - how2matplotlib.com")
    return scatter,

# 创建动画
anim = FuncAnimation(fig, update, frames=200, interval=50, blit=True)

plt.show()
Output:
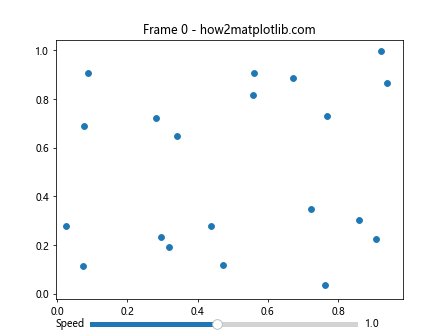
在这个例子中,我们添加了一个滑块来控制点移动的速度。滑块的值被用作update函数中随机移动的缩放因子。
6. 3D动画散点图
Matplotlib也支持3D图形的动画。以下是一个3D动画散点图的例子:
import numpy as np
import matplotlib.pyplot as plt
from matplotlib.animation import FuncAnimation
from mpl_toolkits.mplot3d import Axes3D

# 创建初始数据
n = 100
x = np.random.rand(n)
y = np.random.rand(n)
z = np.random.rand(n)

# 创建3D图形和散点
fig = plt.figure()
ax = fig.add_subplot(111, projection='3d')
scatter = ax.scatter(x, y, z)

# 定义更新函数
def update(frame):
    # 更新数据
    global x, y, z
    x += np.random.normal(0, 0.01, n)
    y += np.random.normal(0, 0.01, n)
    z += np.random.normal(0, 0.01, n)
    scatter._offsets3d = (x, y, z)
    ax.set_title(f"Frame {frame} - how2matplotlib.com")
    return scatter,

# 创建动画
anim = FuncAnimation(fig, update, frames=200, interval=50, blit=False)

plt.show()
Output:
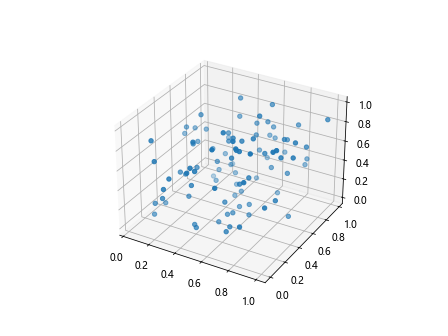
在这个例子中,我们创建了一个3D散点图,并让点在三维空间中随机移动。注意,对于3D图形,我们需要使用_offsets3d属性来更新点的位置。
7. 保存动画
创建动画后,我们可能希望将其保存为文件以便分享或嵌入到其他文档中。Matplotlib支持将动画保存为多种格式,包括GIF和MP4。以下是一个保存动画为GIF的例子:
import numpy as np
import matplotlib.pyplot as plt
from matplotlib.animation import FuncAnimation, PillowWriter

# 创建初始数据
x = np.random.rand(20)
y = np.random.rand(20)

# 创建图形和散点
fig, ax = plt.subplots()
scatter = ax.scatter(x, y)

# 定义更新函数
def update(frame):
    # 更新数据
    x = np.random.rand(20)
    y = np.random.rand(20)
    scatter.set_offsets(np.c_[x, y])
    ax.set_title(f"Frame {frame} - how2matplotlib.com")
    return scatter,

# 创建动画
anim = FuncAnimation(fig, update, frames=100, interval=50, blit=True)

# 保存动画
writer = PillowWriter(fps=25)
anim.save("scatter_animation.gif", writer=writer)

plt.close()
在这个例子中,我们使用PillowWriter来将动画保存为GIF格式。注意,你需要安装Pillow库才能使用这个功能。
8. 自定义点的样式
我们可以通过自定义点的样式来增强动画的视觉效果。例如,我们可以改变点的大小、形状和边框颜色。以下是一个例子:
import numpy as np
import matplotlib.pyplot as plt
from matplotlib.animation import FuncAnimation

# 创建初始数据
x = np.random.rand(20)
y = np.random.rand(20)
sizes = np.random.randint(20, 200, 20)

# 创建图形和散点
fig, ax = plt.subplots()
scatter = ax.scatter(x, y, s=sizes, c=np.random.rand(20), cmap='viridis',
                     alpha=0.7, edgecolors='black', linewidths=2)

# 定义更新函数
def update(frame):
    # 更新数据
    x = np.random.rand(20)
    y = np.random.rand(20)
    sizes = np.random.randint(20, 200, 20)
    colors = np.random.rand(20)
    scatter.set_offsets(np.c_[x, y])
    scatter.set_sizes(sizes)
    scatter.set_array(colors)
    ax.set_title(f"Frame {frame} - how2matplotlib.com")
    return scatter,

# 创建动画
anim = FuncAnimation(fig, update, frames=200, interval=50, blit=True)

plt.colorbar(scatter)
plt.show()
Output:
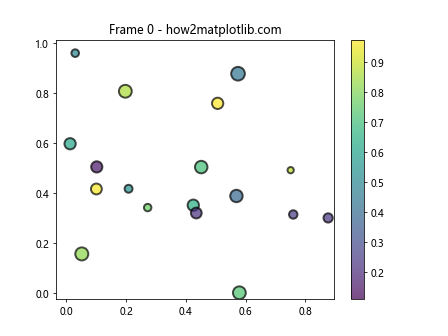
在这个例子中,我们为每个点设置了不同的大小和颜色,并添加了黑色边框。在update函数中,我们不仅更新了点的位置,还更新了它们的大小和颜色。
9. 添加文本标签
有时,我们可能想要为散点图中的某些点添加文本标签。这可以通过在动画中动态更新文本对象来实现。以下是一个例子:
import numpy as np
import matplotlib.pyplot as plt
from matplotlib.animation import FuncAnimation

# 创建初始数据
x = np.random.rand(5)
y = np.random.rand(5)
labels = [f"Point {i}" for i in range(5)]

# 创建图形和散点
fig, ax = plt

.subplots()
scatter = ax.scatter(x, y)
texts = [ax.text(x[i], y[i], labels[i]) for i in range(5)]

# 定义更新函数
def update(frame):
    # 更新数据
    x = np.random.rand(5)
    y = np.random.rand(5)
    scatter.set_offsets(np.c_[x, y])

    # 更新文本位置
    for i, txt in enumerate(texts):
        txt.set_position((x[i], y[i]))

    ax.set_title(f"Frame {frame} - how2matplotlib.com")
    return scatter, *texts

# 创建动画
anim = FuncAnimation(fig, update, frames=200, interval=50, blit=True)

plt.show()
在这个例子中,我们为每个点创建了一个文本对象。在update函数中,我们不仅更新了点的位置,还更新了相应文本标签的位置。
10. 添加数据轨迹
除了显示当前的数据点,我们还可以显示数据点的移动轨迹。这可以通过在每一帧绘制线条来实现。以下是一个例子:
import numpy as np
import matplotlib.pyplot as plt
from matplotlib.animation import FuncAnimation

# 创建初始数据
x = np.random.rand(5)
y = np.random.rand(5)

# 创建图形和散点
fig, ax = plt.subplots()
scatter = ax.scatter(x, y)

# 存储历史数据
history_x = [x.copy()]
history_y = [y.copy()]

# 定义更新函数
def update(frame):
    global x, y, history_x, history_y

    # 更新数据
    x += np.random.normal(0, 0.01, 5)
    y += np.random.normal(0, 0.01, 5)
    x = np.clip(x, 0, 1)
    y = np.clip(y, 0, 1)

    # 存储历史数据
    history_x.append(x.copy())
    history_y.append(y.copy())

    # 只保留最近的50帧数据
    if len(history_x) > 50:
        history_x.pop(0)
        history_y.pop(0)

    # 清除之前的绘图
    ax.clear()

    # 绘制轨迹
    for i in range(5):
        ax.plot([h[i] for h in history_x], [h[i] for h in history_y], alpha=0.5)

    # 绘制当前点
    scatter = ax.scatter(x, y)

    ax.set_xlim(0, 1)
    ax.set_ylim(0, 1)
    ax.set_title(f"Frame {frame} - how2matplotlib.com")

    return scatter,

# 创建动画
anim = FuncAnimation(fig, update, frames=200, interval=50, blit=False)

plt.show()
Output:
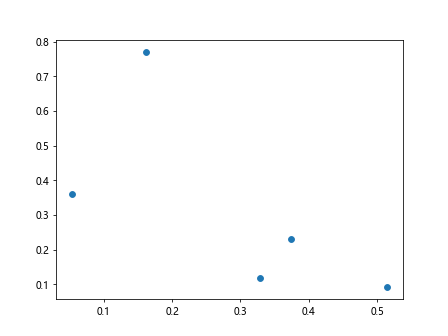
在这个例子中,我们存储了每个点的历史位置,并在每一帧绘制这些历史位置,形成了移动轨迹。
11. 添加渐变效果
我们可以通过改变点的透明度来创建渐变效果,使得最近的点更加突出。以下是一个例子:
import numpy as np
import matplotlib.pyplot as plt
from matplotlib.animation import FuncAnimation

# 创建初始数据
x = np.random.rand(20)
y = np.random.rand(20)

# 创建图形和散点
fig, ax = plt.subplots()
scatter = ax.scatter(x, y, alpha=0.5)

# 存储历史数据
history_len = 10
history_x = [x.copy() for _ in range(history_len)]
history_y = [y.copy() for _ in range(history_len)]

# 定义更新函数
def update(frame):
    global history_x, history_y

    # 更新数据
    x = np.random.rand(20)
    y = np.random.rand(20)

    # 更新历史数据
    history_x.pop(0)
    history_y.pop(0)
    history_x.append(x)
    history_y.append(y)

    # 清除之前的绘图
    ax.clear()

    # 绘制历史点和当前点
    for i, (hx, hy) in enumerate(zip(history_x, history_y)):
        alpha = (i + 1) / history_len
        ax.scatter(hx, hy, alpha=alpha, color='blue')

    ax.set_xlim(0, 1)
    ax.set_ylim(0, 1)
    ax.set_title(f"Frame {frame} - how2matplotlib.com")

    return ax.collections

# 创建动画
anim = FuncAnimation(fig, update, frames=200, interval=50, blit=True)

plt.show()
Output:
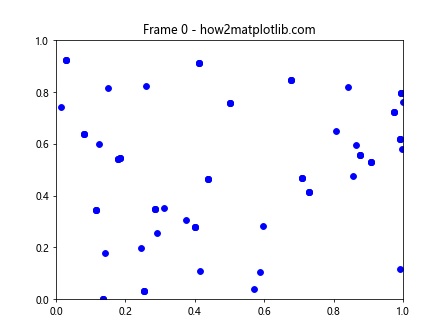
在这个例子中,我们存储了多个历史帧的数据,并在每一帧中绘制这些历史数据,但使用不同的透明度,创造出一种渐变效果。
12. 添加数据标签
有时,我们可能想要在动画中显示一些数据标签或统计信息。我们可以通过在每一帧更新文本对象来实现这一点。以下是一个例子:
import numpy as np
import matplotlib.pyplot as plt
from matplotlib.animation import FuncAnimation

# 创建初始数据
x = np.random.rand(100)
y = np.random.rand(100)

# 创建图形和散点
fig, ax = plt.subplots()
scatter = ax.scatter(x, y)

# 添加文本对象
stats_text = ax.text(0.02, 0.98, '', transform=ax.transAxes, va='top')

# 定义更新函数
def update(frame):
    global x, y

    # 更新数据
    x += np.random.normal(0, 0.01, 100)
    y += np.random.normal(0, 0.01, 100)
    x = np.clip(x, 0, 1)
    y = np.clip(y, 0, 1)

    scatter.set_offsets(np.c_[x, y])

    # 计算并更新统计信息
    mean_x, mean_y = np.mean(x), np.mean(y)
    std_x, std_y = np.std(x), np.std(y)
    stats_text.set_text(f'Mean: ({mean_x:.2f}, {mean_y:.2f})\nStd: ({std_x:.2f}, {std_y:.2f})')

    ax.set_title(f"Frame {frame} - how2matplotlib.com")

    return scatter, stats_text

# 创建动画
anim = FuncAnimation(fig, update, frames=200, interval=50, blit=True)

plt.show()
Output:
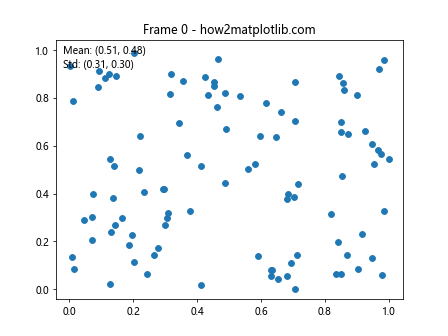
在这个例子中,我们在每一帧计算并显示了x和y坐标的均值和标准差。
13. 添加颜色映射
我们可以使用颜色映射来表示数据的额外维度。例如,我们可以用颜色来表示点的速度或其他属性。以下是一个例子:
import numpy as np
import matplotlib.pyplot as plt
from matplotlib.animation import FuncAnimation

# 创建初始数据
n = 100
x = np.random.rand(n)
y = np.random.rand(n)
v = np.zeros(n)  # 速度

# 创建图形和散点
fig, ax = plt.subplots()
scatter = ax.scatter(x, y, c=v, cmap='viridis', vmin=0, vmax=0.1)
plt.colorbar(scatter)

# 定义更新函数
def update(frame):
    global x, y, v

    # 更新数据
    dx = np.random.normal(0, 0.01, n)
    dy = np.random.normal(0, 0.01, n)
    x += dx
    y += dy
    x = np.clip(x, 0, 1)
    y = np.clip(y, 0, 1)

    # 计算速度
    v = np.sqrt(dx**2 + dy**2)

    scatter.set_offsets(np.c_[x, y])
    scatter.set_array(v)

    ax.set_title(f"Frame {frame} - how2matplotlib.com")

    return scatter,

# 创建动画
anim = FuncAnimation(fig, update, frames=200, interval=50, blit=True)

plt.show()
Output:
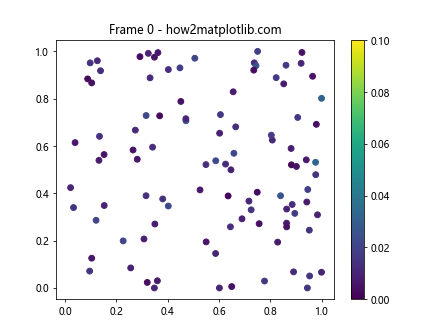
在这个例子中,我们使用颜色来表示每个点的速度。速度越快,颜色越亮。
14. 添加交互式控件
我们可以添加交互式控件来控制动画的某些方面。例如,我们可以添加一个滑块来控制点的数量。以下是一个例子:
import numpy as np
import matplotlib.pyplot as plt
from matplotlib.animation import FuncAnimation
from matplotlib.widgets import Slider

# 创建初始数据
n = 100
x = np.random.rand(n)
y = np.random.rand(n)

# 创建图形和散点
fig, ax = plt.subplots()
scatter = ax.scatter(x, y)

# 添加滑块
ax_slider = plt.axes([0.2, 0.02, 0.6, 0.03])
slider = Slider(ax_slider, 'Number of points', 10, 200, valinit=n, valstep=1)

# 定义更新函数
def update(frame):
    global x, y

    # 获取滑块值
    n = int(slider.val)

    # 更新数据
    x = np.random.rand(n)
    y = np.random.rand(n)

    scatter.set_offsets(np.c_[x, y])

    ax.set_title(f"Frame {frame} - how2matplotlib.com")

    return scatter,

# 创建动画
anim = FuncAnimation(fig, update, frames=200, interval=50, blit=True)

plt.show()
Output:
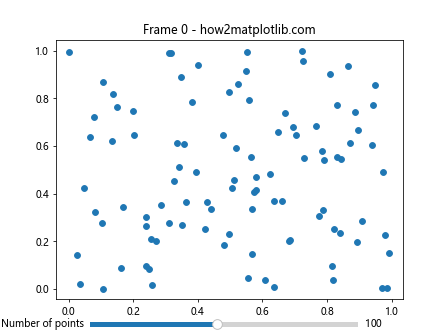
在这个例子中,我们添加了一个滑块来控制散点的数量。用户可以实时调整点的数量,动画会立即响应这些变化。
15. 添加多个子图
我们可以在一个动画中包含多个子图,每个子图显示不同的数据或视角。以下是一个例子:
import numpy as np
import matplotlib.pyplot as plt
from matplotlib.animation import FuncAnimation

# 创建初始数据
n = 100
x = np.random.rand(n)
y = np.random.rand(n)

# 创建图形和子图
fig, (ax1, ax2) = plt.subplots(1, 2, figsize=(12, 5))
scatter1 = ax1.scatter(x, y)
scatter2 = ax2.scatter(x, y, c=np.sqrt(x**2 + y**2), cmap='viridis')
plt.colorbar(scatter2, ax=ax2)

# 定义更新函数
def update(frame):
    global x, y

    # 更新数据
    x += np.random.normal(0, 0.01, n)
    y += np.random.normal(0, 0.01, n)
    x = np.clip(x, 0, 1)
    y = np.clip(y, 0, 1)

    scatter1.set_offsets(np.c_[x, y])
    scatter2.set_offsets(np.c_[x, y])
    scatter2.set_array(np.sqrt(x**2 + y**2))

    ax1.set_title(f"Position - Frame {frame}")
    ax2.set_title(f"Distance from origin - Frame {frame}")
    fig.suptitle(f"how2matplotlib.com - Frame {frame}")

    return scatter1, scatter2

# 创建动画
anim = FuncAnimation(fig, update, frames=200, interval=50, blit=True)

plt.show()
Output:
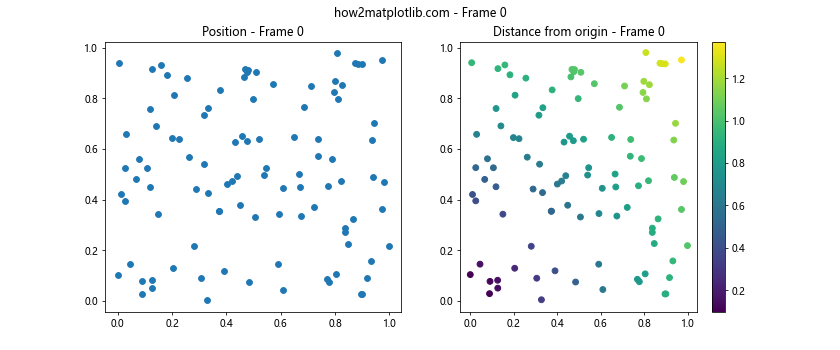
在这个例子中,我们创建了两个子图。左边的子图显示点的位置,右边的子图使用颜色来表示每个点到原点的距离。
结论
通过本文,我们深入探讨了如何使用Matplotlib创建动画散点图。我们从基础的动画创建开始,逐步引入了更复杂的概念,如自定义动画效果、添加颜色变化、显示数据轨迹、添加交互性等。我们还学习了如何保存动画、自定义点的样式、添加文本标签和数据统计信息等高级技巧。
动画散点图是一种强大的数据可视化工具,它可以帮助我们直观地理解数据的动态变化过程。通过合理使用颜色、大小、透明度等视觉元素,我们可以在一个图表中呈现多个维度的信息。而添加交互性则可以让用户更深入地探索数据。
在实际应用中,动画散点图可以用于多种场景,如展示粒子运动、人口迁移、股票价格变化、气象数据等。通过本文介绍的技巧,读者应该能够根据自己的需求创建出丰富多样的动画散点图。
最后,需要注意的是,虽然动画可以提供丰富的信息,但也要避免过度使用导致信息过载。在创建动画时,应该始终牢记可视化的目的,确保动画能够有效地传达关键信息,而不是仅仅为了视觉效果而牺牲了数据的可读性。
 极客笔记
极客笔记