Annotate plt
参考:annotate plt
在Matplotlib中,annotate()函数是一个非常有用的工具,可以用于在图形中添加注释。注释可以用于说明数据点、标记特定事件或提供其他相关信息。
基础用法
import matplotlib.pyplot as plt

x = [1, 2, 3, 4, 5]
y = [2, 3, 5, 7, 11]

plt.plot(x, y)
plt.annotate('Max', (5, 11), textcoords='offset points', xytext=(-15, 10), arrowprops=dict(facecolor='black', shrink=0.05))
plt.show()
Output:

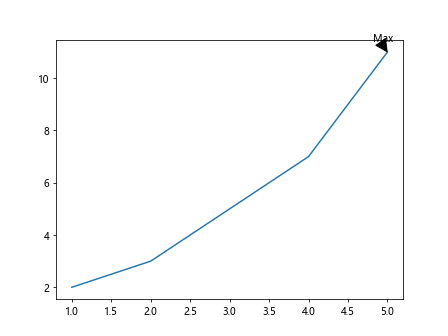
在这个示例中,我们使用annotate()函数在图形中添加了一个注释,注释的内容是”Max”,放在坐标点(5, 11)处,并且设置了箭头指向该点。
改变注释的样式
import matplotlib.pyplot as plt

plt.plot([1, 2, 3], [1, 4, 9])
plt.plot([1, 2, 3], [2, 5, 10])

plt.annotate('Intersection', xy=(2, 4), xytext=(3, 6),
             arrowprops=dict(facecolor='red', shrink=0.05))

plt.show()
Output:

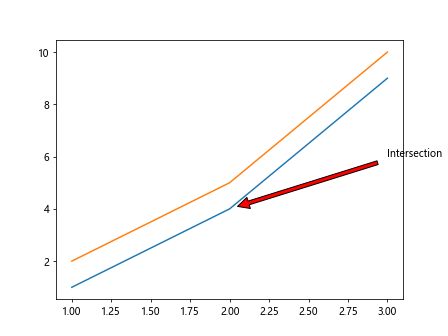
在这个示例中,我们通过设置arrowprops参数改变了注释的箭头样式,使得箭头的颜色变成了红色。
使用文本框标记数据点
import matplotlib.pyplot as plt

x = [1, 2, 3, 4, 5]
y = [2, 3, 5, 7, 11]

plt.plot(x, y, 'ro-')

for i, txt in enumerate(y):
    plt.annotate(txt, (x[i], y[i]), textcoords='offset points', xytext=(0,5), ha='center')

plt.show()
Output:

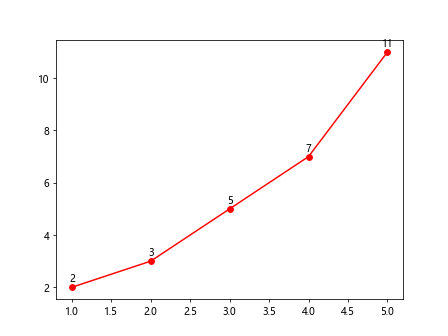
这个示例展示了如何使用文本框标记数据点,将每个数据点的y值显示在数据点上方。
在子图中使用annotate
import matplotlib.pyplot as plt

fig, axs = plt.subplots(2)

x1 = [1, 2, 3, 4, 5]
y1 = [2, 3, 5, 7, 11]

x2 = [1, 2, 3, 4, 5]
y2 = [3, 5, 7, 11, 13]

axs[0].plot(x1, y1)
axs[1].plot(x2, y2)

axs[0].annotate('Max', (5, 11), textcoords='offset points', xytext=(-15, 10), arrowprops=dict(facecolor='black', shrink=0.05))
axs[1].annotate('Min', (1, 3), textcoords='offset points', xytext=(15, 10), arrowprops=dict(facecolor='black', shrink=0.05))

plt.show()
Output:

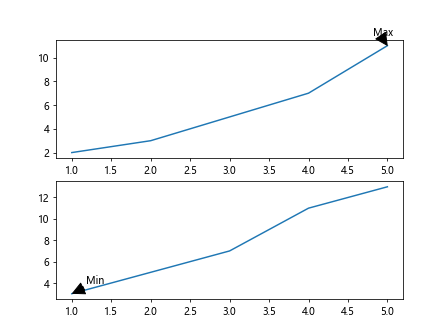
在这个示例中,我们创建了一个包含两个子图的图形,并在每个子图中使用annotate()函数添加了不同的注释。
结论
通过本文的介绍,我们了解了如何使用annotate()函数在Matplotlib中添加注释。这是一个非常有用的工具,可以帮助我们在图形中显示相关信息,提高图形的可读性和信息量。
 极客笔记
极客笔记