在Matplotlib中添加注释
Matplotlib是一个用于绘制图表的Python库,可以用于创建各种类型的图表,如折线图、散点图、柱状图等。在创建图表的过程中,我们经常需要添加注释来标注图中的重要信息,比如某个数据点的具体数值、某个特殊点的说明等。本文将介绍在Matplotlib中如何添加注释。
1. 基本注释
在Matplotlib中,我们可以使用annotate()方法来添加注释。这个方法接受两个参数,第一个参数是注释的内容,第二个参数是注释的位置。下面是一个简单的示例代码:
import matplotlib.pyplot as plt

x = [1, 2, 3, 4, 5]
y = [2, 3, 5, 7, 11]

plt.plot(x, y)
plt.annotate('how2matplotlib.com', (3, 5), color='red')
plt.show()
Output:
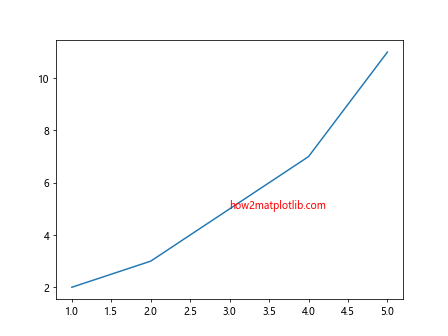
在这个示例中,我们在图中添加了一个红色的注释,内容为”how2matplotlib.com”,位置为(3, 5)处。
2. 自定义注释样式
除了基本的注释外,我们还可以自定义注释的样式,比如字体、颜色、背景色等。下面是一个示例代码:
import matplotlib.pyplot as plt

x = [1, 2, 3, 4, 5]
y = [2, 3, 5, 7, 11]

plt.plot(x, y)
plt.annotate('how2matplotlib.com', (3, 5), color='blue', fontsize=12, backgroundcolor='yellow')
plt.show()
Output:
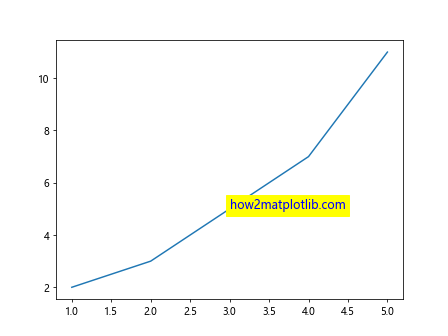
在这个示例中,我们添加了一个蓝色的注释,字体大小为12,背景色为黄色。
3. 添加箭头
有时候我们希望注释中有一个箭头指向特定位置,可以使用arrowprops参数来实现。下面是一个示例代码:
import matplotlib.pyplot as plt

x = [1, 2, 3, 4, 5]
y = [2, 3, 5, 7, 11]

plt.plot(x, y)
plt.annotate('how2matplotlib.com', xy=(3, 5), xytext=(1, 8),
             arrowprops=dict(facecolor='green', arrowstyle='->'))
plt.show()
Output:
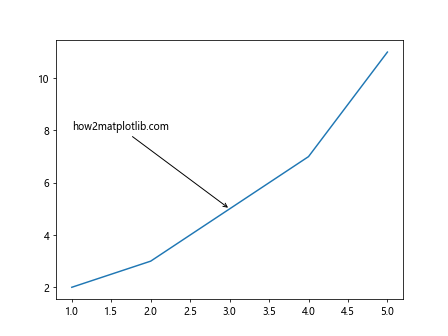
在这个示例中,我们添加了一个箭头指向(3, 5),箭头样式为绿色的箭头。
4. 注释在图中的相对位置
有时候我们需要将注释放置在图中的相对位置,比如图的左上角或右下角。我们可以使用坐标系的axis属性来指定注释的相对位置。下面是一个示例代码:
import matplotlib.pyplot as plt

x = [1, 2, 3, 4, 5]
y = [2, 3, 5, 7, 11]

plt.plot(x, y)
plt.annotate('how2matplotlib.com', xy=(3, 5), xycoords='data', xytext=(0.5, 0.5),
             textcoords='axes fraction', arrowprops=dict(facecolor='red', arrowstyle='->'))
plt.show()
Output:
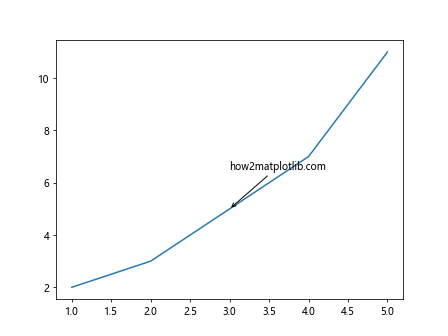
在这个示例中,我们将注释放置在图的中心位置,箭头样式为红色箭头。
5. 注释中使用LaTeX公式
Matplotlib支持使用LaTeX格式的文本,在注释中添加公式。下面是一个示例代码:
import matplotlib.pyplot as plt

x = [1, 2, 3, 4, 5]
y = [2, 3, 5, 7, 11]

plt.plot(x, y)
plt.annotate(r'\sum_{i=1}^{5} x_i', xy=(3, 5), xytext=(1, 8),
             arrowprops=dict(facecolor='blue', arrowstyle='->'))
plt.show()
Output:
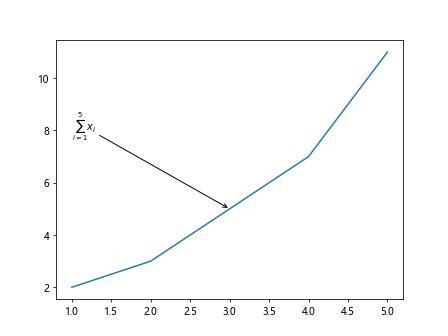
在这个示例中,我们在注释中添加了一个LaTeX公式\sum_{i=1}^{5} x_i。
6. 多行注释
有时候我们需要在注释中添加多行文本,可以使用\n来换行。下面是一个示例代码:
import matplotlib.pyplot as plt

x = [1, 2, 3, 4, 5]
y = [2, 3, 5, 7, 11]

plt.plot(x, y)
plt.annotate('how2matplotlib.com\nMultiple Lines', xy=(3, 5), xytext=(1, 8),
             arrowprops=dict(facecolor='purple', arrowstyle='->'))
plt.show()
Output:
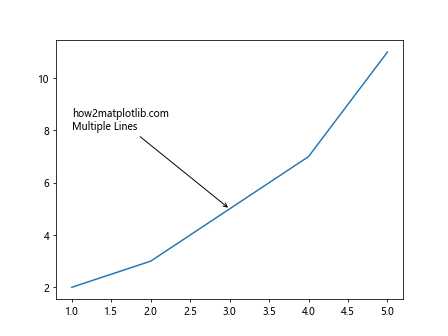
在这个示例中,我们在注释中添加了多行文本”how2matplotlib.com”和”Multiple Lines”。
7. 注释的旋转角度
有时候我们希望调整注释的旋转角度,可以使用rotation参数来实现。下面是一个示例代码:
import matplotlib.pyplot as plt

x = [1, 2, 3, 4, 5]
y = [2, 3, 5, 7, 11]

plt.plot(x, y)
plt.annotate('how2matplotlib.com', xy=(3, 5), xytext=(1, 8),
             arrowprops=dict(facecolor='orange', arrowstyle='->'), rotation=45)
plt.show()
Output:
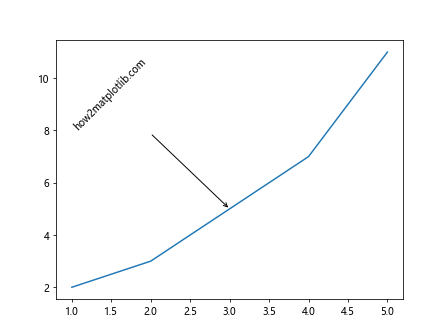
在这个示例中,我们将注释旋转了45度。
8. 注释的透明度
有时候我们希望调整注释的透明度,可以使用alpha参数来实现。下面是一个示例代码:
import matplotlib.pyplot as plt

x = [1, 2, 3, 4, 5]
y = [2, 3, 5, 7, 11]

plt.plot(x, y)
plt.annotate('how2matplotlib.com', xy=(3, 5), xytext=(1, 8),
             arrowprops=dict(facecolor='pink', arrowstyle='->'), alpha=0.5)
plt.show()
Output:
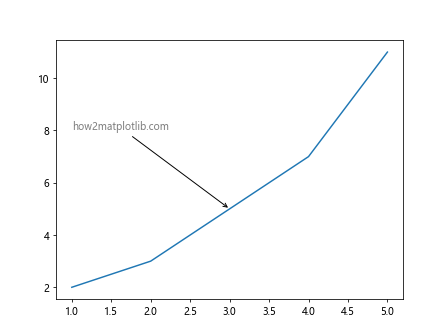
在这个示例中,我们将注释的透明度调整为0.5。
9. 设置注释的对齐方式
有时候我们希望调整注释的对齐方式,可以使用ha和va参数来实现。下面是一个示例代码:
import matplotlib.pyplot as plt

x = [1, 2, 3, 4, 5]
y = [2, 3, 5, 7, 11]

plt.plot(x, y)
plt.annotate('how2matplotlib.com', xy=(3, 5), xytext=(1, 8),
             arrowprops=dict(facecolor='gray', arrowstyle='->'), ha='right', va='top')
plt.show()
Output:
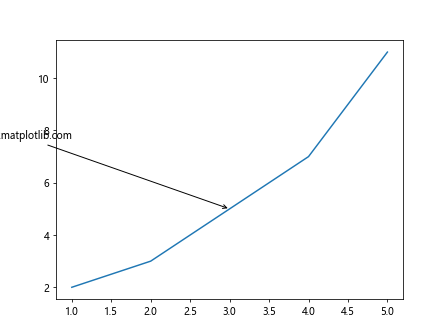
在这个示例中,我们将注释调整为右上角对齐。
10. 移动注释的位置
有时候我们需要调整注释的位置,可以使用offset参数来实现。下面是一个示例代码:
import matplotlib.pyplot as plt

x = [1, 2, 3, 4, 5]
y = [2, 3, 5, 7, 11]

plt.plot(x, y)
plt.annotate('how2matplotlib.com', xy=(3, 5), xytext=(1, 8),
             arrowprops=dict(facecolor='brown', arrowstyle='->'), offset=(10, 10))
plt.show()
在这个示例中,我们将注释的位置向右上角偏移了10个单位。
11. 注释的字体样式
有时候我们希望调整注释的字体样式,比如加粗、斜体等,可以使用fontstyle和fontweight参数来实现。下面是一个示例代码:
import matplotlib.pyplot as plt

x = [1, 2, 3, 4, 5]
y = [2, 3, 5, 7, 11]

plt.plot(x, y)
plt.annotate('how2matplotlib.com', xy=(3, 5), xytext=(1, 8),
             arrowprops=dict(facecolor='purple', arrowstyle='->'), fontstyle='italic', fontweight='bold')
plt.show()
Output:
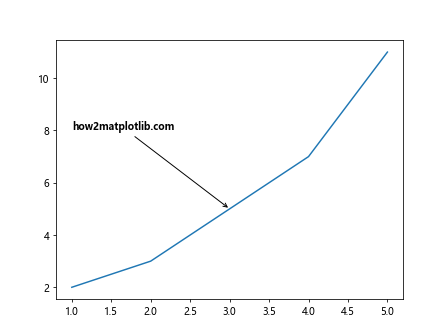
在这个示例中,我们将注释设置为斜体和加粗。
12. 使用bbox设置注释框样式
有时候我们希望为注释添加一个框来突出显示,可以使用bbox参数来实现。下面是一个示例代码:
import matplotlib.pyplot as plt

x = [1, 2, 3, 4, 5]
y = [2, 3, 5, 7, 11]

plt.plot(x, y)
plt.annotate('how2matplotlib.com', xy=(3, 5), xytext=(1, 8),
             arrowprops=dict(facecolor='blue', arrowstyle='->'), bbox=dict(facecolor='yellow', alpha=0.5))
plt.show()
Output:
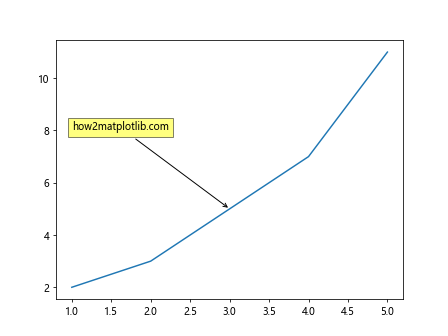
在这个示例中,我们为注释添加了一个黄色的半透明框。
13. 注释的连接线样式
有时候我们希望调整注释的连接线样式,可以使用bbox参数来实现。下面是一个示例代码:
import matplotlib.pyplot as plt

x = [1, 2, 3, 4, 5]
y = [2, 3, 5, 7, 11]

plt.plot(x, y)
plt.annotate('how2matplotlib.com', xy=(3, 5), xytext=(1, 8),
             arrowprops=dict(facecolor='green', arrowstyle='-', linestyle='dashed'))
plt.show()
Output:
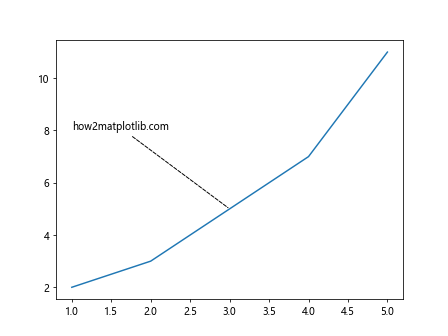
在这个示例中,我们将连接线样式设置为虚线。
14. 取消注释箭头
有时候我们希望取消注释中的箭头,可以将arrowprops参数设为None。下面是一个示例代码:
import matplotlib.pyplot as plt

x = [1, 2, 3, 4, 5]
y = [2, 3, 5, 7, 11]

plt.plot(x, y)
plt.annotate('how2matplotlib.com', xy=(3, 5), xytext=(1, 8), arrowprops=None)
plt.show()
Output:
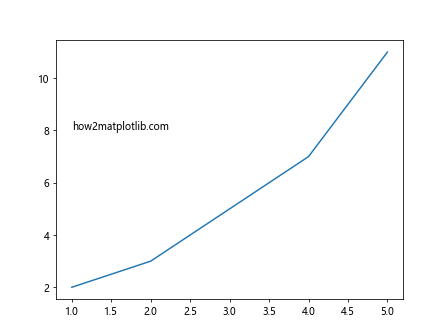
在这个示例中,我们取消了注释中的箭头。
15. 注释在不同坐标系中的位置
有时候我们需要在不同坐标系中指定注释的位置,可以使用annotation.get_transform()来实现。下面是一个示例代码:
import matplotlib.pyplot as plt
import matplotlib.transforms as mtransforms

x = [1, 2, 3, 4, 5]
y = [2, 3, 5, 7, 11]

fig, ax = plt.subplots()
ax.plot(x, y)

trans = mtransforms.blended_transform_factory(ax.transData, ax.transAxes)
ann = ax.annotate('how2matplotlib.com', xy=(3, 0.5), xycoords=trans)
plt.show()
Output:
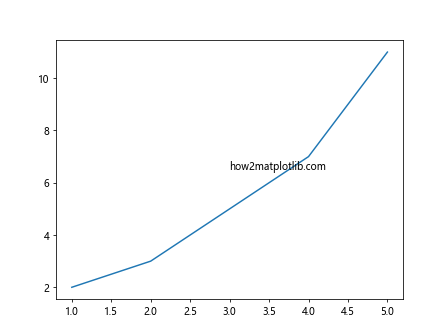
在这个示例中,我们将注释放置在图的中心下方。
以上是如何在Matplotlib中添加注释的详细介绍。通过对不同参数的调整和设置,可以实现各种样式的注释效果。
 极客笔记
极客笔记