使用Python的matplotlib库对齐表格与X轴
参考: Aligning table to X-axis using matplotlib Python
在数据可视化的过程中,将表格与X轴对齐可以使图表信息更加清晰、易于理解。本文将详细介绍如何使用Python的matplotlib库来实现表格与X轴的对齐。我们将通过一系列的示例代码来展示不同的对齐方式和技巧,帮助读者更好地掌握这一技能。
1. 基本概念
在matplotlib中,表格是通过table函数来创建的,而图表的X轴则是通过各种图形(如柱状图、折线图等)来展示数据。对齐表格与X轴意味着要调整表格的位置,使其在水平方向上与X轴保持一致,或者与特定的图形元素对齐。
2. 环境准备
在开始编写代码之前,确保你的Python环境中已经安装了matplotlib库。如果未安装,可以通过以下命令进行安装:
pip install matplotlib
3. 示例代码
接下来,我们将通过多个示例来展示如何使用matplotlib对表格与X轴进行对齐。
示例1:创建基本表格
import matplotlib.pyplot as plt

data = {
    "Column 1": [1, 2, 3],
    "Column 2": [4, 5, 6]
}

fig, ax = plt.subplots()
ax.table(cellText=data.values(), colLabels=data.keys(), loc='bottom')
ax.set_title("Example 1 - Basic Table from how2matplotlib.com")
plt.show()
示例2:调整表格位置
import matplotlib.pyplot as plt

data = {
    "Column 1": [1, 2, 3],
    "Column 2": [4, 5, 6]
}

fig, ax = plt.subplots()
table = ax.table(cellText=data.values(), colLabels=data.keys(), loc='bottom')
table.scale(1, 1.5)  # 调整表格大小
ax.set_title("Example 2 - Adjusted Table Position from how2matplotlib.com")
plt.show()
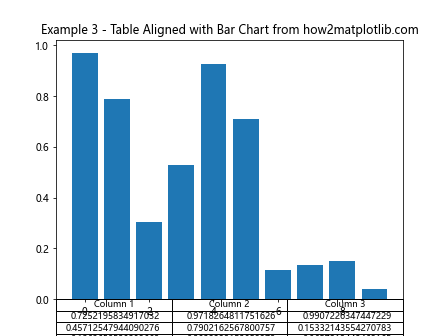
示例3:表格与柱状图对齐
import matplotlib.pyplot as plt
import numpy as np

data = np.random.rand(10, 3)
columns = ('Column 1', 'Column 2', 'Column 3')

fig, ax = plt.subplots()
ax.bar(range(len(data)), [val[1] for val in data], align='center')
table = ax.table(cellText=data, colLabels=columns, loc='bottom')
ax.set_title("Example 3 - Table Aligned with Bar Chart from how2matplotlib.com")
plt.show()
Output:

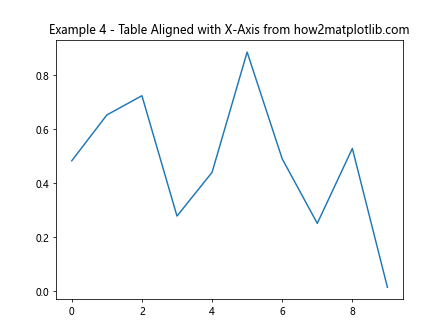
示例4:调整表格与X轴的对齐方式
import matplotlib.pyplot as plt
import numpy as np

data = np.random.rand(10, 3)
columns = ('Column 1', 'Column 2', 'Column 3')

fig, ax = plt.subplots()
ax.plot(range(len(data)), [val[1] for val in data])
table = ax.table(cellText=data, colLabels=columns, loc='bottom', bbox=[0, -0.5, 1, 0.3])
ax.set_title("Example 4 - Table Aligned with X-Axis from how2matplotlib.com")
plt.show()
Output:

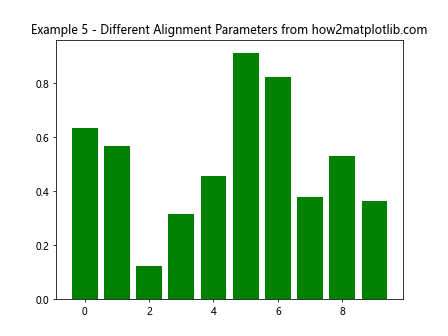
示例5:使用不同的对齐参数
import matplotlib.pyplot as plt
import numpy as np

data = np.random.rand(10, 3)
columns = ('Column 1', 'Column 2', 'Column 3')

fig, ax = plt.subplots()
ax.bar(range(len(data)), [val[2] for val in data], color='green')
table = ax.table(cellText=data, colLabels=columns, loc='bottom', bbox=[0, -0.6, 1, 0.4])
ax.set_title("Example 5 - Different Alignment Parameters from how2matplotlib.com")
plt.show()
Output:

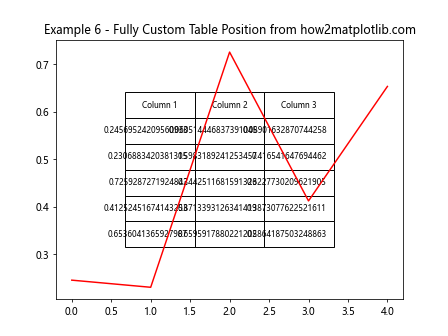
示例6:完全自定义表格位置
import matplotlib.pyplot as plt
import numpy as np

data = np.random.rand(5, 3)
columns = ('Column 1', 'Column 2', 'Column 3')

fig, ax = plt.subplots()
ax.plot(range(len(data)), [val[0] for val in data], 'r-')
table = ax.table(cellText=data, colLabels=columns, loc='center', bbox=[0.2, 0.2, 0.6, 0.6])
ax.set_title("Example 6 - Fully Custom Table Position from how2matplotlib.com")
plt.show()
Output:

4. 结论
通过上述示例,我们可以看到matplotlib提供了灵活的方式来对齐表格与X轴。通过调整loc和bbox参数,我们可以控制表格的位置和大小,从而达到与X轴或图形元素的完美对齐。希望这些示例能帮助你在实际工作中更好地使用matplotlib进行数据可视化。
 极客笔记
极客笔记