调整Matplotlib中绘图区域与X轴之间的间距
参考: Adjusting the spacing between the edge of the plot and the X-axis in Matplotlib
在使用Matplotlib进行数据可视化时,经常需要调整图表的布局以便更好地展示数据。其中一个常见的需求是调整绘图区域与X轴之间的间距。这可以帮助避免X轴标签与图表边缘的重叠,使图表看起来更加清晰和专业。本文将详细介绍如何在Matplotlib中调整这些间距,并提供多个示例代码以供参考。
示例1:使用subplots_adjust调整间距
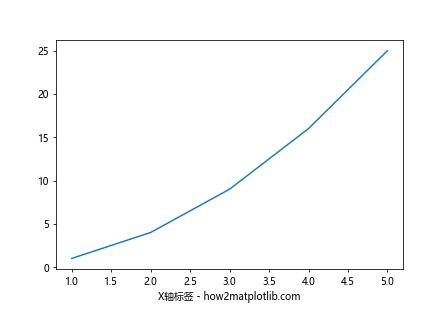
Matplotlib的figure对象提供了一个subplots_adjust方法,可以用来调整子图周围的间距。下面的代码展示了如何使用这个方法来调整底部的间距。
import matplotlib.pyplot as plt

# 创建图形和轴对象
fig, ax = plt.subplots()
ax.plot([1, 2, 3, 4, 5], [1, 4, 9, 16, 25])

# 调整底部间距
fig.subplots_adjust(bottom=0.2)

# 设置X轴标签
ax.set_xlabel("X轴标签 - how2matplotlib.com")

plt.show()
Output:
示例2:使用tight_layout自动调整布局
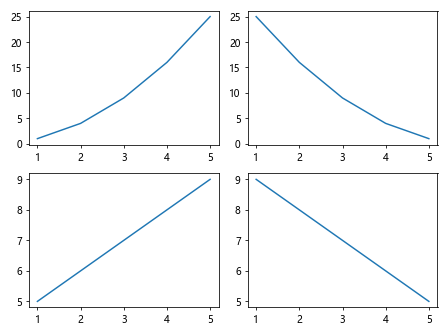
当你不确定如何设置间距时,tight_layout方法可以自动调整子图参数,使之填充整个图形区域,并减少子图之间的重叠。这是一个非常有用的功能,特别是在处理多个子图时。
import matplotlib.pyplot as plt

# 创建图形和多个轴对象
fig, axs = plt.subplots(2, 2)
axs[0, 0].plot([1, 2, 3, 4, 5], [1, 4, 9, 16, 25])
axs[0, 1].plot([1, 2, 3, 4, 5], [25, 16, 9, 4, 1])
axs[1, 0].plot([1, 2, 3, 4, 5], [5, 6, 7, 8, 9])
axs[1, 1].plot([1, 2, 3, 4, 5], [9, 8, 7, 6, 5])

# 自动调整布局
plt.tight_layout()

plt.show()
Output:
示例3:使用set_xlim和set_ylim精确控制边界
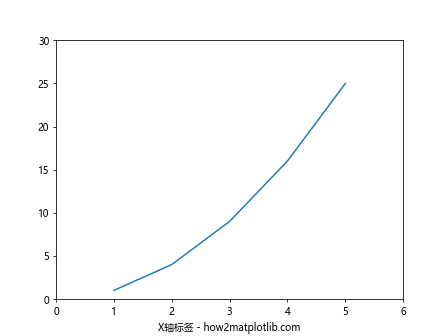
有时候,你可能需要更精确地控制图表的边界,这时可以使用set_xlim和set_ylim方法。这两个方法允许你设置X轴和Y轴的起始和结束位置,从而间接调整与边缘的间距。
import matplotlib.pyplot as plt

# 创建图形和轴对象
fig, ax = plt.subplots()
ax.plot([1, 2, 3, 4, 5], [1, 4, 9, 16, 25])

# 设置X轴和Y轴的显示范围
ax.set_xlim(0, 6)
ax.set_ylim(0, 30)

# 设置X轴标签
ax.set_xlabel("X轴标签 - how2matplotlib.com")

plt.show()
Output:
示例4:使用Figure的set_size_inches调整图形尺寸
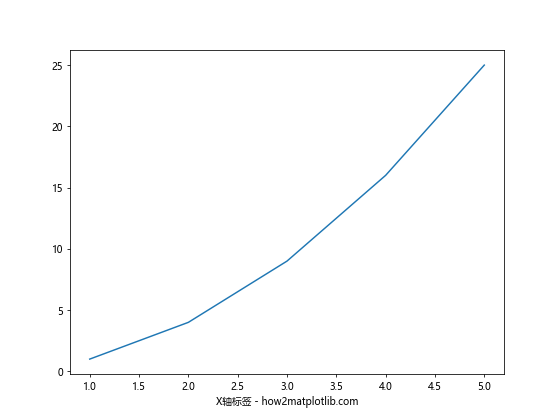
调整图形的整体尺寸也可以影响到绘图区域与X轴之间的相对间距。使用set_size_inches方法可以设置图形的宽度和高度。
import matplotlib.pyplot as plt

# 创建图形对象
fig = plt.figure()
ax = fig.add_subplot(111)
ax.plot([1, 2, 3, 4, 5], [1, 4, 9, 16, 25])

# 设置图形的尺寸
fig.set_size_inches(8, 6)

# 设置X轴标签
ax.set_xlabel("X轴标签 - how2matplotlib.com")

plt.show()
Output:
示例5:使用GridSpec进行高级子图布局
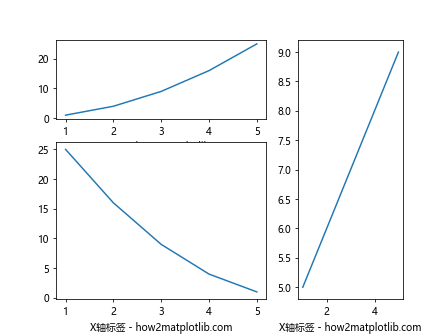
GridSpec是一个更高级的布局工具,允许更精细的控制子图的位置和大小。通过指定行和列的比例,你可以非常灵活地调整各个子图的布局。
import matplotlib.pyplot as plt
from matplotlib.gridspec import GridSpec

# 创建图形对象
fig = plt.figure()

# 设置GridSpec布局
gs = GridSpec(2, 2, height_ratios=[1, 2], width_ratios=[2, 1])

ax1 = fig.add_subplot(gs[0, 0])
ax2 = fig.add_subplot(gs[1, 0])
ax3 = fig.add_subplot(gs[:, 1])

ax1.plot([1, 2, 3, 4, 5], [1, 4, 9, 16, 25])
ax2.plot([1, 2, 3, 4, 5], [25, 16, 9, 4, 1])
ax3.plot([1, 2, 3, 4, 5], [5, 6, 7, 8, 9])

# 设置X轴标签
ax1.set_xlabel("X轴标签 - how2matplotlib.com")
ax2.set_xlabel("X轴标签 - how2matplotlib.com")
ax3.set_xlabel("X轴标签 - how2matplotlib.com")

plt.show()
Output:
以上示例展示了如何在Matplotlib中调整绘图区域与X轴之间的间距。通过这些方法,你可以根据自己的需求调整图表的布局,使其更加美观和易于理解。
 极客笔记
极客笔记