在Python中调整Matplotlib子图的高度
参考: Adjusting the heights of individual subplots in Matplotlib in Python
在数据可视化过程中,使用Matplotlib库创建图表是Python中一个常见的做法。Matplotlib提供了强大的工具来绘制和定制图形,包括调整子图的大小和布局。本文将详细介绍如何在Python的Matplotlib库中调整各个子图的高度,以便更好地展示数据视觉效果。
1. 简介
Matplotlib是一个用于在Python中创建静态、动画和交互式可视化的库。它非常灵活,允许用户通过简单的命令控制图形的每个元素。在多图布局中,调整子图的高度是常见的需求,尤其是当各个子图的数据展示需要不同的空间时。
2. 基本概念
在深入代码实例之前,我们首先需要了解一些基本概念:
- Figure:整个图形的容器,可以看作是一个画布,在这个画布上可以绘制一个或多个子图。
- Axes:图形的一部分,通常与数据图表相关联,一个Figure可以包含多个Axes。
- Subplot:子图,即位于Figure中的单个图表。
3. 调整子图高度的方法
调整子图高度主要有以下几种方法:
- 使用
subplots_adjust方法调整子图间距。 - 使用
GridSpec更精细地控制子图布局。 - 利用
subplot2grid函数进行布局。 - 使用
add_axes直接在Figure上定义Axes的位置和大小。
下面将通过具体的代码示例详细介绍每种方法。
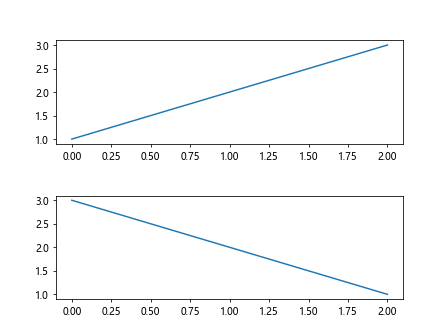
3.1 使用subplots_adjust方法
subplots_adjust方法允许用户调整子图之间的间距和边缘间距。
import matplotlib.pyplot as plt

# 创建一个Figure和两个子图
fig, (ax1, ax2) = plt.subplots(2, 1)
ax1.plot([1, 2, 3], label="how2matplotlib.com")
ax2.plot([3, 2, 1], label="how2matplotlib.com")

# 调整子图间的垂直间距
fig.subplots_adjust(hspace=0.5)

plt.show()
Output:

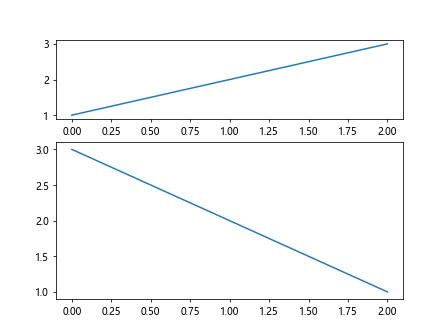
3.2 使用GridSpec控制布局
GridSpec是一个更灵活的布局方式,可以精确控制每个子图的位置和大小。
import matplotlib.pyplot as plt
import matplotlib.gridspec as gridspec

# 创建Figure
fig = plt.figure()

# 定义GridSpec
gs = gridspec.GridSpec(2, 1, height_ratios=[1, 2])

# 创建两个子图
ax1 = fig.add_subplot(gs[0])
ax2 = fig.add_subplot(gs[1])

ax1.plot([1, 2, 3], label="how2matplotlib.com")
ax2.plot([3, 2, 1], label="how2matplotlib.com")

plt.show()
Output:

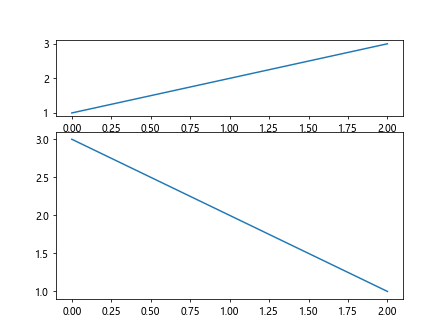
3.3 使用subplot2grid进行布局
subplot2grid是一个简化版的GridSpec,用于创建网格布局中的子图。
import matplotlib.pyplot as plt
import matplotlib.gridspec as gridspec

# 创建两个子图,第二个子图高度是第一个的两倍
ax1 = plt.subplot2grid((3, 1), (0, 0))
ax2 = plt.subplot2grid((3, 1), (1, 0), rowspan=2)

ax1.plot([1, 2, 3], label="how2matplotlib.com")
ax2.plot([3, 2, 1], label="how2matplotlib.com")

plt.show()
Output:

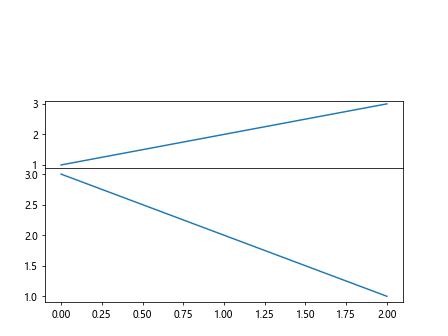
3.4 使用add_axes定义Axes
add_axes允许直接在Figure上定义Axes的位置和大小,这是一种非常灵活的方法。
import matplotlib.pyplot as plt
import matplotlib.gridspec as gridspec

# 创建Figure
fig = plt.figure()

# 添加两个Axes,第二个Axes的高度是第一个的两倍
ax1 = fig.add_axes([0.1, 0.5, 0.8, 0.2])
ax2 = fig.add_axes([0.1, 0.1, 0.8, 0.4])

ax1.plot([1, 2, 3], label="how2matplotlib.com")
ax2.plot([3, 2, 1], label="how2matplotlib.com")

plt.show()
Output:

4. 结论
调整子图的高度是在使用Matplotlib进行复杂布局时的一个重要技巧。通过上述方法,我们可以灵活地控制每个子图的尺寸和位置,以达到最佳的视觉效果。这些技巧在处理具有不同数据表示需求的多图布局时尤其有用。
 极客笔记
极客笔记