在Matplotlib柱状图上添加数值标签
参考: Adding value labels on a matplotlib bar chart
在数据可视化的过程中,柱状图是一种常见的图表类型,用于展示不同类别间的比较。在柱状图上添加数值标签可以使得图表的信息传递更为直观和明确。本文将详细介绍如何在使用Python的Matplotlib库生成的柱状图上添加数值标签。
1. 简介
Matplotlib是一个广泛使用的Python绘图库,它提供了大量的工具来帮助开发者生成高质量的图形。在柱状图中添加数值标签是一个常见需求,这有助于观众直接从图表上读取具体数值,而不仅仅是通过比较柱子的高度来估计值的大小。
2. 基本柱状图的创建
首先,我们需要安装Matplotlib库。如果你还没有安装,可以通过以下命令进行安装:
pip install matplotlib
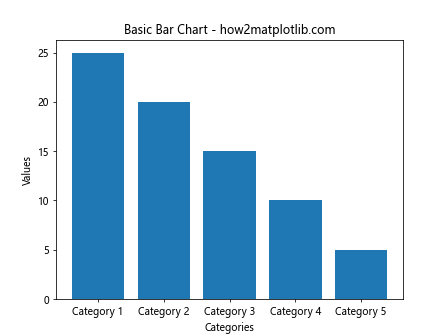
接下来,我们将创建一个基本的柱状图。以下是一个简单的示例代码:
import matplotlib.pyplot as plt

data = [25, 20, 15, 10, 5]
categories = ['Category 1', 'Category 2', 'Category 3', 'Category 4', 'Category 5']

plt.bar(categories, data)
plt.title("Basic Bar Chart - how2matplotlib.com")
plt.xlabel("Categories")
plt.ylabel("Values")
plt.show()
Output:
3. 在柱状图上添加数值标签
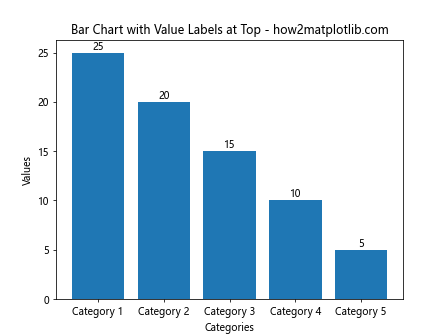
添加数值标签的基本思路是在每个柱子的顶部或内部显示数值。这可以通过遍历每个柱子并在适当的位置添加文本来实现。
示例1: 在柱顶添加标签
import matplotlib.pyplot as plt

data = [25, 20, 15, 10, 5]
categories = ['Category 1', 'Category 2', 'Category 3', 'Category 4', 'Category 5']

fig, ax = plt.subplots()
bars = ax.bar(categories, data)

for bar in bars:
    yval = bar.get_height()
    ax.text(bar.get_x() + bar.get_width()/2, yval, yval, ha='center', va='bottom')

plt.title("Bar Chart with Value Labels at Top - how2matplotlib.com")
plt.xlabel("Categories")
plt.ylabel("Values")
plt.show()
Output:
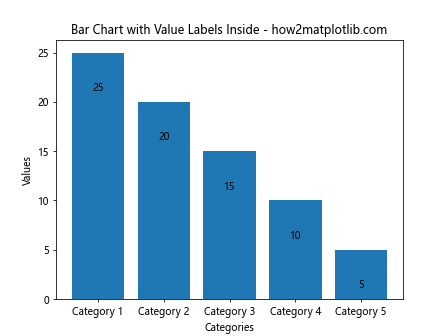
示例2: 在柱内添加标签
import matplotlib.pyplot as plt

data = [25, 20, 15, 10, 5]
categories = ['Category 1', 'Category 2', 'Category 3', 'Category 4', 'Category 5']

fig, ax = plt.subplots()
bars = ax.bar(categories, data)

for bar in bars:
    yval = bar.get_height()
    ax.text(bar.get_x() + bar.get_width()/2, yval - 3, yval, ha='center', va='top')

plt.title("Bar Chart with Value Labels Inside - how2matplotlib.com")
plt.xlabel("Categories")
plt.ylabel("Values")
plt.show()
Output:
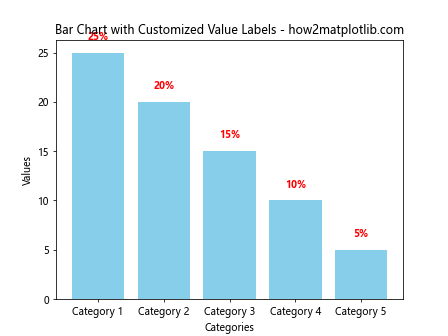
示例3: 自定义标签样式
import matplotlib.pyplot as plt

data = [25, 20, 15, 10, 5]
categories = ['Category 1', 'Category 2', 'Category 3', 'Category 4', 'Category 5']

fig, ax = plt.subplots()
bars = ax.bar(categories, data, color='skyblue')

for bar in bars:
    yval = bar.get_height()
    ax.text(bar.get_x() + bar.get_width()/2, yval + 1, f'{yval}%', ha='center', va='bottom', color='red', fontweight='bold')

plt.title("Bar Chart with Customized Value Labels - how2matplotlib.com")
plt.xlabel("Categories")
plt.ylabel("Values")
plt.show()
Output:
4. 处理大数据集
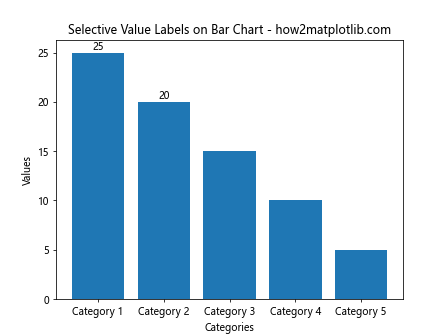
当处理包含大量数据点的数据集时,添加数值标标签可能会导致图表看起来拥挤不堪。在这种情况下,我们可能需要采取一些策略来优化标签的显示。
示例4: 只为最高的几个柱子添加标签
import matplotlib.pyplot as plt

data = [25, 20, 15, 10, 5]
categories = ['Category 1', 'Category 2', 'Category 3', 'Category 4', 'Category 5']
highlight = [True, True, False, False, False]

fig, ax = plt.subplots()
bars = ax.bar(categories, data)

for bar, highlight in zip(bars, highlight):
    if highlight:
        yval = bar.get_height()
        ax.text(bar.get_x() + bar.get_width()/2, yval, yval, ha='center', va='bottom')

plt.title("Selective Value Labels on Bar Chart - how2matplotlib.com")
plt.xlabel("Categories")
plt.ylabel("Values")
plt.show()
Output:
示例5: 调整标签位置以避免重叠
import matplotlib.pyplot as plt

data = [25, 20, 15, 10, 5]
categories = ['Category 1', 'Category 2', 'Category 3', 'Category 4', 'Category 5']

fig, ax = plt.subplots()
bars = ax.bar(categories, data)

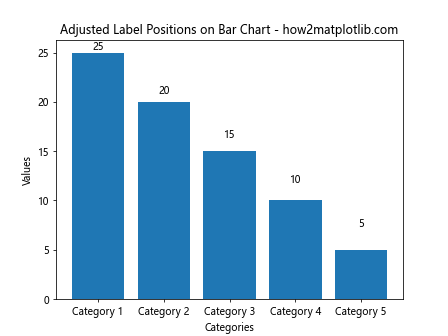
for i, bar in enumerate(bars):
    yval = bar.get_height()
    ax.text(bar.get_x() + bar.get_width()/2, yval + i*0.5, yval, ha='center', va='bottom')

plt.title("Adjusted Label Positions on Bar Chart - how2matplotlib.com")
plt.xlabel("Categories")
plt.ylabel("Values")
plt.show()
Output:
5. 结论
在Matplotlib中为柱状图添加数值标签是一个简单而有效的方法,可以提高图表的信息传递效率和视觉吸引力。通过调整标签的位置、样式以及选择性地显示标签,可以进一步提升图表的可读性和美观度。
 极客笔记
极客笔记