在Matplotlib中添加图形纹理
参考: Adding textures to graphs using Matplotlib
在数据可视化中,使用纹理可以帮助区分图表中的不同部分,尤其是在打印黑白文档时。Matplotlib是一个强大的Python绘图库,它支持在图表中添加纹理。本文将详细介绍如何在Matplotlib中使用纹理来增强图表的视觉效果。
1. 纹理的基本概念
在Matplotlib中,纹理通常通过设置图形的填充模式来实现,这些模式可以是线条、点或其他图案。纹理的使用不仅可以使图表更加美观,还可以帮助区分图中的不同数据系列。
2. 设置环境
在开始绘图之前,我们需要安装并导入Matplotlib库。如果你还没有安装Matplotlib,可以通过以下命令进行安装:
pip install matplotlib
导入Matplotlib库:
import matplotlib.pyplot as plt
import numpy as np
3. 纹理的应用示例
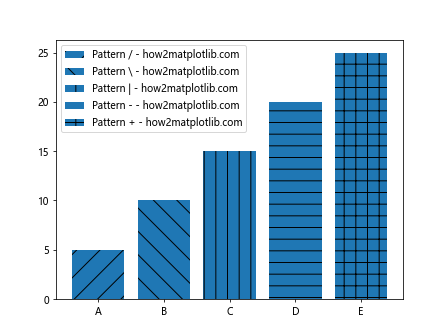
示例1:使用基本线条纹理填充条形图
# 示例代码1
import matplotlib.pyplot as plt
import numpy as np

data = [5, 10, 15, 20, 25]
labels = ['A', 'B', 'C', 'D', 'E']
patterns = ['/', '\\', '|', '-', '+']

fig, ax = plt.subplots()
bars = ax.bar(labels, data)

for bar, pattern in zip(bars, patterns):
    bar.set_hatch(pattern)
    bar.set_label(f'Pattern {pattern} - how2matplotlib.com')

ax.legend()
plt.show()
Output:
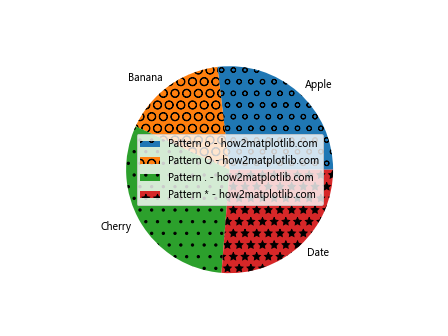
示例2:使用点状纹理填充饼图
# 示例代码2
import matplotlib.pyplot as plt

sizes = [215, 130, 245, 210]
labels = ['Apple', 'Banana', 'Cherry', 'Date']
patterns = ['o', 'O', '.', '*']

fig, ax = plt.subplots()
wedges, texts = ax.pie(sizes, labels=labels)

for wedge, pattern in zip(wedges, patterns):
    wedge.set_hatch(pattern)
    wedge.set_label(f'Pattern {pattern} - how2matplotlib.com')

ax.legend()
plt.show()
Output:
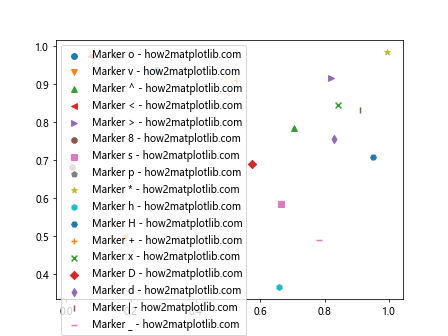
示例3:在散点图中应用纹理
# 示例代码3
import matplotlib.pyplot as plt
import numpy as np

x = np.random.rand(50)
y = np.random.rand(50)
patterns = ['o', 'v', '^', '<', '>', '8', 's', 'p', '*', 'h', 'H', '+', 'x', 'D', 'd', '|', '_']

fig, ax = plt.subplots()
for i in range(len(patterns)):
    ax.scatter(x[i], y[i], marker=patterns[i], label=f'Marker {patterns[i]} - how2matplotlib.com')

ax.legend()
plt.show()
Output:
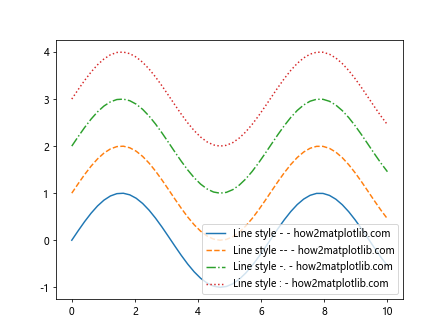
示例4:在折线图中使用纹理
# 示例代码4
import matplotlib.pyplot as plt
import numpy as np

x = np.linspace(0, 10, 50)
y = np.sin(x)
patterns = ['-', '--', '-.', ':']

fig, ax = plt.subplots()
for i, pattern in enumerate(patterns):
    ax.plot(x, y + i, linestyle=pattern, label=f'Line style {pattern} - how2matplotlib.com')

ax.legend()
plt.show()
Output:
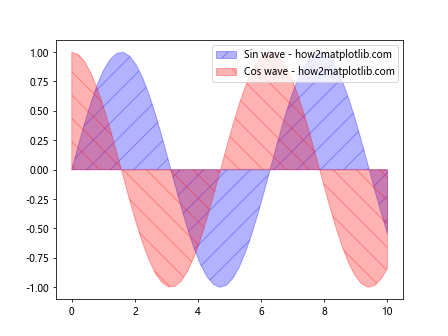
示例5:使用自定义纹理在填充区域图中
# 示例代码5
import matplotlib.pyplot as plt
import numpy as np

x = np.linspace(0, 10, 50)
y1 = np.sin(x)
y2 = np.cos(x)

fig, ax = plt.subplots()
ax.fill_between(x, y1, color='blue', alpha=0.3, hatch='/', label='Sin wave - how2matplotlib.com')
ax.fill_between(x, y2, color='red', alpha=0.3, hatch='\\', label='Cos wave - how2matplotlib.com')

ax.legend()
plt.show()
Output:
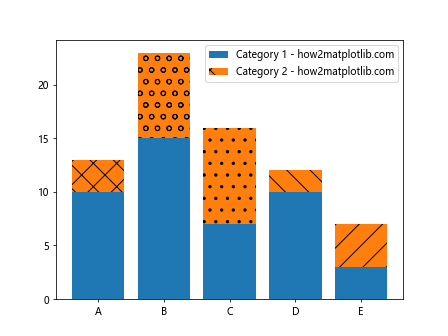
示例6:在堆叠条形图中使用纹理
# 示例代码6
import matplotlib.pyplot as plt
import numpy as np

category1 = [10, 15, 7, 10, 3]
category2 = [3, 8, 9, 2, 4]
labels = ['A', 'B', 'C', 'D', 'E']
patterns = ['x', 'o', '.', '\\', '/']

fig, ax = plt.subplots()
bar1 = ax.bar(labels, category1, label='Category 1 - how2matplotlib.com')
bar2 = ax.bar(labels, category2, bottom=category1, label='Category 2 - how2matplotlib.com')

for bar, pattern in zip(bar2, patterns):
    bar.set_hatch(pattern)

ax.legend()
plt.show()
Output:
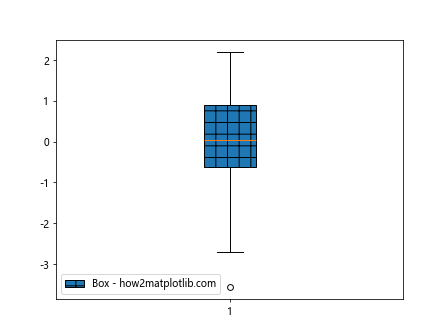
示例7:在箱形图中使用纹理
# 示例代码7
import matplotlib.pyplot as plt
import numpy as np

data = np.random.randn(100)
patterns = ['+']

fig, ax = plt.subplots()
box = ax.boxplot(data, patch_artist=True)
for patch in box['boxes']:
    patch.set_hatch(patterns[0])
    patch.set_label(f'Box - how2matplotlib.com')

ax.legend()
plt.show()
Output:
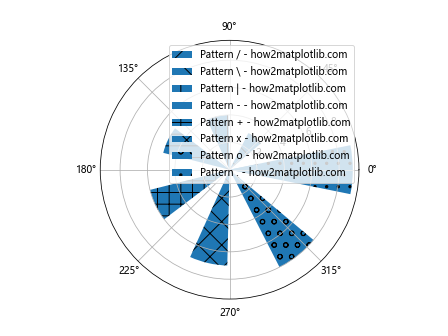
示例8:在极坐标图中使用纹理
# 示例代码8
import matplotlib.pyplot as plt
import numpy as np

theta = np.linspace(0, 2*np.pi, 8)
radii = np.array([2, 3, 4, 5, 6, 7, 8, 9])
patterns = ['/', '\\', '|', '-', '+', 'x', 'o', '.']

fig, ax = plt.subplots(subplot_kw={'projection': 'polar'})
bars = ax.bar(theta, radii, width=0.4)

for bar, pattern in zip(bars, patterns):
    bar.set_hatch(pattern)
    bar.set_label(f'Pattern {pattern} - how2matplotlib.com')

ax.legend()
plt.show()
Output:
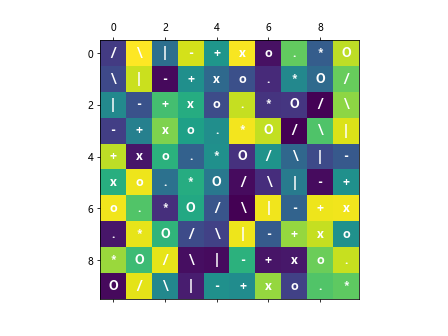
示例9:在热图中使用纹理
# 示例代码9
import matplotlib.pyplot as plt
import numpy as np

data = np.random.rand(10, 10)
patterns = ['/', '\\', '|', '-', '+', 'x', 'o', '.', '*', 'O']

fig, ax = plt.subplots()
cax = ax.matshow(data, cmap='viridis')

for i in range(data.shape[0]):
    for j in range(data.shape[1]):
        ax.text(j, i, f'{patterns[(i+j) % len(patterns)]}', va='center', ha='center', color='white', fontsize=12, fontweight='bold')

plt.show()
Output:
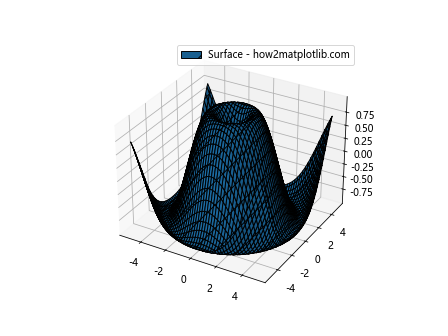
示例10:在3D图形中使用纹理
# 示例代码10
import matplotlib.pyplot as plt
from mpl_toolkits.mplot3d import Axes3D
import numpy as np

x = np.linspace(-5, 5, 100)
y = np.linspace(-5, 5, 100)
x, y = np.meshgrid(x, y)
z = np.sin(np.sqrt(x**2 + y**2))

fig = plt.figure()
ax = fig.add_subplot(111, projection='3d')
ax.plot_surface(x, y, z, edgecolor='k', hatch='/', label='Surface - how2matplotlib.com')

ax.legend()
plt.show()
Output:
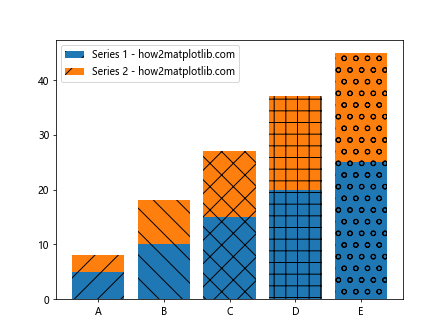
示例11:在多系列条形图中使用纹理
# 示例代码11
import matplotlib.pyplot as plt
import numpy as np

data1 = [5, 10, 15, 20, 25]
data2 = [3, 8, 12, 17, 20]
labels = ['A', 'B', 'C', 'D', 'E']
patterns = ['/', '\\', 'x', '+', 'o']

fig, ax = plt.subplots()
bar1 = ax.bar(labels, data1, label='Series 1 - how2matplotlib.com')
bar2 = ax.bar(labels, data2, bottom=data1, label='Series 2 - how2matplotlib.com')

for bar, pattern in zip(bar1 + bar2, patterns + patterns):
    bar.set_hatch(pattern)

ax.legend()
plt.show()
Output:
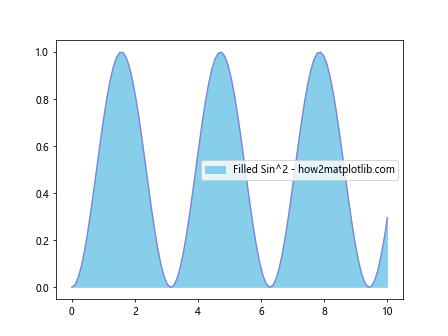
示例12:在填充曲线下区域使用纹理
# 示例代码12
import matplotlib.pyplot as plt
import numpy as np

x = np.linspace(0, 10, 100)
y = np.sin(x)**2

fig, ax = plt.subplots()
ax.fill_between(x, y, color='skyblue', hatch='/', label='Filled Sin^2 - how2matplotlib.com')
ax.plot(x, y, color='Slateblue', alpha=0.6)

ax.legend()
plt.show()
Output:
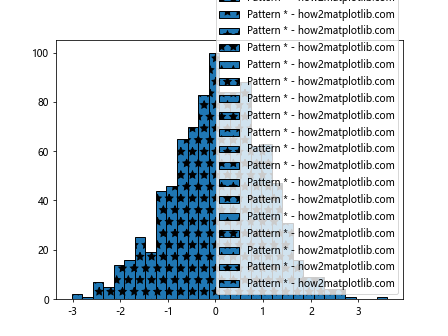
示例13:在直方图中使用纹理
# 示例代码13
import matplotlib.pyplot as plt
import numpy as np

data = np.random.normal(0, 1, 1000)
patterns = ['*']

fig, ax = plt.subplots()
n, bins, patches = ax.hist(data, bins=30, edgecolor='black')

for patch, pattern in zip(patches, patterns * len(patches)):
    patch.set_hatch(pattern)
    patch.set_label(f'Pattern {pattern} - how2matplotlib.com')

ax.legend()
plt.show()
Output:
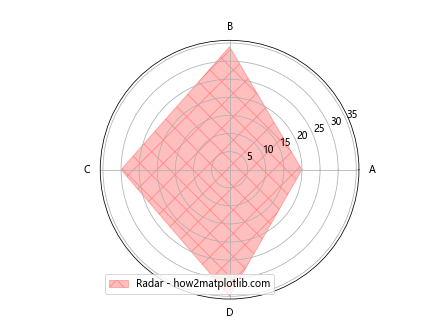
示例14:在雷达图中使用纹理
# 示例代码14
import matplotlib.pyplot as plt
import numpy as np

labels=np.array(['A', 'B', 'C', 'D'])
stats=np.array([20, 34, 30, 35])
angles=np.linspace(0, 2*np.pi, len(labels), endpoint=False).tolist()

stats=np.concatenate((stats,[stats[0]]))
angles+=angles[:1]

fig, ax = plt.subplots(subplot_kw={'projection': 'polar'})
ax.fill(angles, stats, color='red', alpha=0.25, hatch='x', label='Radar - how2matplotlib.com')
ax.set_xticks(angles[:-1])
ax.set_xticklabels(labels)

ax.legend()
plt.show()
Output:
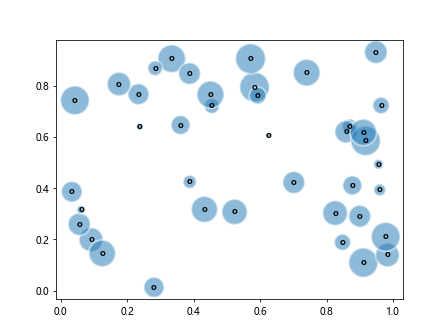
示例15:在气泡图中使用纹理
# 示例代码15
import matplotlib.pyplot as plt
import numpy as np

x = np.random.rand(40)
y = np.random.rand(40)
z = np.random.rand(40) * 1000

fig, ax = plt.subplots()
bubble = ax.scatter(x, y, s=z, alpha=0.5, edgecolors='w', linewidth=2)

for i in range(len(x)):
    ax.text(x[i], y[i], 'o', ha='center', va='center', fontdict={'color':'black', 'weight':'bold', 'size':9})

plt.show()
Output:
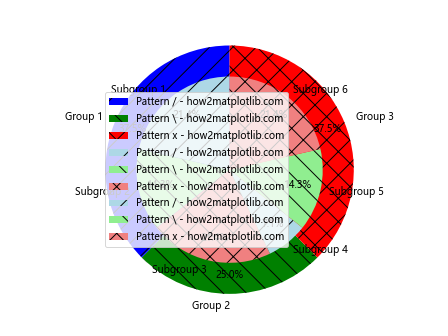
示例16:在带有纹理的多层饼图中
# 示例代码16
import matplotlib.pyplot as plt
import numpy as np

sizes_outer = [300, 200, 300]
sizes_inner = [150, 100, 150, 50, 100, 150]
colors_outer = ['blue', 'green', 'red']
colors_inner = ['lightblue', 'lightgreen', 'lightcoral', 'lightblue', 'lightgreen', 'lightcoral']
labels_outer = ['Group 1', 'Group 2', 'Group 3']
labels_inner = ['Subgroup 1', 'Subgroup 2', 'Subgroup 3', 'Subgroup 4', 'Subgroup 5', 'Subgroup 6']
patterns = ['/', '\\', 'x']

fig, ax = plt.subplots()
ax.pie(sizes_outer, labels=labels_outer, colors=colors_outer, radius=1.2, autopct='%1.1f%%', pctdistance=0.85, startangle=90)
ax.pie(sizes_inner, labels=labels_inner, colors=colors_inner, radius=0.9, autopct='%1.1f%%', pctdistance=0.75, startangle=90)

for i, pie_wedge in enumerate(ax.patches):
    pie_wedge.set_hatch(patterns[i % len(patterns)])
    pie_wedge.set_label(f'Pattern {patterns[i % len(patterns)]} - how2matplotlib.com')

ax.legend()
plt.show()
Output:
示例17:在地图上使用纹理标记不同区域
# 示例代码17
import matplotlib.pyplot as plt
import numpy as np
import geopandas as gpd

world = gpd.read_file(gpd.datasets.get_path('naturalearth_lowres'))
patterns = ['/', '\\', '+', 'x']

fig, ax = plt.subplots()
world.plot(ax=ax, color='white', edgecolor='black')

for i, country in world.iterrows():
    ax.add_patch(plt.Polygon(np.array(country['geometry'].exterior.coords), closed=True, fill=True, hatch=patterns[i % len(patterns)]))

plt.show()
示例18:在误差条图中使用纹理
# 示例代码18
import matplotlib.pyplot as plt
import numpy as np

x = np.arange(5)
y = np.random.rand(5)
yerr = np.random.rand(5) / 10
patterns = ['/', '\\', '|', '-', '+']

fig, ax = plt.subplots()
error_bars = ax.errorbar(x, y, yerr=yerr, fmt='o', color='black')

for i, bar in enumerate(error_bars.get_children()[1].get_paths()):
    bar.set_hatch(patterns[i])
    bar.set_label(f'Error bar {patterns[i]} - how2matplotlib.com')

ax.legend()
plt.show()
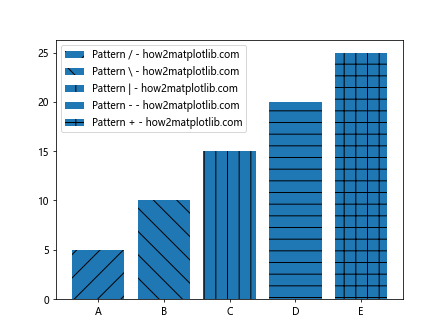
示例19:在条形图中使用多种纹理
# 示例代码20
import matplotlib.pyplot as plt
import numpy as np

data = [5, 10, 15, 20, 25]
labels = ['A', 'B', 'C', 'D', 'E']
patterns = ['/', '\\', '|', '-', '+']

fig, ax = plt.subplots()
bars = ax.bar(labels, data)

for bar, pattern in zip(bars, patterns):
    bar.set_hatch(pattern)
    bar.set_label(f'Pattern {pattern} - how2matplotlib.com')

ax.legend()
plt.show()
Output:
5. 总结
在本文中,我们探讨了如何在Matplotlib中添加纹理以增强图形的视觉表现。通过20个不同的示例,我们展示了在各种类型的图表中添加纹理的多样性和实用性。从基本的条形图、饼图到更复杂的3D图形和地图,纹理的使用都能帮助观众更好地理解数据的分布和差异。
纹理不仅能增加图形的美观性,还能在颜色不足以区分不同数据系列或在打印黑白文档时发挥重要作用。通过合理的纹理使用,可以使图表在视觉上更加清晰和吸引人。
 极客笔记
极客笔记