subplot title matplotlib
在使用matplotlib绘制子图(subplot)时,我们经常会遇到需要给每个子图添加一个标题的情况。在本文中,我们将详细介绍如何为每个子图添加标题,以及一些常用的参数设置和样式。
设置子图标题
要为子图添加标题,可以使用set_title()方法。这个方法接受一个字符串作为标题内容,并可以设置标题的位置、字体大小、颜色等属性。
import matplotlib.pyplot as plt

fig, axs = plt.subplots(2, 2)

axs[0, 0].plot([1, 2, 3, 4], [1, 4, 2, 3])
axs[0, 0].set_title('Subplot 1')

axs[0, 1].scatter([1, 2, 3, 4], [1, 4, 2, 3])
axs[0, 1].set_title('Subplot 2', fontsize=14, color='red')

plt.show()
Output:
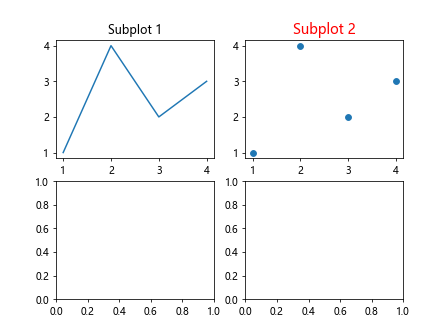
在上面的示例中,我们创建了一个2×2的子图,分别给每个子图设置了一个标题,并对第二个子图的标题进行了字体大小和颜色的设置。
设置全局标题
除了为每个子图添加标题外,我们还可以为整个图形添加一个全局的标题。这可以通过fig.suptitle()方法实现。这个方法也接受一个字符串作为标题内容,并可以设置标题的位置、字体大小、颜色等属性。
import matplotlib.pyplot as plt

fig, axs = plt.subplots(2, 2)

axs[0, 0].plot([1, 2, 3, 4], [1, 4, 2, 3])
axs[0, 0].set_title('Subplot 1')

axs[0, 1].scatter([1, 2, 3, 4], [1, 4, 2, 3])
axs[0, 1].set_title('Subplot 2')

fig.suptitle('Main Title', fontsize=16, color='blue')

plt.show()
Output:
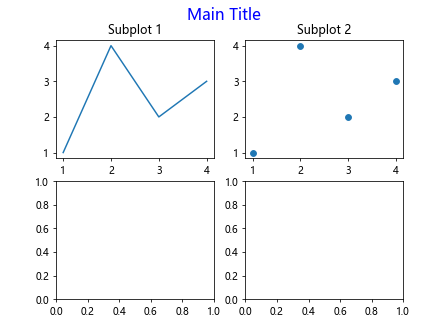
在上面的示例中,我们在整个图形上方添加了一个全局标题,并设置了标题的字体大小和颜色。
调整标题位置
默认情况下,子图的标题位于子图的中心位置。如果我们想要调整标题的位置,可以通过loc参数设置。常用的位置参数有以下几种:
'center''left''right''upper left''upper right''lower left''lower right'
import matplotlib.pyplot as plt

fig, axs = plt.subplots(1, 2)

axs[0].plot([1, 2, 3, 4], [1, 4, 2, 3])
axs[0].set_title('Subplot 1', loc='left')

axs[1].scatter([1, 2, 3, 4], [1, 4, 2, 3])
axs[1].set_title('Subplot 2', loc='right')

plt.show()
Output:
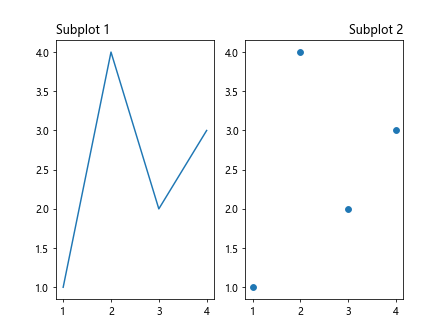
在上面的示例中,我们分别给两个子图设置了标题,通过loc参数调整了标题的位置。
设置标题样式
除了标题的内容、位置外,我们还可以设置标题的字体大小、颜色、样式等。这些样式参数都可以通过set_title()方法的参数设置。
import matplotlib.pyplot as plt

fig, axs = plt.subplots(1, 2)

axs[0].plot([1, 2, 3, 4], [1, 4, 2, 3])
axs[0].set_title('Subplot 1', fontdict={'size': 16, 'color': 'green', 'weight': 'bold'})

axs[1].scatter([1, 2, 3, 4], [1, 4, 2, 3])
axs[1].set_title('Subplot 2', fontdict={'size': 14, 'color': 'purple', 'style': 'italic'})

plt.show()
Output:
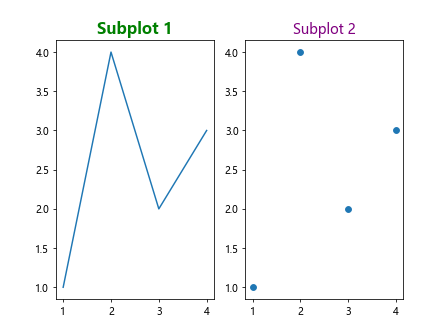
在上面的示例中,我们分别为两个子图设置了标题的字体大小、颜色和样式。
多行标题
有时候我们希望标题可以显示多行文本,这可以通过在标题内容中使用换行符\n来实现。
import matplotlib.pyplot as plt

fig, axs = plt.subplots(1, 2)

axs[0].plot([1, 2, 3, 4], [1, 4, 2, 3])
axs[0].set_title('Subplot 1\nLine 2')

axs[1].scatter([1, 2, 3, 4], [1, 4, 2, 3])
axs[1].set_title('Subplot 2\nLine 2\nLine 3')

plt.show()
Output:
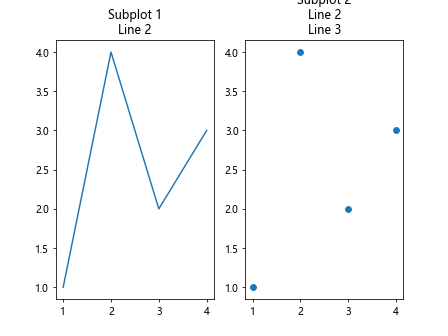
在上面的示例中,我们分别为两个子图设置了多行标题。
自定义标题边距
有时候自动生成的标题边距可能不够理想,我们可以通过设置pad参数来调整标题的边距。
import matplotlib.pyplot as plt

fig, axs = plt.subplots()
axs.plot([1, 2, 3, 4], [1, 4, 2, 3])
axs.set_title('Subplot 1', pad=20)

plt.show()
Output:
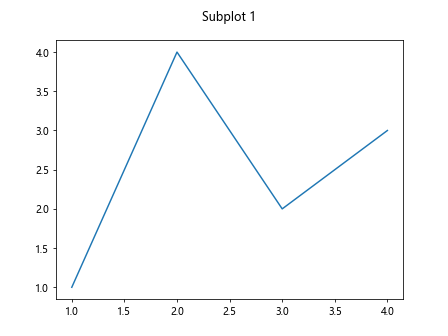
在上面的示例中,我们为子图的标题设置了较大的边距。
标题旋转
如果标题内容过长,我们可以通过设置rotation参数来旋转标题的文本,以便更好地显示。
import matplotlib.pyplot as plt

fig, axs = plt.subplots()
axs.plot([1, 2, 3, 4], [1, 4, 2, 3])
axs.set_title('This is a very long title that needs to be rotated', rotation=45)

plt.show()
Output:
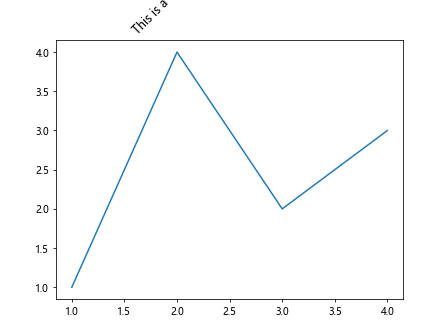
在上面的示例中,我们为子图的标题设置了45度的旋转角度。
隐藏标题
如果我们不希望显示子图的标题,可以通过将set_title()方法中的参数设置为None来实现。
import matplotlib.pyplot as plt

fig, axs = plt.subplots()
axs.plot([1, 2, 3, 4], [1, 4, 2, 3])
axs.set_title(None)

plt.show()
Output:
在上面的示例中,我们将子图的标题隐藏了。
多个子图设置不同标题
在绘制多个子图时,我们可能希望为每个子图设置不同的标题。这可以通过在循环中设置每个子图的标题来实现。
import matplotlib.pyplot as plt

fig, axs = plt.subplots(2, 2)

for i in range(2):
    for j in range(2):
        axs[i, j].plot([1, 2, 3, 4], [1, 4, 2, 3])
        axs[i, j].set_title(f'Subplot {i+1}-{j+1}')

plt.show()
Output:
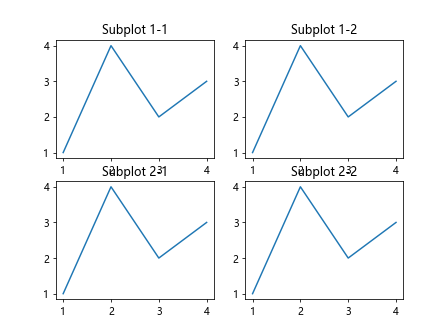
在上面的示例中,我们使用循环为每个子图设置了不同的标题。
关闭子图标题自动调整
在某些情况下,当我们绘制子图时,matplotlib会自动调整标题的位置和大小以适应子图的大小。如果我们不希望自动调整标题,可以通过关闭tight_layout参数来实现。
import matplotlib.pyplot as plt

fig, axs = plt.subplots(1, 2)

axs[0].plot([1, 2, 3, 4], [1, 4, 2, 3])
axs[0].set_title('Subplot 1')

axs[1].scatter([1, 2, 3, 4], [1, 4, 2, 3])
axs[1].set_title('Subplot 2')

plt.tight_layout(rect=[0, 0, 1, 0.9])  # 关闭tight_layout自动调整标题
plt.show()
Output:
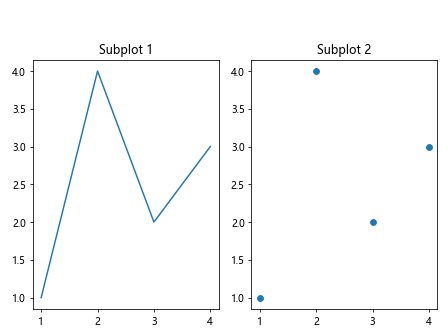
在上面的示例中,我们通过设置tight_layout(rect=[0, 0, 1, 0.9])关闭了自动调整标题,使得标题不再随子图大小的变化而自动调整。
设置子图标题的背景颜色
有时候我们希望为子图标题添加背景颜色,以便突出显示。这可以通过在set_title()方法中设置backgroundcolor参数来实现。
import matplotlib.pyplot as plt

fig, axs = plt.subplots(1, 2)

axs[0].plot([1, 2, 3, 4], [1, 4, 2, 3])
axs[0].set_title('Subplot 1', backgroundcolor='lightblue')

axs[1].scatter([1, 2, 3, 4], [1, 4, 2, 3])
axs[1].set_title('Subplot 2', backgroundcolor='lightpink')

plt.show()
Output:
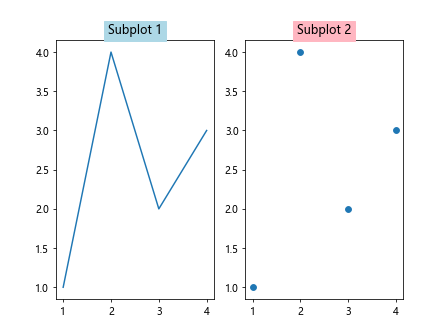
在上面的示例中,我们分别为两个子图的标题添加了不同的背景颜色。
动态更新子图标题
有时候我们希望能够根据特定条件动态更新子图标题,这可以通过定时器(timer)和回调函数(callback)来实现。
import matplotlib.pyplot as plt
from matplotlib.animation import FuncAnimation

fig, axs = plt.subplots()
line, = axs.plot([], [])
title = axs.set_title('')

def update_title(frame):
    if frame % 2 == 0:
        title.set_text('Even Frame')
    else:
        title.set_text('Odd Frame')

ani = FuncAnimation(fig, update_title, frames=10, interval=1000)
plt.show()
在上面的示例中,我们创建了一个动态更新子图标题的动画,根据帧数的奇偶性来更新标题内容。
自定义标题样式
除了通过fontdict参数设置标题样式外,我们还可以通过set_title()方法的其他参数来进一步定制标题样式。
import matplotlib.pyplot as plt

fig, axs = plt.subplots()

axs.plot([1, 2, 3, 4], [1, 4, 2, 3])
title = axs.set_title('Custom Title Style')

title.set_fontsize(18)
title.set_color('orange')
title.set_fontweight('bold')
title.set_backgroundcolor('lightgreen')

plt.show()
Output:
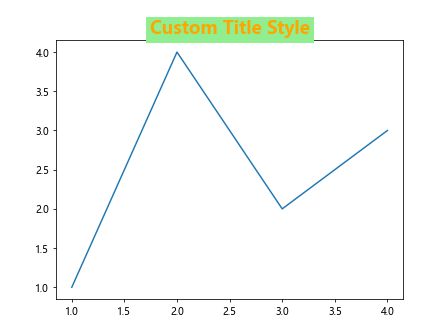
在上面的示例中,我们通过set_title()方法返回的标题对象进一步设置了标题的字体大小、颜色、粗细和背景颜色。
标题包含LaTeX公式
如果我们希望在标题中包含LaTeX公式,可以通过在标题字符串中使用$符号来实现。
import matplotlib.pyplot as plt

fig, axs = plt.subplots()

axs.plot([1, 2, 3, 4], [1, 4, 2, 3])
axs.set_title('Subplot 1: y = x^2')

plt.show()
Output:
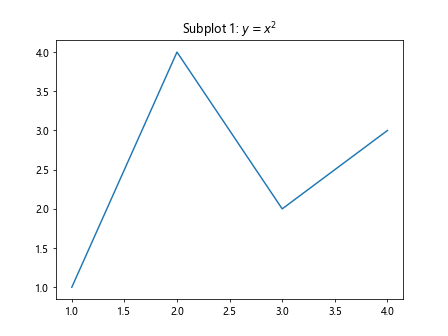
在上面的示例中,我们在标题字符串中使用$符号包裹LaTeX公式,以在标题中显示数学公式。
使用子标题代替主标题
有时候我们希望子图的标题更加突出,而不需要一个全局的主标题。这时我们可以将主标题留空,只为每个子图设置标题。
import matplotlib.pyplot as plt

fig, axs = plt.subplots(1, 2, figsize=(10, 5))

axs[0].plot([1, 2, 3, 4], [1, 4, 2, 3])
axs[0].set_title('Subplot 1')

axs[1].scatter([1, 2, 3, 4], [1, 4, 2, 3])
axs[1].set_title('Subplot 2')

fig.suptitle('')
plt.show()
Output:
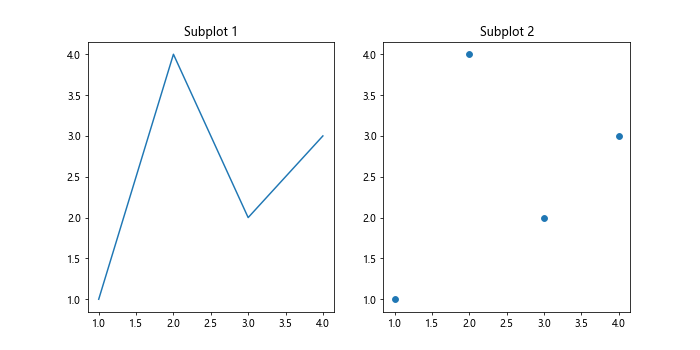
在上面的示例中,我们为每个子图设置了标题,并清空了全局主标题,使得子图标题更加突出。
结论
通过本文的介绍,我们学习了如何使用matplotlib为子图添加标题,并对标题的位置、样式、多行显示等进行了详细说明。通过灵活使用这些方法,我们可以定制化地设置子图标题,使得图表更具可读性和美观性。
 极客笔记
极客笔记