Matplotlib非阻塞绘图:实现交互式可视化的高效方法
参考:Plotting In A Non-Blocking Way With Matplotlib
Matplotlib是Python中最流行的数据可视化库之一,它提供了丰富的绘图功能。然而,在某些情况下,特别是在需要实时更新或交互式操作图形时,Matplotlib的默认阻塞模式可能会限制我们的操作。本文将详细介绍如何使用Matplotlib进行非阻塞绘图,以实现更加流畅和响应迅速的可视化体验。
1. 理解阻塞与非阻塞绘图
在深入探讨非阻塞绘图之前,我们首先需要理解阻塞和非阻塞绘图的区别。
1.1 阻塞绘图
在默认情况下,Matplotlib使用阻塞模式进行绘图。这意味着当我们调用plt.show()函数时,程序会暂停执行,直到我们关闭图形窗口。这种模式适用于静态图表的展示,但在需要持续更新或与用户交互的场景中可能会造成不便。
以下是一个阻塞绘图的简单示例:
import matplotlib.pyplot as plt
import numpy as np

x = np.linspace(0, 10, 100)
y = np.sin(x)

plt.plot(x, y, label='how2matplotlib.com')
plt.title('Blocking Plot Example')
plt.legend()
plt.show()
Output:
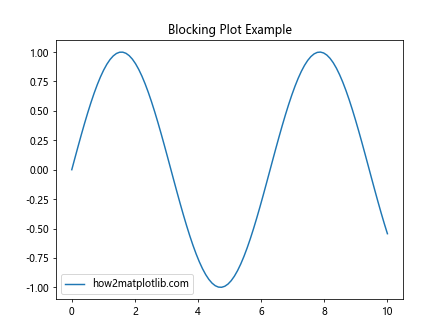
在这个例子中,plt.show()会阻塞程序的执行,直到我们关闭图形窗口,才会打印后面的文本。
1.2 非阻塞绘图
相比之下,非阻塞绘图允许程序在显示图形的同时继续执行。这对于创建动态更新的图表、实时数据可视化或需要与其他GUI元素交互的应用程序特别有用。
2. 实现非阻塞绘图的方法
Matplotlib提供了几种实现非阻塞绘图的方法,我们将逐一探讨这些方法。
2.1 使用plt.ion()和plt.draw()
一种简单的实现非阻塞绘图的方法是使用plt.ion()(交互模式)和plt.draw()。
import matplotlib.pyplot as plt
import numpy as np
import time

plt.ion()  # 打开交互模式

fig, ax = plt.subplots()
x = np.linspace(0, 10, 100)
line, = ax.plot(x, np.sin(x), label='how2matplotlib.com')
ax.set_title('Non-blocking Plot with plt.ion()')
ax.legend()

for i in range(50):
    line.set_ydata(np.sin(x + i/10.0))
    plt.draw()
    plt.pause(0.1)
    print(f"Iteration {i}")

plt.ioff()  # 关闭交互模式
plt.show()
Output:
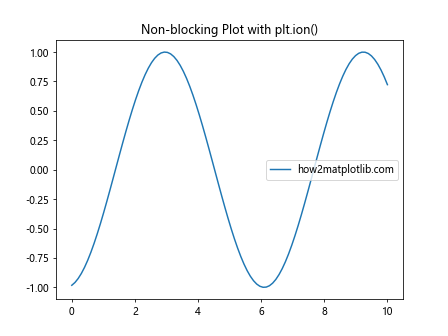
在这个例子中,我们使用plt.ion()打开交互模式,然后在循环中更新图形数据。plt.draw()用于重绘图形,plt.pause()用于短暂暂停以允许图形更新。最后,我们使用plt.ioff()关闭交互模式,并调用plt.show()来保持图形窗口打开。
2.2 使用animation模块
Matplotlib的animation模块提供了一种更加结构化的方法来创建动画和非阻塞图形。
import matplotlib.pyplot as plt
import matplotlib.animation as animation
import numpy as np

fig, ax = plt.subplots()
x = np.linspace(0, 2*np.pi, 100)
line, = ax.plot(x, np.sin(x), label='how2matplotlib.com')
ax.set_title('Non-blocking Animation')
ax.legend()

def animate(frame):
    line.set_ydata(np.sin(x + frame/10.0))
    return line,

ani = animation.FuncAnimation(fig, animate, frames=200, interval=50, blit=True)
plt.show()
Output:
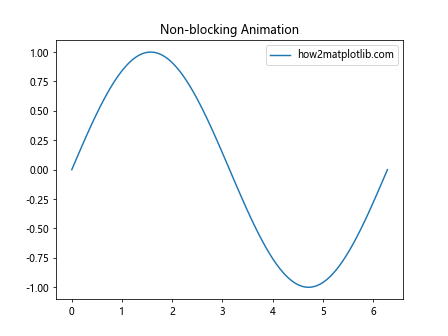
在这个例子中,我们定义了一个animate函数来更新图形数据,然后使用animation.FuncAnimation创建动画。这种方法不仅实现了非阻塞绘图,还提供了更好的性能和更多的控制选项。
2.3 使用后端的事件循环
某些Matplotlib后端(如Qt或Tk)允许我们直接使用它们的事件循环来实现非阻塞绘图。
import matplotlib.pyplot as plt
from matplotlib.backends.backend_qt5agg import FigureCanvasQTAgg as FigureCanvas
from PyQt5.QtWidgets import QApplication, QMainWindow
import sys
import numpy as np

class MainWindow(QMainWindow):
    def __init__(self):
        super().__init__()
        self.figure = plt.figure()
        self.canvas = FigureCanvas(self.figure)
        self.setCentralWidget(self.canvas)

        x = np.linspace(0, 10, 100)
        y = np.sin(x)
        plt.plot(x, y, label='how2matplotlib.com')
        plt.title('Non-blocking Plot with Qt Backend')
        plt.legend()

        self.show()

app = QApplication(sys.argv)
window = MainWindow()
sys.exit(app.exec_())
这个例子展示了如何使用Qt后端创建一个非阻塞的Matplotlib图形。通过将Matplotlib图形嵌入到Qt应用程序中,我们可以利用Qt的事件循环来保持图形的响应性。
3. 高级非阻塞绘图技巧
除了基本的非阻塞绘图方法,还有一些高级技巧可以帮助我们创建更复杂和交互性更强的可视化。
3.1 实时数据流可视化
对于需要实时显示数据流的应用,我们可以结合使用非阻塞绘图和数据队列。
import matplotlib.pyplot as plt
import numpy as np
from collections import deque
import time

class RealtimePlotter:
    def __init__(self, max_entries=100):
        self.fig, self.ax = plt.subplots()
        self.ax.set_title('Realtime Data Stream - how2matplotlib.com')
        self.line, = self.ax.plot([], [])
        self.ax.set_xlim(0, max_entries)
        self.ax.set_ylim(-1.1, 1.1)
        self.data = deque(maxlen=max_entries)

    def update(self, new_data):
        self.data.append(new_data)
        self.line.set_data(range(len(self.data)), self.data)
        self.fig.canvas.draw()
        self.fig.canvas.flush_events()

plotter = RealtimePlotter()
plt.ion()

for i in range(200):
    new_data = np.sin(i * 0.1)
    plotter.update(new_data)
    time.sleep(0.05)
    print(f"Data point {i}: {new_data:.2f}")

plt.ioff()
plt.show()
Output:
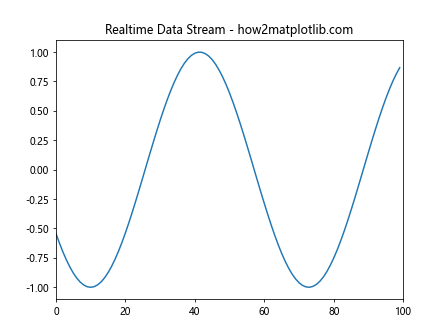
这个例子创建了一个实时数据流可视化器,它使用一个固定长度的双端队列来存储最新的数据点,并在每次更新时重绘图形。
3.2 多图表同时更新
在某些情况下,我们可能需要同时更新多个图表。非阻塞绘图使这变得可能。
import matplotlib.pyplot as plt
import numpy as np
import time

plt.ion()

fig, (ax1, ax2) = plt.subplots(2, 1)
x = np.linspace(0, 10, 100)
line1, = ax1.plot(x, np.sin(x), label='Sin - how2matplotlib.com')
line2, = ax2.plot(x, np.cos(x), label='Cos - how2matplotlib.com')
ax1.set_title('Multiple Plot Update')
ax1.legend()
ax2.legend()

for i in range(100):
    line1.set_ydata(np.sin(x + i/10.0))
    line2.set_ydata(np.cos(x + i/10.0))
    fig.canvas.draw()
    fig.canvas.flush_events()
    time.sleep(0.05)
    print(f"Update {i}")

plt.ioff()
plt.show()
Output:
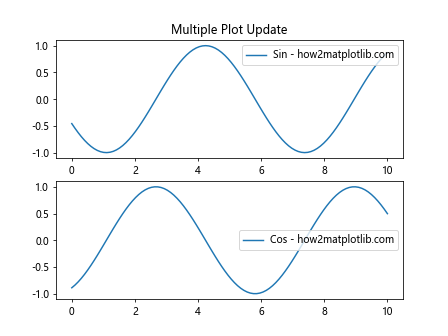
这个例子展示了如何同时更新两个不同的图表,一个显示正弦波,另一个显示余弦波。
3.3 交互式图表元素
非阻塞绘图还允许我们添加交互式元素,如滑块或按钮,以动态调整图表。
import matplotlib.pyplot as plt
from matplotlib.widgets import Slider
import numpy as np

plt.ion()

fig, ax = plt.subplots()
plt.subplots_adjust(bottom=0.25)

t = np.linspace(0, 1, 1000)
a0 = 5
f0 = 3
s = a0 * np.sin(2 * np.pi * f0 * t)

line, = plt.plot(t, s, lw=2, label='how2matplotlib.com')
ax.set_xlabel('Time [s]')
ax.set_ylabel('Amplitude')
ax.legend()

ax_freq = plt.axes([0.25, 0.1, 0.65, 0.03])
freq_slider = Slider(ax_freq, 'Frequency', 0.1, 30.0, valinit=f0)

def update(val):
    f = freq_slider.val
    line.set_ydata(a0 * np.sin(2 * np.pi * f * t))
    fig.canvas.draw_idle()

freq_slider.on_changed(update)

plt.show()
Output:
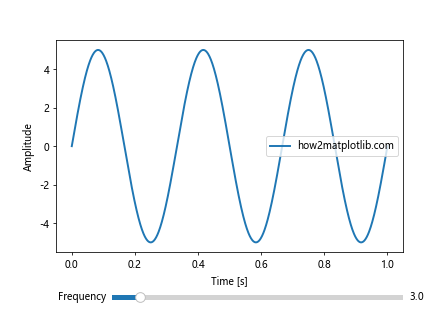
这个例子创建了一个带有频率滑块的正弦波图。用户可以通过移动滑块来实时改变波形的频率。
4. 非阻塞绘图的性能考虑
虽然非阻塞绘图为我们提供了更大的灵活性,但它也可能带来一些性能挑战,特别是在处理大量数据或频繁更新时。
4.1 使用blitting提高性能
Blitting是一种优化技术,它只重绘图形中发生变化的部分,而不是整个图形。这可以显著提高动画的性能。
import matplotlib.pyplot as plt
import numpy as np
import time

class BlitManager:
    def __init__(self, canvas, animated_artists=()):
        self.canvas = canvas
        self._bg = None
        self._artists = []

        for a in animated_artists:
            self.add_artist(a)
        self.canvas.mpl_connect("draw_event", self.on_draw)

    def on_draw(self, event):
        cv = self.canvas
        if event is not None:
            if event.canvas != cv:
                raise RuntimeError
        self._bg = cv.copy_from_bbox(cv.figure.bbox)
        self._draw_animated()

    def add_artist(self, art):
        if art.figure != self.canvas.figure:
            raise RuntimeError
        art.set_animated(True)
        self._artists.append(art)

    def _draw_animated(self):
        fig = self.canvas.figure
        for a in self._artists:
            fig.draw_artist(a)

    def update(self):
        cv = self.canvas
        if self._bg is None:
            self.on_draw(None)
        else:
            cv.restore_region(self._bg)
            self._draw_animated()
            cv.blit(cv.figure.bbox)

plt.ion()

fig, ax = plt.subplots()
x = np.linspace(0, 10, 100)
line, = ax.plot(x, np.sin(x), label='how2matplotlib.com')
ax.set_title('Blitting for Better Performance')
ax.legend()

bm = BlitManager(fig.canvas, [line])

tstart = time.time()
for i in range(1000):
    line.set_ydata(np.sin(x + i/10.0))
    bm.update()
    print(f"Frame {i}")

print(f"FPS: {1000/(time.time()-tstart):.1f}")

plt.ioff()
plt.show()
Output:
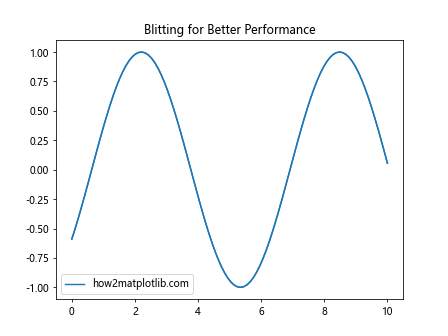
这个例子实现了一个BlitManager类来处理blitting。通过只更新发生变化的部分,我们可以显著提高动画的帧率。
4.2 减少重绘频率
在某些情况下,我们可能不需要每次数据更新都重绘图形。通过减少重绘频率,我们可以在保持视觉流畅性的同时提高性能。
import matplotlib.pyplot as plt
import numpy as np
import time

plt.ion()

fig, ax = plt.subplots()
x = np.linspace(0, 10, 100)
line, = ax.plot(x, np.sin(x), label='how2matplotlib.com')
ax.set_title('Reduced Redraw Frequency')
ax.legend()

redraw_interval = 5  # 每5次更新重绘一次
for i in range(200):
    line.set_ydata(np.sin(x + i/10.0))
    if i % redraw_interval == 0:
        fig.canvas.draw()
        fig.canvas.flush_events()
    time.sleep(0.01)
    print(f"Update {i}")

plt.ioff()
plt.show()
Output:
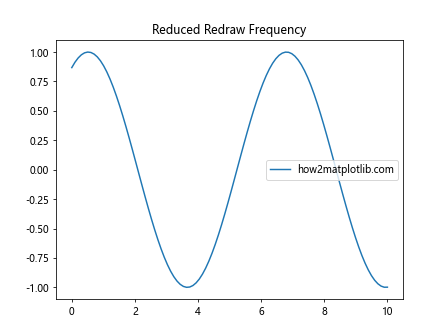
在这个例子中,我们只在每5次数据更新后才重绘图形,这可以显著减少CPU的使用。
5. 非阻塞绘图在实际应用中的使用
非阻塞绘图在许多实际应用中都有重要作用,特别是在需要实时数据可视化的场景中。
5.1 股票市场数据可视化
以下是一个模拟股票市场数据实时可视化的例子:
import matplotlib.pyplot as plt
import numpy as np
import time
from collections import deque

class StockVisualizer:
    def __init__(self, max_entries=100):
        plt.ion()
        self.fig, self.ax = plt.subplots()
        self.ax.set_title('Real-time Stock Price - how2matplotlib.com')
        self.ax.set_xlabel('Time')
        self.ax.set_ylabel('Price')
        self.line, = self.ax.plot([], [])
        self.ax.set_xlim(0, max_entries)
        self.ax.set_ylim(0, 110)
        self.data = deque(maxlen=max_entries)

    def update(self, new_price):
        self.data.append(new_price)
        self.line.set_data(range(len(self.data)), self.data)
        self.fig.canvas.draw()
        self.fig.canvas.flush_events()

visualizer = StockVisualizer()

# 模拟股票价格变动
initial_price = 100
for i in range(200):
    price = initial_price + np.random.normal(0, 1)
    visualizer.update(price)
    time.sleep(0.05)
    print(f"Time: {i}, Price: {price:.2f}")

plt.ioff()
plt.show()
这个例子创建了一个实时股票价格可视化器,它使用随机波动来模拟股票价格的变化。非阻塞绘图允许我们在更新图表的同时继续接收和处理新的价格数据。
6. 结合其他库使用非阻塞绘图
Matplotlib的非阻塞绘图功能可以与其他Python库结合使用,以创建更复杂的应用程序。
6.1 结合Tkinter使用
以下是一个将Matplotlib图表嵌入到Tkinter GUI中的例子:
import tkinter as tk
from matplotlib.backends.backend_tkagg import FigureCanvasTkAgg
import matplotlib.pyplot as plt
import numpy as np

class App(tk.Tk):
    def __init__(self):
        super().__init__()
        self.title("Matplotlib in Tkinter - how2matplotlib.com")

        self.fig, self.ax = plt.subplots()
        self.x = np.linspace(0, 10, 100)
        self.line, = self.ax.plot(self.x, np.sin(self.x))

        self.canvas = FigureCanvasTkAgg(self.fig, master=self)
        self.canvas.draw()
        self.canvas.get_tk_widget().pack()

        self.button = tk.Button(self, text="Update", command=self.update_plot)
        self.button.pack()

    def update_plot(self):
        self.line.set_ydata(np.sin(self.x + np.random.rand()))
        self.canvas.draw()
        print("Plot updated")

app = App()
app.mainloop()
这个例子创建了一个Tkinter窗口,其中包含一个Matplotlib图表和一个更新按钮。点击按钮会更新图表中的正弦波。
6.2 结合PyQt使用
以下是一个将Matplotlib图表嵌入到PyQt应用程序中的例子:
import sys
from PyQt5.QtWidgets import QApplication, QMainWindow, QVBoxLayout, QPushButton, QWidget
from matplotlib.backends.backend_qt5agg import FigureCanvasQTAgg as FigureCanvas
import matplotlib.pyplot as plt
import numpy as np

class MainWindow(QMainWindow):
    def __init__(self):
        super().__init__()
        self.setWindowTitle("Matplotlib in PyQt - how2matplotlib.com")

        layout = QVBoxLayout()

        self.fig, self.ax = plt.subplots()
        self.x = np.linspace(0, 10, 100)
        self.line, = self.ax.plot(self.x, np.sin(self.x))

        self.canvas = FigureCanvas(self.fig)
        layout.addWidget(self.canvas)

        button = QPushButton("Update")
        button.clicked.connect(self.update_plot)
        layout.addWidget(button)

        container = QWidget()
        container.setLayout(layout)
        self.setCentralWidget(container)

    def update_plot(self):
        self.line.set_ydata(np.sin(self.x + np.random.rand()))
        self.canvas.draw()
        print("Plot updated")

app = QApplication(sys.argv)
window = MainWindow()
window.show()
sys.exit(app.exec_())
这个例子创建了一个PyQt窗口,其中包含一个Matplotlib图表和一个更新按钮。点击按钮会更新图表中的正弦波。
7. 非阻塞绘图的最佳实践
在使用Matplotlib进行非阻塞绘图时,有一些最佳实践可以帮助我们创建更高效、更易于维护的代码:
- 使用面向对象的方法:将绘图逻辑封装在类中,可以使代码更加模块化和可重用。
-
适当使用blitting:对于需要频繁更新的图表,使用blitting可以显著提高性能。
-
控制更新频率:不是每次数据变化都需要更新图表,可以设置一个合适的更新间隔。
-
使用适当的数据结构:对于实时数据流,考虑使用collections.deque来存储最新的数据点。
-
错误处理:在非阻塞绘图中,确保正确处理可能出现的异常,以防止程序崩溃。
-
资源管理:记得在不需要时关闭图形窗口和释放资源。
-
使用动画模块:对于复杂的动画,考虑使用Matplotlib的animation模块。
-
性能监控:在开发过程中,定期检查CPU和内存使用情况,确保程序运行效率。
8. 结论
Matplotlib的非阻塞绘图功能为创建动态、交互式的数据可视化提供了强大的工具。通过本文介绍的各种技术和示例,我们可以实现从简单的实时数据流可视化到复杂的交互式应用程序。非阻塞绘图不仅提高了程序的响应性,还开启了数据可视化的新可能性。
然而,使用非阻塞绘图也带来了一些挑战,如性能优化和复杂的事件处理。通过遵循最佳实践,合理使用blitting等技术,我们可以克服这些挑战,创建出既高效又用户友好的可视化应用。
随着数据可视化在科学研究、金融分析、工程应用等领域的重要性日益增加,掌握Matplotlib的非阻塞绘图技术将成为数据科学家和软件开发者的宝贵技能。通过不断实践和探索,我们可以充分发挥Matplotlib的潜力,创造出更加丰富多彩的数据可视化世界。
 极客笔记
极客笔记