使用Matplotlib绘制带标签的散点图
参考:matplotlib plot point with label
Matplotlib是一个Python的2D绘图库,可以用来生成高质量的图表。在本文中,我们将讨论如何使用Matplotlib绘制带标签的散点图。在散点图中,我们可以将每个数据点表示为一个点,然后使用标签进行标记。
安装Matplotlib
在开始之前,首先需要安装Matplotlib库。如果你还没有安装,可以使用以下命令进行安装:
pip install matplotlib
创建基本的散点图
首先,让我们创建一个基本的散点图,包含一些数据点和它们的标签。我们可以使用scatter函数来实现:
import matplotlib.pyplot as plt

x = [1, 2, 3, 4, 5]
y = [2, 3, 5, 7, 6]
labels = ['point1', 'point2', 'point3', 'point4', 'point5']

plt.scatter(x, y)

for i, label in enumerate(labels):
    plt.annotate(label, (x[i], y[i]))

plt.show()
Output:
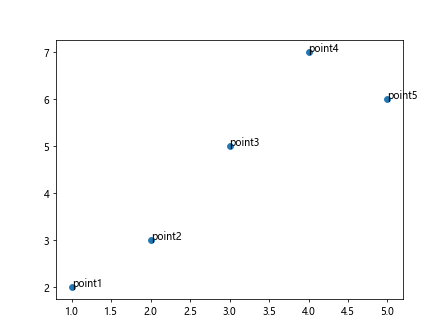
在这段代码中,我们定义了x和y坐标的数据点以及每个数据点的标签。然后,我们使用scatter函数创建散点图,并使用annotate函数为每个数据点添加标签。最后,调用show函数展示图表。
自定义标签的样式
有时候我们希望调整标签的样式,比如改变字体颜色、大小或者背景颜色。下面是一个示例代码,展示如何自定义标签的样式:
import matplotlib.pyplot as plt

x = [1, 2, 3, 4, 5]
y = [2, 3, 5, 7, 6]
labels = ['point1', 'point2', 'point3', 'point4', 'point5']

plt.scatter(x, y)

for i, label in enumerate(labels):
    plt.annotate(label, (x[i], y[i]), color='red', fontsize=12, backgroundcolor='yellow')

plt.show()
Output:
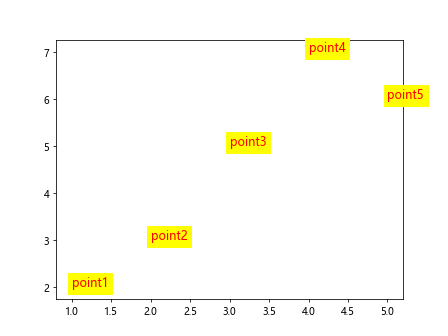
在这段代码中,我们在annotate函数中添加了color、fontsize和backgroundcolor参数。这样可以设置字体颜色、大小以及背景颜色。
根据数据点位置添加箭头
有时候,我们可能希望在标签旁边添加箭头,以便更清楚地指示每个数据点的位置。下面是一个示例代码,展示如何根据数据点位置添加箭头:
import matplotlib.pyplot as plt

x = [1, 2, 3, 4, 5]
y = [2, 3, 5, 7, 6]
labels = ['point1', 'point2', 'point3', 'point4', 'point5']

plt.scatter(x, y)

for i, label in enumerate(labels):
    plt.annotate(label, (x[i], y[i]), arrowprops=dict(arrowstyle='->'))

plt.show()
Output:
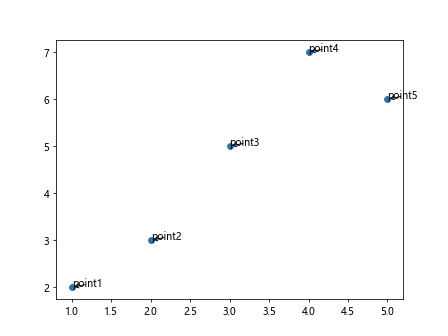
在这段代码中,我们在annotate函数中添加了arrowprops参数,指定了箭头的样式为'->'。这样可以在标签旁边添加箭头。
改变箭头的风格
除了改变箭头的样式外,我们还可以改变箭头的其他属性,比如箭头的大小、颜色和粗细。下面是一个示例代码,展示如何改变箭头的风格:
import matplotlib.pyplot as plt

x = [1, 2, 3, 4, 5]
y = [2, 3, 5, 7, 6]
labels = ['point1', 'point2', 'point3', 'point4', 'point5']

plt.scatter(x, y)

for i, label in enumerate(labels):
    plt.annotate(label, (x[i], y[i]), arrowprops=dict(arrowstyle='->', color='blue', linewidth=2, shrinkA=0, shrinkB=0))

plt.show()
Output:
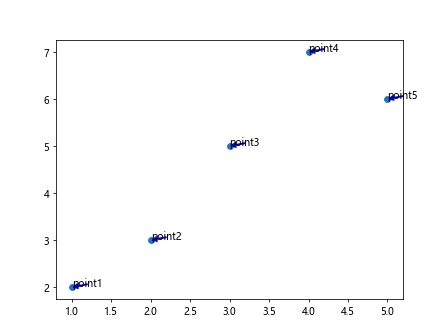
在这段代码中,我们在arrowprops参数中除了指定箭头的样式外,还指定了箭头的颜色为蓝色,线宽为2,并且将shrinkA和shrinkB设置为0,这样箭头会直接指向数据点。
改变标签的位置
有时候我们希望标签出现在数据点的旁边,而不是直接在数据点上面。下面是一个示例代码,展示如何改变标签的位置:
import matplotlib.pyplot as plt

x = [1, 2, 3, 4, 5]
y = [2, 3, 5, 7, 6]
labels = ['point1', 'point2', 'point3', 'point4', 'point5']

plt.scatter(x, y)

for i, label in enumerate(labels):
    plt.annotate(label, (x[i], y[i]), xytext=(x[i]+0.1, y[i]+0.1))

plt.show()
Output:
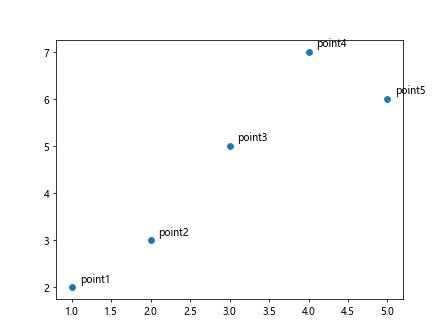
在这段代码中,我们在annotate函数中添加了xytext参数,指定了标签的位置相对于数据点的偏移量。这样可以让标签出现在数据点的旁边。
在数据点下方添加标签
有时候,我们希望标签出现在数据点的下方,以便更清晰地表达数据点的意义。下面是一个示例代码,展示如何在数据点下方添加标签:
import matplotlib.pyplot as plt

x = [1, 2, 3, 4, 5]
y = [2, 3, 5, 7, 6]
labels = ['point1', 'point2', 'point3', 'point4', 'point5']

plt.scatter(x, y)

for i, label in enumerate(labels):
    plt.annotate(label, (x[i], y[i]), xytext=(x[i], y[i]-0.5), ha='center', va='top')

plt.show()
Output:
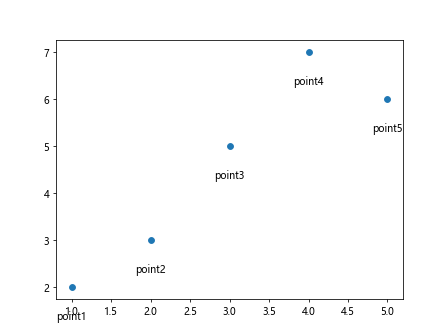
在这段代码中,我们在annotate函数中添加了xytext参数,将标签的位置设置在数据点的下方。同时,我们指定了ha为'center'和va为'top',以确保标签居中显示在数据点下方。
根据条件添加标签
有时候,我们希望根据某些条件来判断是否添加标签。下面是一个示例代码,展示如何根据条件添加标签:
import matplotlib.pyplot as plt

x = [1, 2, 4, 5, 7]
y = [2, 3, 5, 6, 8]
labels = ['point1', 'point2', 'point3', 'point4', 'point5']
conditions = [True, False, True, False, True]

plt.scatter(x, y)

for i, (label, condition) in enumerate(zip(labels, conditions)):
    if condition:
        plt.annotate(label, (x[i], y[i]))

plt.show()
Output:
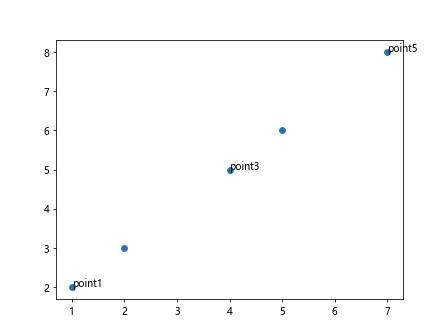
在这段代码中,我们定义了一个conditions列表,表示每个数据点是否需要添加标签。然后在annotate函数中根据条件判断是否添加标签,如果条件为True,则添加相应的标签。
指定标签的旋转角度
有时候,标签的内容比较长,需要对标签进行旋转以适应图表的显示。下面是一个示例代码,展示如何指定标签的旋转角度:
import matplotlib.pyplot as plt

x = [1, 2, 3, 4, 5]
y = [2, 3, 5, 7, 6]
labels = ['point1', 'point2', 'point3 that is long', 'point4', 'point5']

plt.scatter(x, y)

for i, label in enumerate(labels):
    plt.annotate(label, (x[i], y[i]), rotation=45)

plt.show()
Output:
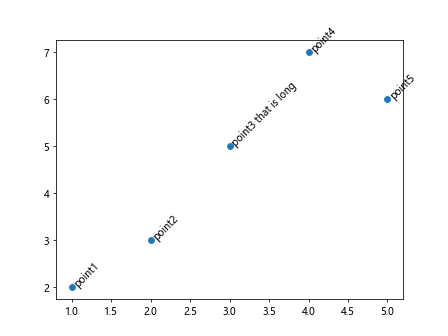
在这段代码中,我们在annotate函数中添加了rotation参数,将标签旋转了45度,这样可以在标签内容比较长时保持可读性。
设置标签的透明度
有时候,我们希望标签的透明度与散点图的透明度相匹配,以使标签看起来更加自然。下面是一个示例代码,展示如何设置标签的透明度:
import matplotlib.pyplot as plt

x = [1, 2, 3, 4, 5]
y = [2, 3, 5, 7, 6]
labels = ['point1', 'point2', 'point3', 'point4', 'point5']

plt.scatter(x, y, alpha=0.5)

for i, label in enumerate(labels):
    plt.annotate(label, (x[i], y[i]), alpha=0.5)

plt.show()
Output:
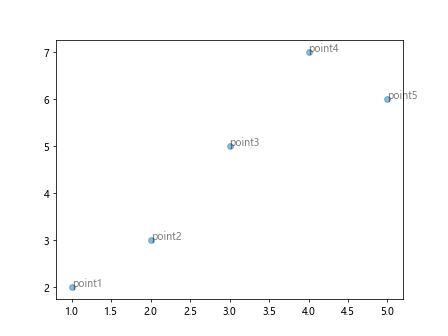
在这段代码中,我们在scatter函数中添加了alpha参数,设置了散点图的透明度为0.5。同时,我们在annotate函数中也添加了alpha参数,并设置标签的透明度为0.5,以保持与散点图的一致性。
在不同轴上添加标签
有时候,我们希望在不同轴上添加标签,比如在x轴和y轴上分别添加标签。下面是一个示例代码,展示如何在不同轴上添加标签:
import matplotlib.pyplot as plt

x = [1, 2, 3, 4, 5]
y = [2, 3, 5, 7, 6]

plt.scatter(x, y)

plt.xlabel('X-axis')
plt.ylabel('Y-axis')

plt.annotate('This is X-axis label', (0.5, -1), xytext=(0.5, -1.5), ha='center', va='top', arrowprops=dict(arrowstyle='->'))
plt.annotate('This is Y-axis label', (-1, 3), xytext=(-1.5, 3), ha='right', va='center', arrowprops=dict(arrowstyle='->'))

plt.show()
Output:
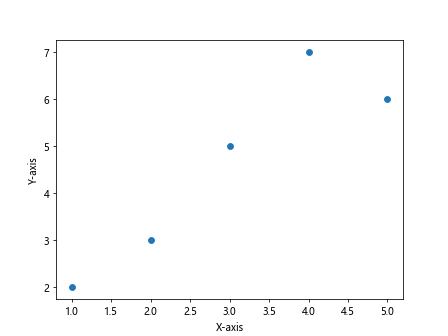
在这段代码中,我们使用xlabel和ylabel函数分别添加了x轴和y轴的标签。然后使用annotate函数在相应位置添加了x轴和y轴的标签,并指定了箭头的方向和样式。
结语
以上便是使用Matplotlib绘制带标签的散点图的一些示例代码。通过这些示例代码,我们学习了如何在散点图中添加标签、调整标签的样式以及根据条件添加标签等功能。
 极客笔记
极客笔记