matplotlib绘制多条线
在数据可视化领域,matplotlib是一个非常强大和灵活的绘图工具。在本文中,我们将介绍如何使用matplotlib绘制多条线。通过绘制多条线,我们可以比较不同数据集之间的关系,展示趋势和模式,以及进行更深入的数据分析和探索。
1. 绘制两条简单的线
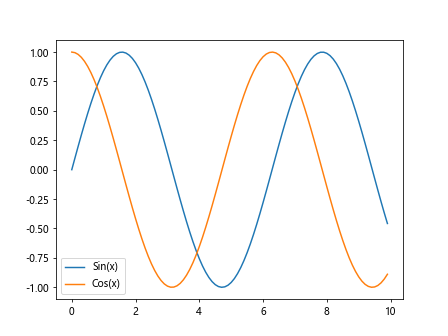
下面是如何使用matplotlib绘制两条简单线的示例代码:
import matplotlib.pyplot as plt
import numpy as np

x = np.arange(0, 10, 0.1)
y1 = np.sin(x)
y2 = np.cos(x)

plt.plot(x, y1, label='Sin(x)')
plt.plot(x, y2, label='Cos(x)')
plt.legend()
plt.show()
Output:
2. 绘制多条线并自定义线的样式
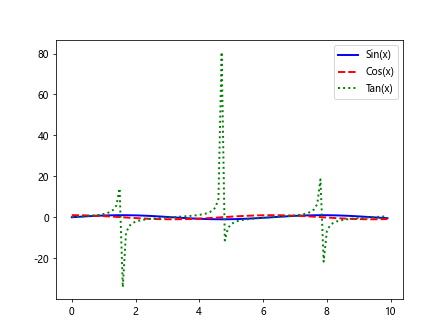
我们还可以自定义线的样式,包括线的颜色、线型和线宽。下面是一个示例代码:
import matplotlib.pyplot as plt
import numpy as np

x = np.arange(0, 10, 0.1)
y1 = np.sin(x)
y2 = np.cos(x)
y3 = np.tan(x)

plt.plot(x, y1, color='blue', linestyle='-', linewidth=2, label='Sin(x)')
plt.plot(x, y2, color='red', linestyle='--', linewidth=2, label='Cos(x)')
plt.plot(x, y3, color='green', linestyle=':', linewidth=2, label='Tan(x)')
plt.legend()
plt.show()
Output:
3. 绘制多条线并设置x轴和y轴的范围
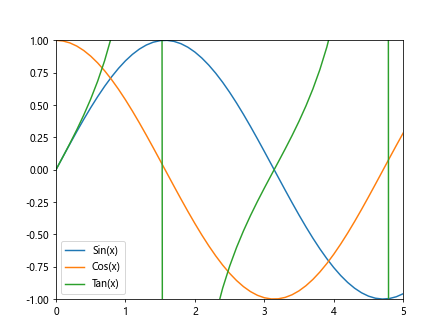
有时候我们需要设置x轴和y轴的范围,以便更好地展示数据。下面是一个示例代码:
import matplotlib.pyplot as plt
import numpy as np

x = np.arange(0, 10, 0.1)
y1 = np.sin(x)
y2 = np.cos(x)
y3 = np.tan(x)

plt.plot(x, y1, label='Sin(x)')
plt.plot(x, y2, label='Cos(x)')
plt.plot(x, y3, label='Tan(x)')
plt.xlim(0, 5)
plt.ylim(-1, 1)
plt.legend()
plt.show()
Output:
4. 绘制多条线并添加标题和标签
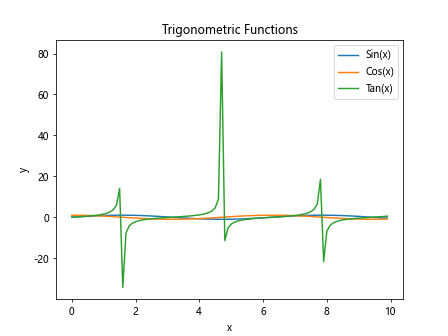
我们还可以为图形添加标题和标签,以便更好地说明数据展示的内容。下面是一个示例代码:
import matplotlib.pyplot as plt
import numpy as np

x = np.arange(0, 10, 0.1)
y1 = np.sin(x)
y2 = np.cos(x)
y3 = np.tan(x)

plt.plot(x, y1, label='Sin(x)')
plt.plot(x, y2, label='Cos(x)')
plt.plot(x, y3, label='Tan(x)')
plt.title('Trigonometric Functions')
plt.xlabel('x')
plt.ylabel('y')
plt.legend()
plt.show()
Output:
5. 绘制多条线并创建子图
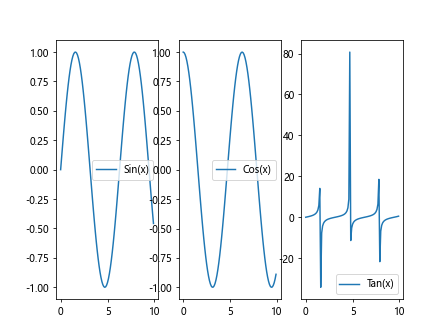
有时候我们希望将多条线分布在不同的子图中,以便比较不同数据的关系。下面是一个示例代码:
import matplotlib.pyplot as plt
import numpy as np

x = np.arange(0, 10, 0.1)
y1 = np.sin(x)
y2 = np.cos(x)
y3 = np.tan(x)

plt.subplot(1, 3, 1)
plt.plot(x, y1, label='Sin(x)')
plt.legend()

plt.subplot(1, 3, 2)
plt.plot(x, y2, label='Cos(x)')
plt.legend()

plt.subplot(1, 3, 3)
plt.plot(x, y3, label='Tan(x)')
plt.legend()

plt.show()
Output:
6. 绘制多条线并设置图例位置
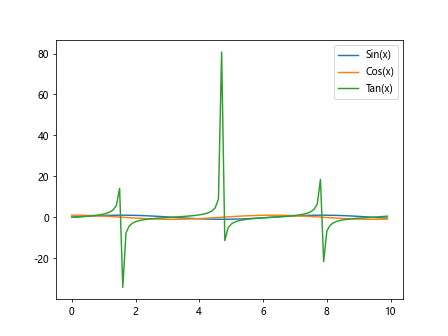
我们可以设置图例的位置,使得图例不会遮挡数据的展示。下面是一个示例代码:
import matplotlib.pyplot as plt
import numpy as np

x = np.arange(0, 10, 0.1)
y1 = np.sin(x)
y2 = np.cos(x)
y3 = np.tan(x)

plt.plot(x, y1, label='Sin(x)')
plt.plot(x, y2, label='Cos(x)')
plt.plot(x, y3, label='Tan(x)')
plt.legend(loc='upper right')
plt.show()
Output:
7. 绘制多条线并修改图例样式
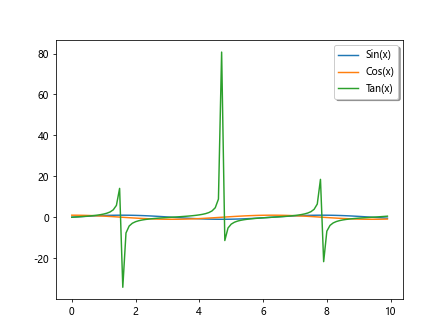
我们还可以修改图例的样式,包括图例的背景色、边框颜色和边框大小等。下面是一个示例代码:
import matplotlib.pyplot as plt
import numpy as np

x = np.arange(0, 10, 0.1)
y1 = np.sin(x)
y2 = np.cos(x)
y3 = np.tan(x)

plt.plot(x, y1, label='Sin(x)')
plt.plot(x, y2, label='Cos(x)')
plt.plot(x, y3, label='Tan(x)')
plt.legend(loc='upper right', fancybox=True, shadow=True, frameon=True, framealpha=1)
plt.show()
Output:
8. 绘制多条线并设置线的标签
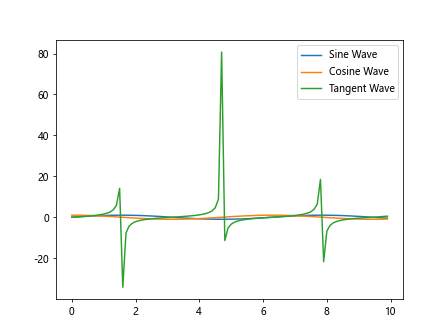
除了图例外,我们还可以为每条线添加标签,以便更清晰地展示数据。下面是一个示例代码:
import matplotlib.pyplot as plt
import numpy as np

x = np.arange(0, 10, 0.1)
y1 = np.sin(x)
y2 = np.cos(x)
y3 = np.tan(x)

plt.plot(x, y1, label='Sine Wave')
plt.plot(x, y2, label='Cosine Wave')
plt.plot(x, y3, label='Tangent Wave')
plt.legend(loc='upper right')
plt.show()
Output:
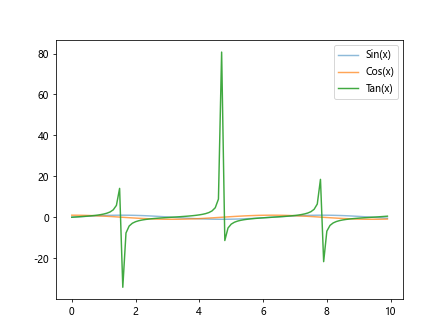
9. 绘制多条线并设置线的透明度
有时候我们希望将不同的线设置不同的透明度,以便更好地展示数据。下面是一个示例代码:
import matplotlib.pyplot as plt
import numpy as np

x = np.arange(0, 10, 0.1)
y1 = np.sin(x)
y2 = np.cos(x)
y3 = np.tan(x)

plt.plot(x, y1, label='Sin(x)', alpha=0.5)
plt.plot(x, y2, label='Cos(x)', alpha=0.7)
plt.plot(x, y3, label='Tan(x)', alpha=0.9)
plt.legend()
plt.show()
Output:
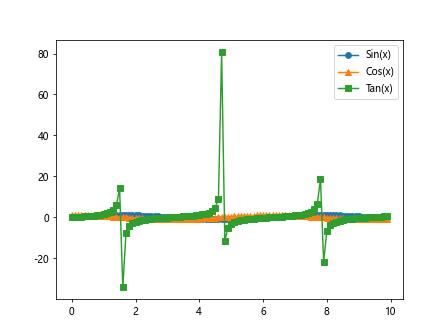
10. 绘制多条线并设置线的标记
我们还可以为每条线的数据点添加标记,以便更好地展示数据的分布。下面是一个示例代码:
import matplotlib.pyplot as plt
import numpy as np

x = np.arange(0, 10, 0.1)
y1 = np.sin(x)
y2 = np.cos(x)
y3 = np.tan(x)

plt.plot(x, y1, label='Sin(x)', marker='o')
plt.plot(x, y2, label='Cos(x)', marker='^')
plt.plot(x, y3, label='Tan(x)', marker='s')
plt.legend()
plt.show()
Output:
以上是关于如何使用matplotlib绘制多条线的示例代码。通过对数据进行可视化,我们可以更好地理解和分析数据,发现数据中隐藏的规律和关系。
 极客笔记
极客笔记