matplotlib pip install
为了使用matplotlib这个强大的Python绘图库,首先需要安装它。本文将详细介绍如何通过pip工具来安装matplotlib库。
安装pip
首先,确保你已经安装了pip工具。如果你使用的是Python 2.7.9或更高版本,或者是Python 3.4或更高版本,那么pip已经自带了。你可以通过在命令行中输入以下命令来检查pip是否已经安装:
pip --version
如果还没有安装pip,你可以通过以下方法安装:
curl https://bootstrap.pypa.io/get-pip.py -o get-pip.py
python get-pip.py
安装matplotlib
一旦确保你已经安装了pip工具,接下来就可以使用pip来安装matplotlib库了。在命令行中输入以下命令:
pip install matplotlib
这个命令将自动下载并安装最新版本的matplotlib库,安装完成后,你就可以开始在Python程序中使用matplotlib来进行数据可视化了。
示例代码
下面是一些使用matplotlib库的示例代码:
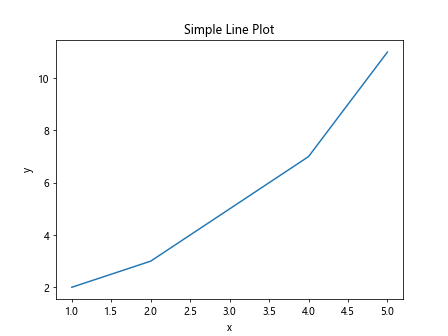
示例1:绘制简单的折线图
import matplotlib.pyplot as plt

x = [1, 2, 3, 4, 5]
y = [2, 3, 5, 7, 11]

plt.plot(x, y)
plt.xlabel('x')
plt.ylabel('y')
plt.title('Simple Line Plot')
plt.show()
Output:
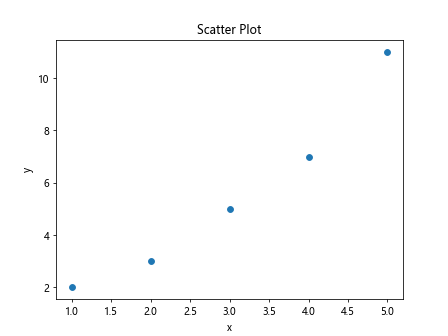
示例2:绘制散点图
import matplotlib.pyplot as plt

x = [1, 2, 3, 4, 5]
y = [2, 3, 5, 7, 11]

plt.scatter(x, y)
plt.xlabel('x')
plt.ylabel('y')
plt.title('Scatter Plot')
plt.show()
Output:
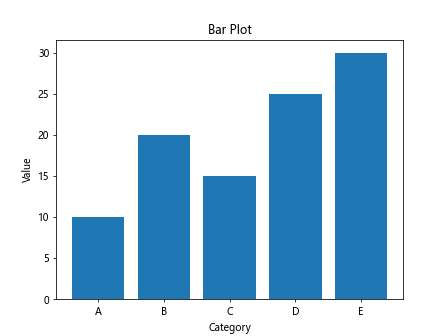
示例3:绘制柱状图
import matplotlib.pyplot as plt

x = ['A', 'B', 'C', 'D', 'E']
y = [10, 20, 15, 25, 30]

plt.bar(x, y)
plt.xlabel('Category')
plt.ylabel('Value')
plt.title('Bar Plot')
plt.show()
Output:
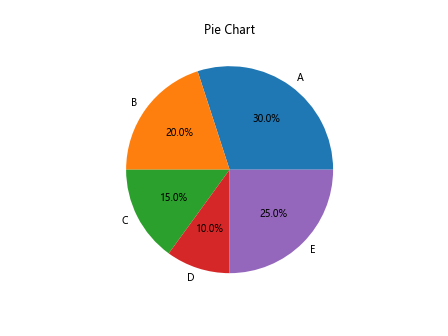
示例4:绘制饼图
import matplotlib.pyplot as plt

sizes = [30, 20, 15, 10, 25]
labels = ['A', 'B', 'C', 'D', 'E']

plt.pie(sizes, labels=labels, autopct='%1.1f%%')
plt.title('Pie Chart')
plt.show()
Output:
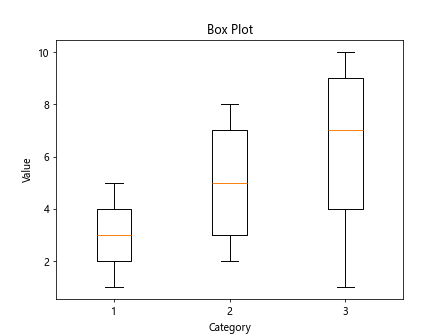
示例5:绘制箱线图
import matplotlib.pyplot as plt

data = [[1, 2, 3, 4, 5], [2, 3, 5, 7, 8], [1, 4, 7, 9, 10]]

plt.boxplot(data)
plt.xlabel('Category')
plt.ylabel('Value')
plt.title('Box Plot')
plt.show()
Output:
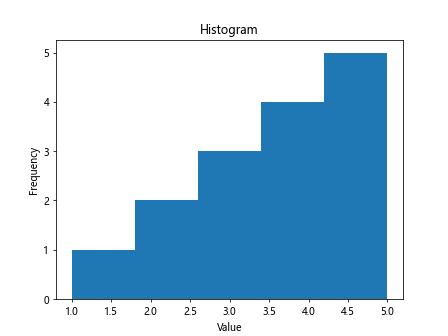
示例6:绘制直方图
import matplotlib.pyplot as plt

data = [1, 2, 2, 3, 3, 3, 4, 4, 4, 4, 5, 5, 5, 5, 5]

plt.hist(data, bins=5)
plt.xlabel('Value')
plt.ylabel('Frequency')
plt.title('Histogram')
plt.show()
Output:
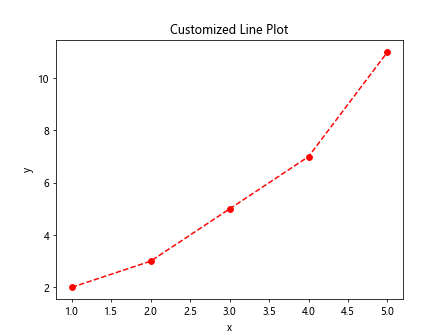
示例7:自定义颜色和线型
import matplotlib.pyplot as plt

x = [1, 2, 3, 4, 5]
y = [2, 3, 5, 7, 11]

plt.plot(x, y, color='r', linestyle='--', marker='o')
plt.xlabel('x')
plt.ylabel('y')
plt.title('Customized Line Plot')
plt.show()
Output:
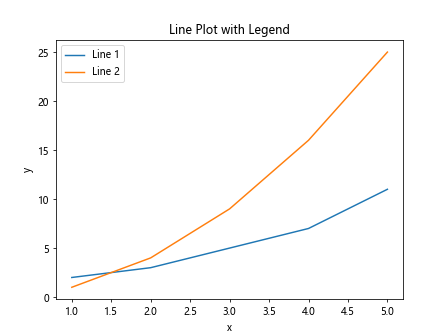
示例8:设置图例
import matplotlib.pyplot as plt

x = [1, 2, 3, 4, 5]
y1 = [2, 3, 5, 7, 11]
y2 = [1, 4, 9, 16, 25]

plt.plot(x, y1, label='Line 1')
plt.plot(x, y2, label='Line 2')
plt.xlabel('x')
plt.ylabel('y')
plt.title('Line Plot with Legend')
plt.legend()
plt.show()
Output:
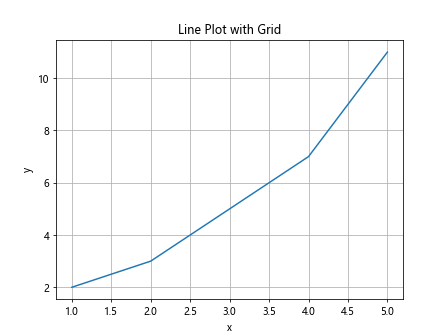
示例9:添加网格线
import matplotlib.pyplot as plt

x = [1, 2, 3, 4, 5]
y = [2, 3, 5, 7, 11]

plt.plot(x, y)
plt.xlabel('x')
plt.ylabel('y')
plt.title('Line Plot with Grid')
plt.grid(True)
plt.show()
Output:
示例10:保存图像
import matplotlib.pyplot as plt

x = [1, 2, 3, 4, 5]
y = [2, 3, 5, 7, 11]

plt.plot(x, y)
plt.xlabel('x')
plt.ylabel('y')
plt.title('Line Plot')
plt.savefig('line_plot.png')
总结
通过pip工具安装matplotlib库非常简单,只需要一条命令即可完成。安装完成后,你可以使用matplotlib库来绘制各种类型的图表,满足不同数据可视化的需求。希望本文能够帮助你顺利安装matplotlib库,并且学会如何使用它来创建精美的图表。
 极客笔记
极客笔记