Matplotlib中使用空心圆形标记:全面指南与实例
参考:matplotlib markers empty circle
Matplotlib是Python中最流行的数据可视化库之一,它提供了丰富的绘图功能,其中包括各种标记样式。本文将深入探讨如何在Matplotlib中使用空心圆形标记(empty circle markers),这是一种常用于散点图和线图的标记类型。我们将通过详细的解释和多个示例代码来展示如何创建、自定义和应用这些标记,以增强您的数据可视化效果。
1. 空心圆形标记的基础知识
在Matplotlib中,空心圆形标记通常用字符’o’表示。这种标记类型常用于散点图,可以清晰地显示数据点的位置,同时不会遮挡其他重要的图形元素。
让我们从一个简单的例子开始:
import matplotlib.pyplot as plt
import numpy as np

x = np.linspace(0, 10, 10)
y = np.sin(x)

plt.figure(figsize=(8, 6))
plt.plot(x, y, marker='o', linestyle='-', color='b', markersize=10, markerfacecolor='none', markeredgecolor='b')
plt.title('How2matplotlib.com: Simple Plot with Empty Circle Markers')
plt.xlabel('X-axis')
plt.ylabel('Y-axis')
plt.grid(True)
plt.show()
Output:
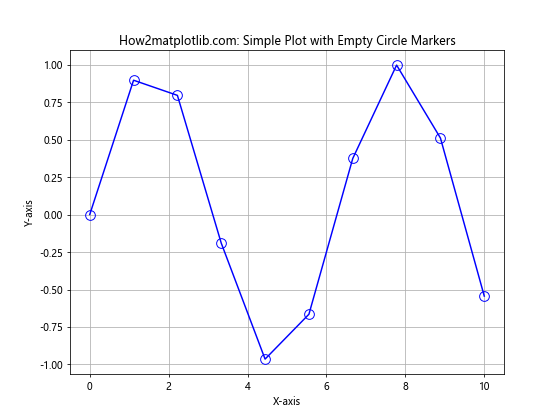
在这个例子中,我们使用marker='o'来指定圆形标记,markerfacecolor='none'使标记内部透明,markeredgecolor='b'设置标记边缘为蓝色。这样就创建了一个带有空心圆形标记的简单正弦曲线图。
2. 自定义空心圆形标记的大小
标记的大小对于图表的可读性至关重要。Matplotlib允许我们轻松调整标记的大小:
import matplotlib.pyplot as plt
import numpy as np

x = np.random.rand(50)
y = np.random.rand(50)

plt.figure(figsize=(10, 6))
sizes = [50, 100, 200, 300, 400]
for i, size in enumerate(sizes):
    plt.scatter(x[i::5], y[i::5], s=size, facecolors='none', edgecolors=f'C{i}', label=f'Size {size}')

plt.title('How2matplotlib.com: Empty Circle Markers with Different Sizes')
plt.xlabel('X-axis')
plt.ylabel('Y-axis')
plt.legend()
plt.grid(True)
plt.show()
Output:
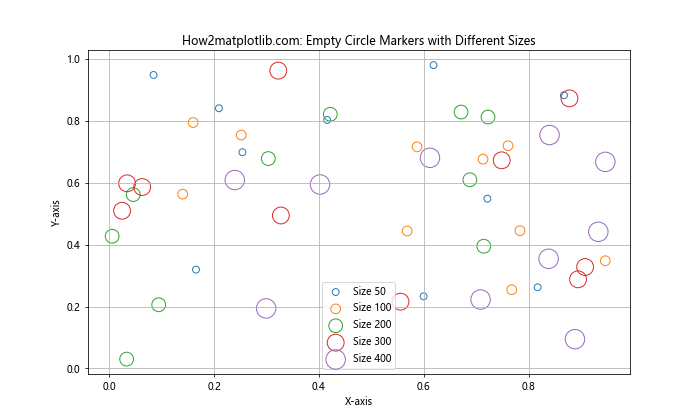
这个例子展示了如何使用不同大小的空心圆形标记。我们使用scatter函数,通过s参数控制标记大小,facecolors='none'使标记内部透明。
3. 调整空心圆形标记的边缘宽度
标记的边缘宽度可以影响其在图表中的视觉效果。以下是如何调整边缘宽度的示例:
import matplotlib.pyplot as plt
import numpy as np

x = np.linspace(0, 10, 5)
y = x ** 2

plt.figure(figsize=(10, 6))
linewidths = [0.5, 1, 2, 3, 4]
for i, lw in enumerate(linewidths):
    plt.plot(x, y + i*10, marker='o', markersize=15, markerfacecolor='none', markeredgecolor=f'C{i}',
             markeredgewidth=lw, linestyle='', label=f'Width {lw}')

plt.title('How2matplotlib.com: Empty Circle Markers with Different Edge Widths')
plt.xlabel('X-axis')
plt.ylabel('Y-axis')
plt.legend()
plt.grid(True)
plt.show()
Output:
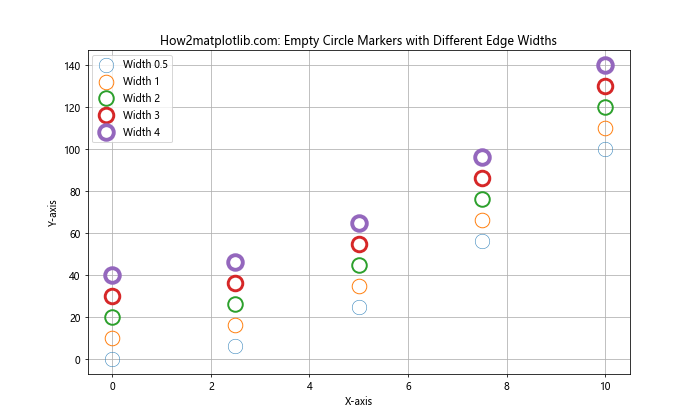
在这个例子中,我们使用markeredgewidth参数来设置不同的边缘宽度,从而创建视觉上有区别的空心圆形标记。
4. 使用不同颜色的空心圆形标记
颜色是区分数据系列的有效方式。下面的例子展示了如何使用不同颜色的空心圆形标记:
import matplotlib.pyplot as plt
import numpy as np

x = np.linspace(0, 10, 50)
y1 = np.sin(x)
y2 = np.cos(x)
y3 = np.tan(x)

plt.figure(figsize=(10, 6))
plt.plot(x, y1, marker='o', markersize=8, markerfacecolor='none', markeredgecolor='r', linestyle='-', label='Sin')
plt.plot(x, y2, marker='o', markersize=8, markerfacecolor='none', markeredgecolor='g', linestyle='-', label='Cos')
plt.plot(x, y3, marker='o', markersize=8, markerfacecolor='none', markeredgecolor='b', linestyle='-', label='Tan')

plt.title('How2matplotlib.com: Multiple Series with Different Colored Empty Circle Markers')
plt.xlabel('X-axis')
plt.ylabel('Y-axis')
plt.legend()
plt.grid(True)
plt.ylim(-5, 5)
plt.show()
Output:
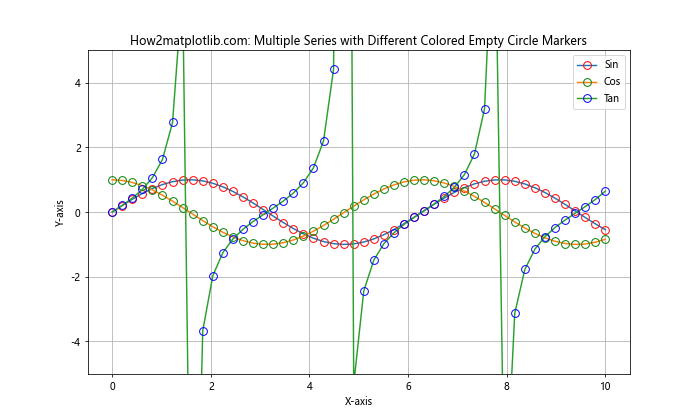
这个例子展示了如何在同一图表中使用不同颜色的空心圆形标记来区分多个数据系列。
5. 结合其他标记类型
有时,将空心圆形标记与其他标记类型结合使用可以增加图表的信息量:
import matplotlib.pyplot as plt
import numpy as np

x = np.linspace(0, 10, 10)
y1 = np.sin(x)
y2 = np.cos(x)

plt.figure(figsize=(10, 6))
plt.plot(x, y1, marker='o', markersize=10, markerfacecolor='none', markeredgecolor='r', linestyle='-', label='Sin (Empty Circle)')
plt.plot(x, y2, marker='s', markersize=10, markerfacecolor='b', linestyle='--', label='Cos (Filled Square)')

plt.title('How2matplotlib.com: Combining Empty Circles with Other Marker Types')
plt.xlabel('X-axis')
plt.ylabel('Y-axis')
plt.legend()
plt.grid(True)
plt.show()
Output:
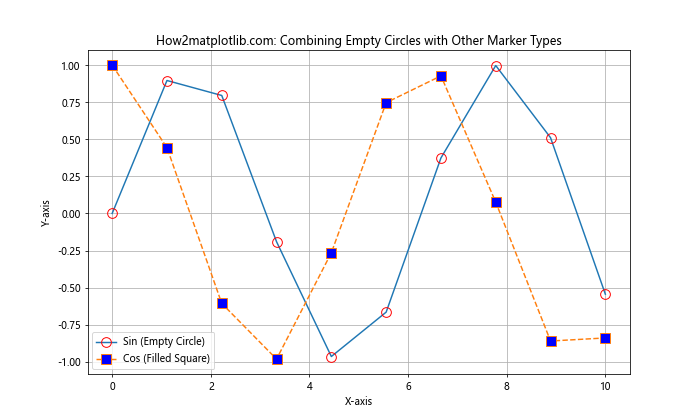
这个例子展示了如何将空心圆形标记与实心方形标记结合使用,以区分不同的数据系列。
6. 在散点图中使用空心圆形标记
散点图是空心圆形标记最常见的应用场景之一:
import matplotlib.pyplot as plt
import numpy as np

np.random.seed(42)
x = np.random.rand(50)
y = np.random.rand(50)
colors = np.random.rand(50)
sizes = 1000 * np.random.rand(50)

plt.figure(figsize=(10, 8))
scatter = plt.scatter(x, y, c=colors, s=sizes, alpha=0.5, cmap='viridis',
                      facecolors='none', edgecolors='black', linewidth=2)

plt.colorbar(scatter)
plt.title('How2matplotlib.com: Scatter Plot with Empty Circle Markers')
plt.xlabel('X-axis')
plt.ylabel('Y-axis')
plt.grid(True)
plt.show()
Output:
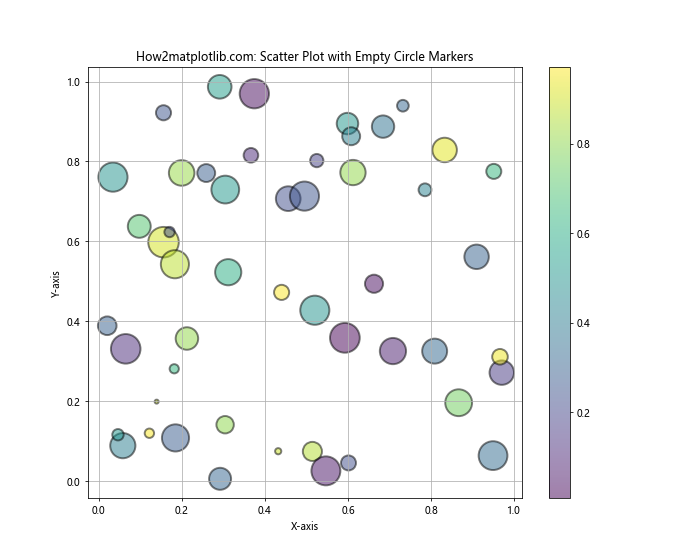
这个例子创建了一个复杂的散点图,使用空心圆形标记来表示数据点,同时利用颜色和大小来编码额外的信息。
7. 在时间序列数据中使用空心圆形标记
空心圆形标记在时间序列数据的可视化中也很有用:
import matplotlib.pyplot as plt
import pandas as pd
import numpy as np

dates = pd.date_range(start='2023-01-01', end='2023-12-31', freq='M')
values = np.cumsum(np.random.randn(12))

plt.figure(figsize=(12, 6))
plt.plot(dates, values, marker='o', markersize=10, markerfacecolor='none',
         markeredgecolor='r', linestyle='-', linewidth=2)

plt.title('How2matplotlib.com: Time Series with Empty Circle Markers')
plt.xlabel('Date')
plt.ylabel('Value')
plt.grid(True)
plt.xticks(rotation=45)
plt.tight_layout()
plt.show()
Output:
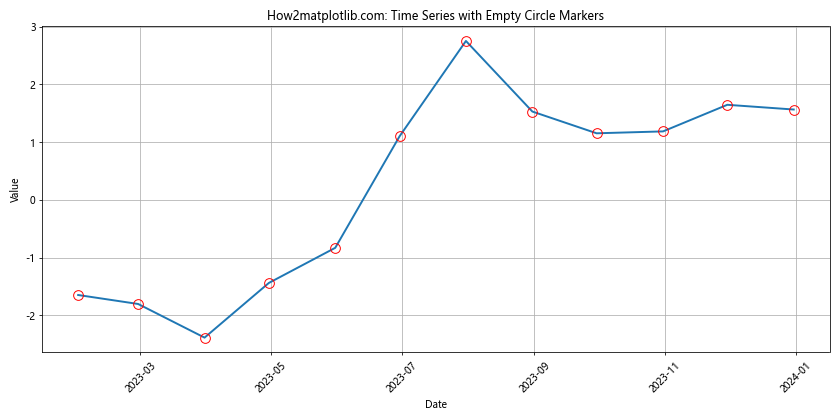
这个例子展示了如何在时间序列数据中使用空心圆形标记,突出显示每个月的数据点。
8. 使用空心圆形标记创建自定义图例
有时,我们可能需要创建自定义图例,其中包含空心圆形标记:
import matplotlib.pyplot as plt
import numpy as np

x = np.linspace(0, 10, 100)
y1 = np.sin(x)
y2 = np.cos(x)

plt.figure(figsize=(10, 6))
plt.plot(x, y1, 'r-')
plt.plot(x, y2, 'b-')

# 创建自定义图例
plt.scatter([], [], c='r', marker='o', s=100, facecolors='none', edgecolors='r', label='Sin (Peak)')
plt.scatter([], [], c='b', marker='o', s=100, facecolors='none', edgecolors='b', label='Cos (Peak)')

# 标记峰值
plt.plot(np.pi/2, 1, 'ro', markersize=10, markerfacecolor='none', markeredgecolor='r')
plt.plot(0, 1, 'bo', markersize=10, markerfacecolor='none', markeredgecolor='b')

plt.title('How2matplotlib.com: Custom Legend with Empty Circle Markers')
plt.xlabel('X-axis')
plt.ylabel('Y-axis')
plt.legend()
plt.grid(True)
plt.show()
Output:
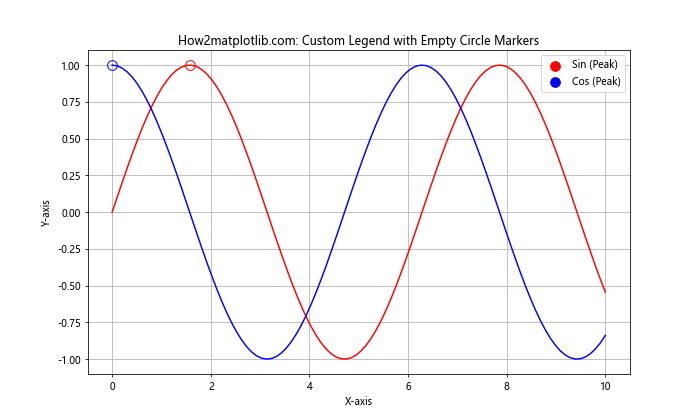
这个例子展示了如何创建一个自定义图例,使用空心圆形标记来表示曲线的峰值点。
9. 在3D图中使用空心圆形标记
空心圆形标记也可以在3D图中使用:
import matplotlib.pyplot as plt
import numpy as np

fig = plt.figure(figsize=(10, 8))
ax = fig.add_subplot(111, projection='3d')

# 生成数据
n = 100
x = np.random.rand(n)
y = np.random.rand(n)
z = np.random.rand(n)

# 绘制散点图
scatter = ax.scatter(x, y, z, c=z, cmap='viridis', s=100, facecolors='none', edgecolors='black', linewidth=1)

ax.set_xlabel('X-axis')
ax.set_ylabel('Y-axis')
ax.set_zlabel('Z-axis')
ax.set_title('How2matplotlib.com: 3D Scatter Plot with Empty Circle Markers')

plt.colorbar(scatter)
plt.show()
Output:
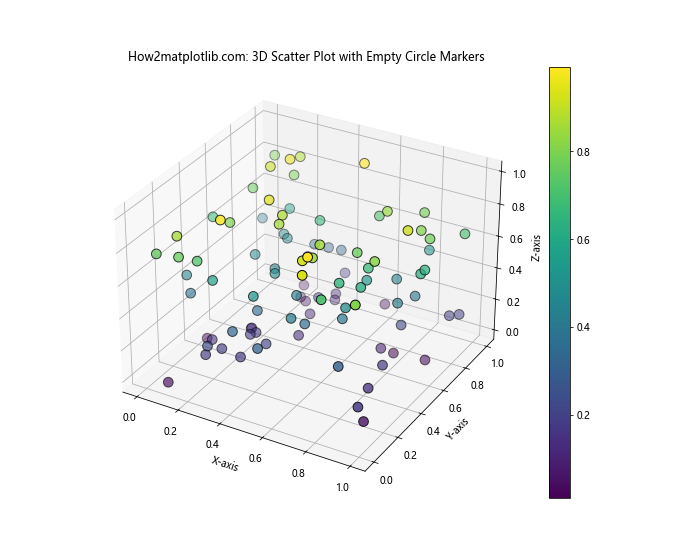
这个例子展示了如何在3D散点图中使用空心圆形标记,为数据点添加深度感。
10. 使用空心圆形标记突出显示异常值
空心圆形标记可以用来突出显示数据集中的异常值:
import matplotlib.pyplot as plt
import numpy as np

np.random.seed(42)
x = np.linspace(0, 10, 100)
y = 2 * x + 1 + np.random.normal(0, 1, 100)

# 添加一些异常值
outliers_x = [2, 5, 8]
outliers_y = [15, 0, 25]

plt.figure(figsize=(10, 6))
plt.scatter(x, y, color='blue', alpha=0.5, label='Normal data')
plt.scatter(outliers_x, outliers_y, s=100, facecolors='none', edgecolors='red',
            linewidth=2, label='Outliers')

plt.title('How2matplotlib.com: Highlighting Outliers with Empty Circle Markers')
plt.xlabel('X-axis')
plt.ylabel('Y-axis')
plt.legend()
plt.grid(True)
plt.show()
Output:
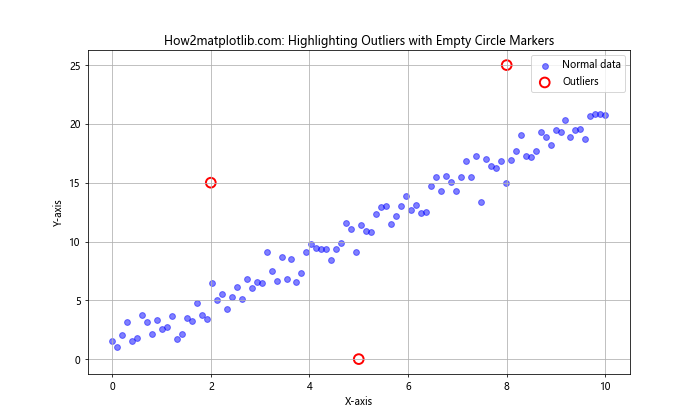
这个例子展示了如何使用大型空心圆形标记来突出显示数据集中的异常值。
11. 在箱线图中使用空心圆形标记
空心圆形标记也可以用于箱线图中表示异常值:
import matplotlib.pyplot as plt
import numpy as np

np.random.seed(42)
data = [np.random.normal(0, std, 100) for std in range(1, 5)]

fig, ax = plt.subplots(figsize=(10, 6))
bp = ax.boxplot(data, patch_artist=True)

for element in ['boxes', 'whiskers', 'fliers', 'means', 'medians', 'caps']:
    plt.setp(bp[element], color='black')

for patch in bp['boxes']:
    patch.set_facecolor('lightblue')

plt.setp(bp['fliers'], marker='o', markersize=10, markerfacecolor='none', markeredgecolor='red')

plt.title('How2matplotlib.com: Box Plot with Empty Circle Markers for Outliers')
plt.xlabel('Groups')
plt.ylabel('Values')
plt.show()
Output:
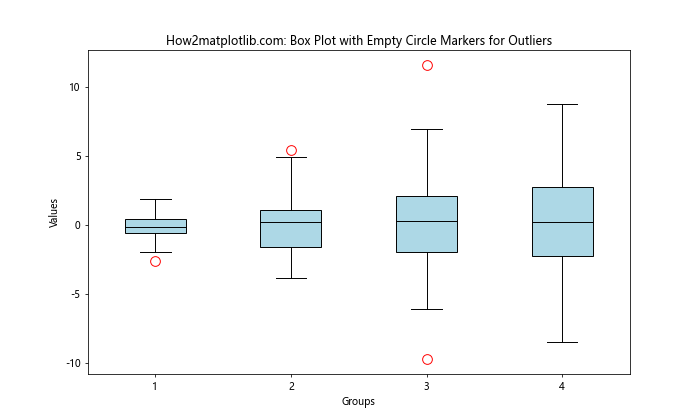
这个例子展示了如何在箱线图中使用空心圆形标记来表示异常值。
12. 使用空心圆形标记创建气泡图
空心圆形标记非常适合用于创建气泡图:
import matplotlib.pyplot as plt
import numpy as np

np.random.seed(42)
x = np.random.rand(20)
y = np.random.rand(20)
sizes = np.random.rand(20) * 1000

plt.figure(figsize=(10, 8))
scatter = plt.scatter(x, y, s=sizes, alpha=0.5, facecolors='none', edgecolors='purple')

plt.title('How2matplotlib.com: Bubble Chart with Empty Circle Markers')
plt.xlabel('X-axis')
plt.ylabel('Y-axis')

# 添加一个图例来解释气泡大小
handles, labels = scatter.legend_elements(prop="sizes", alpha=0.5,
                                          func=lambda s: s/100, num=4)legend = plt.legend(handles, labels, loc="upper right", title="Size")

plt.grid(True)
plt.show()
这个例子展示了如何使用空心圆形标记创建气泡图,其中圆的大小代表了数据的第三个维度。
13. 在极坐标图中使用空心圆形标记
空心圆形标记在极坐标图中也能很好地应用:
import matplotlib.pyplot as plt
import numpy as np

r = np.arange(0, 2, 0.01)
theta = 2 * np.pi * r

fig, ax = plt.subplots(subplot_kw=dict(projection='polar'), figsize=(8, 8))
ax.plot(theta, r, marker='o', markersize=8, markerfacecolor='none', markeredgecolor='blue', linestyle='-')
ax.set_rticks([0.5, 1, 1.5, 2])

plt.title('How2matplotlib.com: Polar Plot with Empty Circle Markers')
plt.show()
Output:
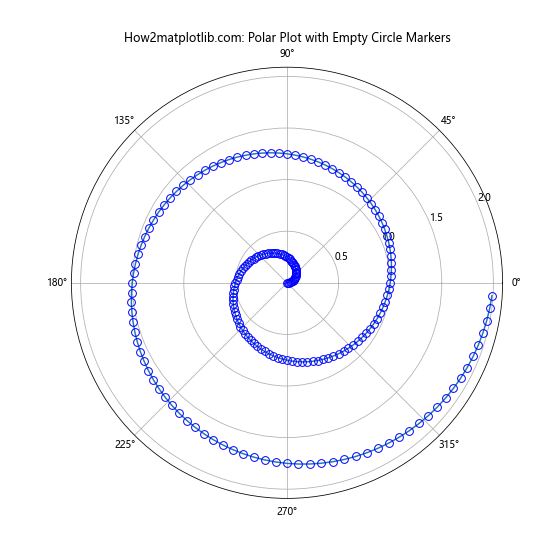
这个例子展示了如何在极坐标系中使用空心圆形标记来可视化螺旋线。
14. 使用空心圆形标记创建星图
空心圆形标记可以用来创建星图(也称为雷达图):
import matplotlib.pyplot as plt
import numpy as np

categories = ['Speed', 'Power', 'Accuracy', 'Durability', 'Cost']
values = [4, 3, 5, 2, 1]

angles = np.linspace(0, 2*np.pi, len(categories), endpoint=False)
values = np.concatenate((values, [values[0]]))  # 闭合多边形
angles = np.concatenate((angles, [angles[0]]))  # 闭合多边形

fig, ax = plt.subplots(figsize=(8, 8), subplot_kw=dict(projection='polar'))
ax.plot(angles, values, 'o-', linewidth=2, markersize=10, markerfacecolor='none', markeredgecolor='red')
ax.fill(angles, values, alpha=0.25)
ax.set_thetagrids(angles[:-1] * 180/np.pi, categories)

plt.title('How2matplotlib.com: Star Plot with Empty Circle Markers')
plt.show()
Output:
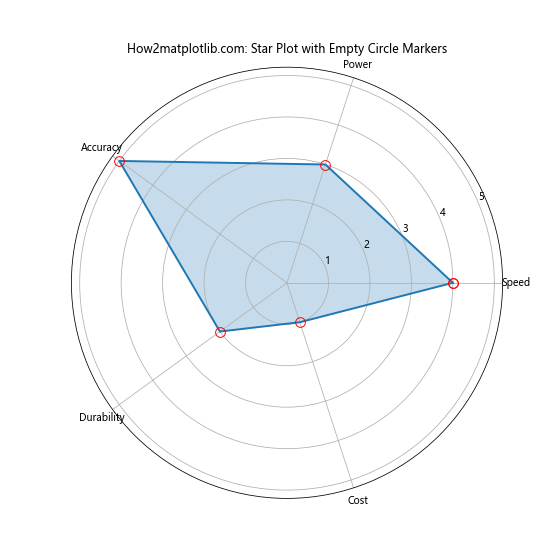
这个例子展示了如何使用空心圆形标记创建星图,用于比较多个类别的数据。
15. 在误差线图中使用空心圆形标记
空心圆形标记在误差线图中也很有用:
import matplotlib.pyplot as plt
import numpy as np

x = np.linspace(0, 10, 10)
y = np.exp(-x/10.0)
error = 0.1 + 0.2 * np.random.rand(len(x))

fig, ax = plt.subplots(figsize=(10, 6))
ax.errorbar(x, y, yerr=error, fmt='o', markersize=8,
            markerfacecolor='none', markeredgecolor='blue',
            ecolor='lightblue', capsize=5)

ax.set_xlabel('X-axis')
ax.set_ylabel('Y-axis')
ax.set_title('How2matplotlib.com: Error Bar Plot with Empty Circle Markers')

plt.grid(True)
plt.show()
Output:
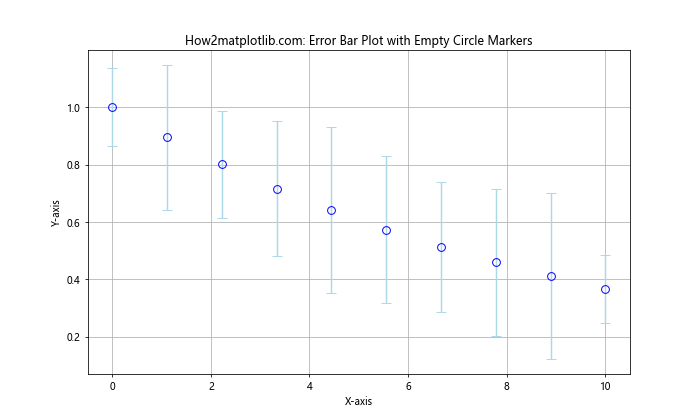
这个例子展示了如何在误差线图中使用空心圆形标记来表示数据点,同时显示误差范围。
16. 使用空心圆形标记创建阶梯图
空心圆形标记可以用来强调阶梯图中的数据点:
import matplotlib.pyplot as plt
import numpy as np

x = np.arange(10)
y = np.random.randint(0, 10, 10)

fig, ax = plt.subplots(figsize=(10, 6))
ax.step(x, y, where='mid', color='green', alpha=0.7)
ax.plot(x, y, 'o', color='green', markerfacecolor='none', markersize=10)

ax.set_xlabel('X-axis')
ax.set_ylabel('Y-axis')
ax.set_title('How2matplotlib.com: Step Plot with Empty Circle Markers')

plt.grid(True)
plt.show()
Output:
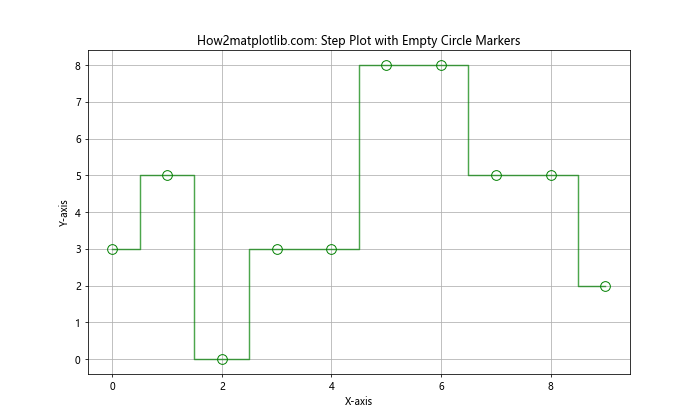
这个例子展示了如何在阶梯图中使用空心圆形标记来强调每个数据点的位置。
17. 在热力图中使用空心圆形标记
虽然热力图通常不使用标记,但我们可以使用空心圆形标记来强调特定的数据点:
import matplotlib.pyplot as plt
import numpy as np

data = np.random.rand(10, 10)
highlighted_points = [(2, 3), (5, 7), (8, 1)]

fig, ax = plt.subplots(figsize=(10, 8))
im = ax.imshow(data, cmap='viridis')

for point in highlighted_points:
    ax.plot(point[1], point[0], 'o', markersize=15, markerfacecolor='none', markeredgecolor='red', markeredgewidth=2)

plt.colorbar(im)
ax.set_title('How2matplotlib.com: Heatmap with Highlighted Points using Empty Circle Markers')
plt.show()
Output:
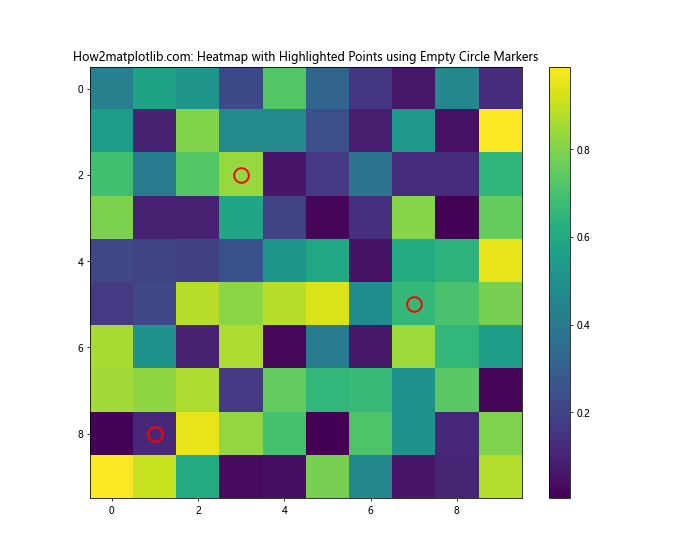
这个例子展示了如何在热力图中使用空心圆形标记来突出显示特定的数据点。
18. 在等高线图中使用空心圆形标记
空心圆形标记可以用来标记等高线图中的特殊点:
import matplotlib.pyplot as plt
import numpy as np

def f(x, y):
    return np.sin(np.sqrt(x ** 2 + y ** 2))

x = np.linspace(-6, 6, 30)
y = np.linspace(-6, 6, 30)
X, Y = np.meshgrid(x, y)
Z = f(X, Y)

fig, ax = plt.subplots(figsize=(10, 8))
cs = ax.contourf(X, Y, Z, cmap='viridis')
ax.contour(X, Y, Z, colors='black', alpha=0.5)

# 标记特殊点
special_points = [(0, 0), (3, 3), (-3, -3)]
for point in special_points:
    ax.plot(point[0], point[1], 'o', markersize=10, markerfacecolor='none', markeredgecolor='red', markeredgewidth=2)

plt.colorbar(cs)
ax.set_title('How2matplotlib.com: Contour Plot with Special Points Marked by Empty Circle Markers')
ax.set_xlabel('X-axis')
ax.set_ylabel('Y-axis')
plt.show()
Output:
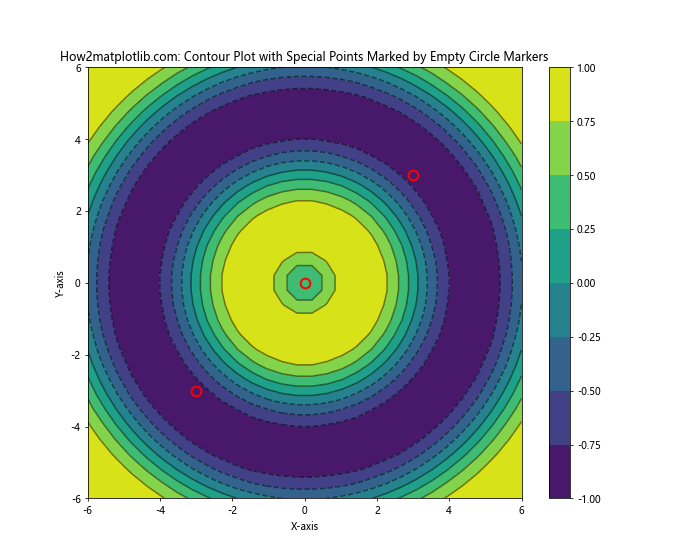
这个例子展示了如何在等高线图中使用空心圆形标记来标记特殊点。
结论
通过以上详细的介绍和多样化的示例,我们全面探讨了如何在Matplotlib中使用空心圆形标记。这种标记类型不仅可以清晰地表示数据点,还能通过调整大小、颜色和边缘宽度来传达额外的信息。从简单的散点图到复杂的3D可视化,空心圆形标记都展现出了其versatility和实用性。
在数据可视化中,选择合适的标记类型和样式对于有效传达信息至关重要。空心圆形标记因其简洁而明确的视觉效果,成为许多数据科学家和分析师的首选。通过本文提供的示例和技巧,您应该能够在自己的数据可视化项目中熟练运用空心圆形标记,创造出既美观又富有信息量的图表。
记住,数据可视化是一门艺术,也是一门科学。不断实践和尝试不同的方法,您将能够找到最适合您数据和目标受众的表现方式。希望本文能为您的Matplotlib之旅提供有价值的指导和灵感。
 极客笔记
极客笔记