如何在matplotlib中设置标记的线宽
参考:matplotlib marker line width
在使用matplotlib绘制图形时,我们经常会使用不同的标记(marker)来表示数据点的样式。除了可以设置标记的形状和颜色外,还可以通过设置标记的线宽(marker line width)来调整标记的边框宽度。在本文中,我们将详细介绍如何在matplotlib中设置标记的线宽,并展示一些示例代码。
设置标记的线宽
要设置标记的线宽,我们可以通过在plot函数中传入”markeredgewidth”参数来实现。该参数的值可以是任意整数或浮点数,表示标记的线宽。默认情况下,标记的线宽为1。
下面是一个简单的示例代码,展示如何设置标记的线宽为2:
import matplotlib.pyplot as plt

x = [1, 2, 3, 4, 5]
y = [2, 3, 5, 7, 11]

plt.plot(x, y, marker='o', markersize=10, markeredgewidth=2)
plt.show()
Output:
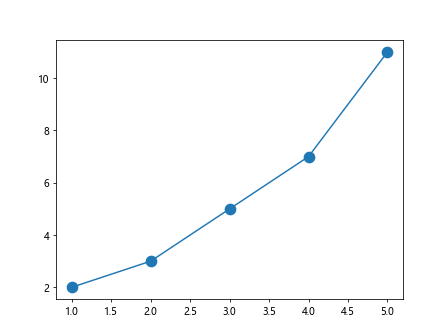
在上面的示例中,我们使用了圆形标记’o’,设置了标记的大小为10,并将标记的线宽设置为2。
示例代码
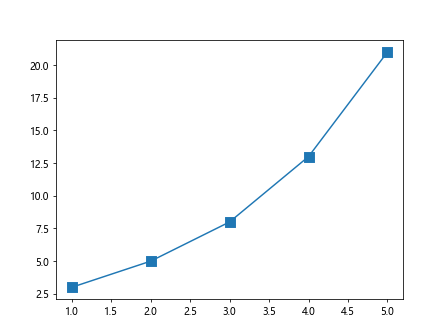
示例1:设置标记的线宽为3
import matplotlib.pyplot as plt

x = [1, 2, 3, 4, 5]
y = [3, 5, 8, 13, 21]

plt.plot(x, y, marker='s', markersize=8, markeredgewidth=3)
plt.show()
Output:
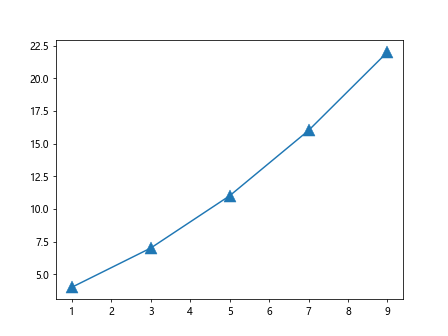
示例2:设置标记的线宽为0.5
import matplotlib.pyplot as plt

x = [1, 3, 5, 7, 9]
y = [4, 7, 11, 16, 22]

plt.plot(x, y, marker='^', markersize=12, markeredgewidth=0.5)
plt.show()
Output:
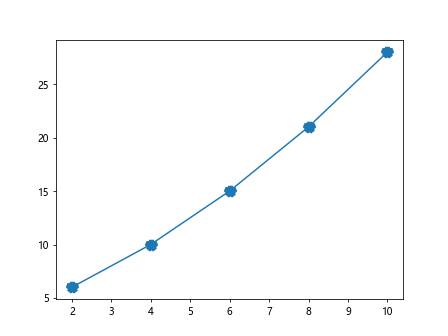
示例3:设置标记的线宽为5
import matplotlib.pyplot as plt

x = [2, 4, 6, 8, 10]
y = [6, 10, 15, 21, 28]

plt.plot(x, y, marker='*', markersize=10, markeredgewidth=5)
plt.show()
Output:
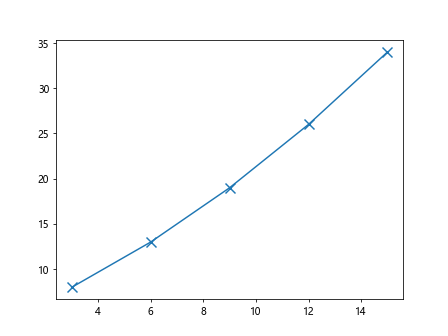
示例4:设置标记的线宽为1.5
import matplotlib.pyplot as plt

x = [3, 6, 9, 12, 15]
y = [8, 13, 19, 26, 34]

plt.plot(x, y, marker='x', markersize=10, markeredgewidth=1.5)
plt.show()
Output:
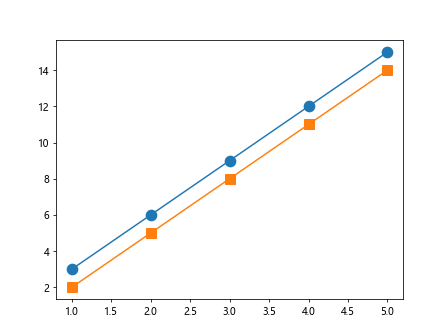
示例5:使用不同的标记形状和线宽
import matplotlib.pyplot as plt

x = [1, 2, 3, 4, 5]
y1 = [3, 6, 9, 12, 15]
y2 = [2, 5, 8, 11, 14]

plt.plot(x, y1, marker='o', markersize=10, markeredgewidth=2)
plt.plot(x, y2, marker='s', markersize=10, markeredgewidth=1)
plt.show()
Output:
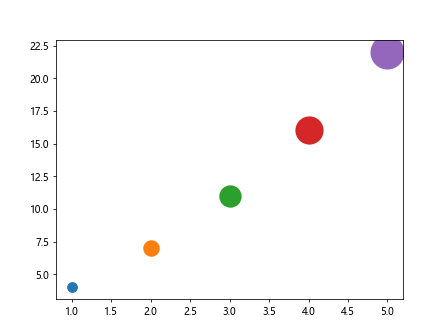
示例6:设置多个数据点的标记线宽
import matplotlib.pyplot as plt

x = [1, 2, 3, 4, 5]
y = [4, 7, 11, 16, 22]
sizes = [10, 15, 20, 25, 30]
widths = [1, 2, 3, 4, 5]

for i in range(len(x)):
    plt.plot(x[i], y[i], marker='o', markersize=sizes[i], markeredgewidth=widths[i])

plt.show()
Output:
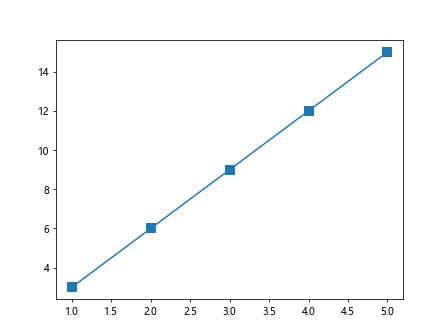
示例7:设置标记的线宽为0
import matplotlib.pyplot as plt

x = [1, 2, 3, 4, 5]
y = [3, 6, 9, 12, 15]

plt.plot(x, y, marker='s', markersize=10, markeredgewidth=0)
plt.show()
Output:
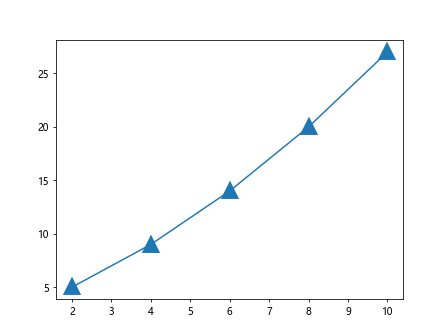
示例8:设置标记的线宽为整数
import matplotlib.pyplot as plt

x = [2, 4, 6, 8, 10]
y = [5, 9, 14, 20, 27]

plt.plot(x, y, marker='^', markersize=12, markeredgewidth=4)
plt.show()
Output:
示例9:设置标记的线宽为浮点数
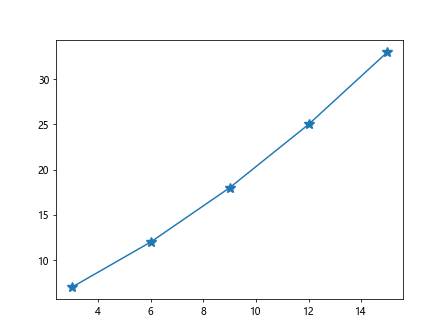
import matplotlib.pyplot as plt

x = [3, 6, 9, 12, 15]
y = [7, 12, 18, 25, 33]

plt.plot(x, y, marker='*', markersize=10, markeredgewidth=1.5)
plt.show()
Output:
示例10:使用多种标记设置不同线宽
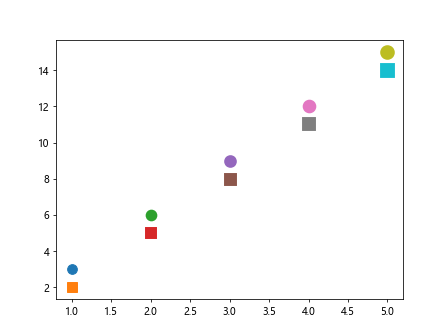
import matplotlib.pyplot as plt

x = [1, 2, 3, 4, 5]
y1 = [3, 6, 9, 12, 15]
y2 = [2, 5, 8, 11, 14]
widths = [1, 2, 3, 4, 5]

for i in range(len(x)):
    plt.plot(x[i], y1[i], marker='o', markersize=10, markeredgewidth=widths[i])
    plt.plot(x[i], y2[i], marker='s', markersize=10, markeredgewidth=widths[i])

plt.show()
Output:
以上是关于如何在matplotlib中设置标记的线宽的介绍和示例代码。通过调整标记的线宽,我们可以更加灵活地定制数据点的外观,使图形更加美观和易于理解。
 极客笔记
极客笔记