Matplotlib中的虚线样式:如何使用和自定义点线
参考:matplotlib linestyle dotted
Matplotlib是Python中最流行的数据可视化库之一,它提供了丰富的绘图功能和样式选项。在绘制线图时,线条的样式是一个重要的视觉元素,可以帮助区分不同的数据系列或强调特定的信息。其中,虚线(dotted line)是一种常用的线条样式,本文将深入探讨如何在Matplotlib中使用和自定义点线样式。
1. 基本概念:什么是虚线?
虚线是由一系列短线段或点组成的线条,与实线相比,它能够在视觉上产生不同的效果。在数据可视化中,虚线通常用于以下几个目的:
- 区分不同的数据系列
- 表示预测或估计的数据
- 标记参考线或辅助线
- 创建视觉层次感
在Matplotlib中,虚线是通过设置线条的linestyle(或简写为ls)参数来实现的。最基本的虚线样式是点线,用字符串':'或'dotted'表示。
让我们从一个简单的例子开始:
import matplotlib.pyplot as plt
import numpy as np

x = np.linspace(0, 10, 100)
y = np.sin(x)

plt.figure(figsize=(8, 6))
plt.plot(x, y, linestyle=':', label='Dotted line')
plt.title('How to use dotted linestyle in Matplotlib - how2matplotlib.com')
plt.xlabel('X-axis')
plt.ylabel('Y-axis')
plt.legend()
plt.grid(True)
plt.show()
Output:
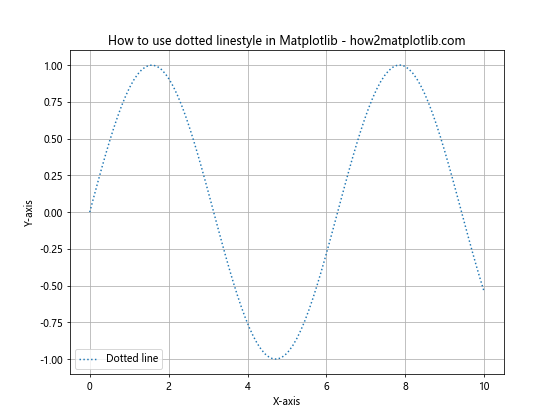
在这个例子中,我们绘制了一条正弦曲线,使用: 作为linestyle参数来创建点线。这是最基本的虚线样式,但Matplotlib还提供了更多的选项和自定义方式。
2. Matplotlib中的预定义虚线样式
Matplotlib提供了几种预定义的虚线样式,可以通过字符串简写或完整名称来指定:
':'或'dotted': 点线'--'或'dashed': 虚线'-.'或'dashdot': 点划线
让我们用一个例子来展示这些不同的样式:
import matplotlib.pyplot as plt
import numpy as np

x = np.linspace(0, 10, 100)
y1 = np.sin(x)
y2 = np.cos(x)
y3 = np.tan(x)

plt.figure(figsize=(10, 6))
plt.plot(x, y1, linestyle=':', label='Dotted')
plt.plot(x, y2, linestyle='--', label='Dashed')
plt.plot(x, y3, linestyle='-.', label='Dashdot')
plt.title('Different linestyles in Matplotlib - how2matplotlib.com')
plt.xlabel('X-axis')
plt.ylabel('Y-axis')
plt.legend()
plt.ylim(-2, 2)  # 限制y轴范围,以便更好地显示
plt.grid(True)
plt.show()
Output:
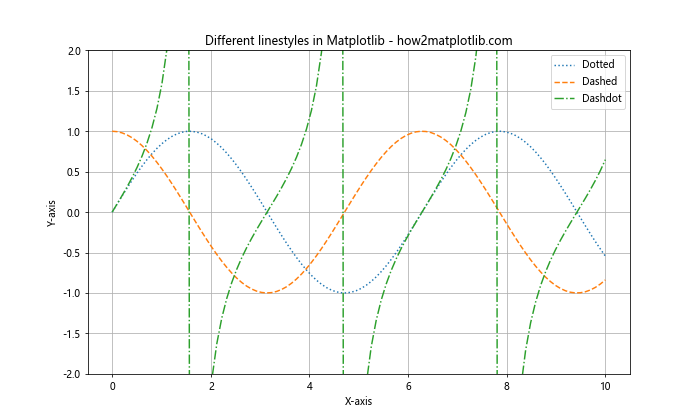
这个例子展示了三种不同的虚线样式,分别用于绘制正弦、余弦和正切函数。通过使用不同的线条样式,我们可以轻松地区分这三条曲线。
3. 自定义虚线样式
除了预定义的样式,Matplotlib还允许我们自定义虚线样式。这可以通过传递一个包含线段和间隔长度的元组来实现。元组中的数字定义了线条的”开-关”模式,其中奇数位置的数字表示线段长度,偶数位置的数字表示间隔长度。
例如,(0, (5, 5))表示一个点线,其中点的长度为0,点之间的间隔为5个单位。让我们看一个自定义虚线样式的例子:
import matplotlib.pyplot as plt
import numpy as np

x = np.linspace(0, 10, 100)
y = np.sin(x)

plt.figure(figsize=(10, 6))
plt.plot(x, y, linestyle=(0, (5, 5)), label='Custom dotted')
plt.title('Custom dotted linestyle in Matplotlib - how2matplotlib.com')
plt.xlabel('X-axis')
plt.ylabel('Y-axis')
plt.legend()
plt.grid(True)
plt.show()
Output:
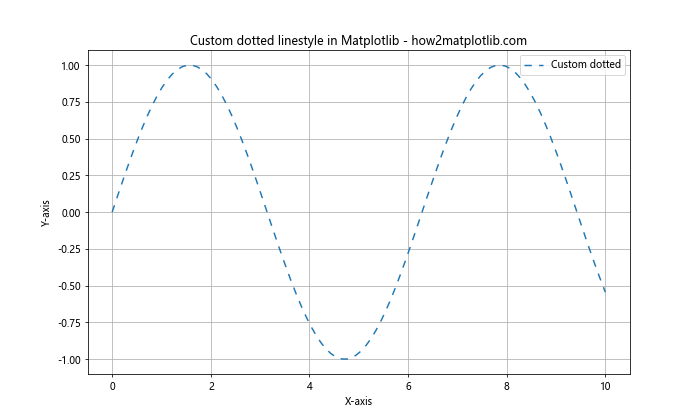
在这个例子中,我们创建了一个自定义的点线样式,点之间的间隔为5个单位。这种方法给了我们更大的灵活性来控制虚线的外观。
4. 调整点线的密度
点线的密度可以通过改变点之间的间隔来调整。让我们创建一个例子,展示不同密度的点线:
import matplotlib.pyplot as plt
import numpy as np

x = np.linspace(0, 10, 100)
y1 = np.sin(x)
y2 = np.sin(x + np.pi/4)
y3 = np.sin(x + np.pi/2)

plt.figure(figsize=(10, 6))
plt.plot(x, y1, linestyle=(0, (1, 1)), label='Dense')
plt.plot(x, y2, linestyle=(0, (5, 5)), label='Medium')
plt.plot(x, y3, linestyle=(0, (10, 10)), label='Sparse')
plt.title('Dotted lines with different densities - how2matplotlib.com')
plt.xlabel('X-axis')
plt.ylabel('Y-axis')
plt.legend()
plt.grid(True)
plt.show()
Output:
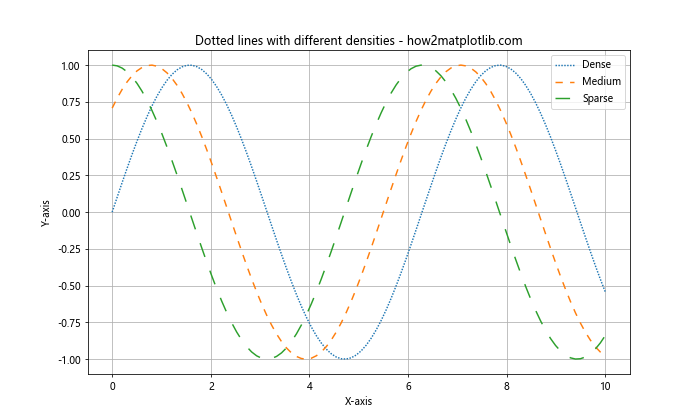
在这个例子中,我们创建了三条正弦曲线,每条曲线使用不同密度的点线。通过调整元组中的数值,我们可以控制点之间的间隔,从而改变点线的密度。
5. 结合其他线条属性
虚线样式可以与其他线条属性结合使用,如颜色、线宽等。这允许我们创建更丰富的视觉效果。让我们看一个例子:
import matplotlib.pyplot as plt
import numpy as np

x = np.linspace(0, 10, 100)
y1 = np.sin(x)
y2 = np.cos(x)

plt.figure(figsize=(10, 6))
plt.plot(x, y1, linestyle=':', color='red', linewidth=2, label='Red dotted')
plt.plot(x, y2, linestyle=':', color='blue', linewidth=3, label='Blue dotted')
plt.title('Dotted lines with different colors and widths - how2matplotlib.com')
plt.xlabel('X-axis')
plt.ylabel('Y-axis')
plt.legend()
plt.grid(True)
plt.show()
Output:
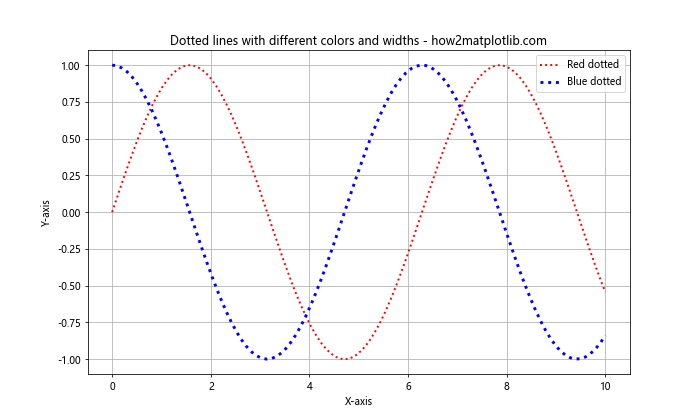
在这个例子中,我们绘制了两条点线,分别使用不同的颜色和线宽。这种组合可以帮助我们创建更具区分度的图表。
6. 在散点图中使用点线连接
虽然点线通常用于线图,但它们也可以用于连接散点图中的点。这在显示数据点之间的趋势时特别有用。让我们看一个例子:
import matplotlib.pyplot as plt
import numpy as np

x = np.linspace(0, 10, 20)
y = np.sin(x) + np.random.normal(0, 0.1, 20)

plt.figure(figsize=(10, 6))
plt.plot(x, y, 'o', linestyle=':', markersize=8, label='Data points')
plt.title('Scattered data points connected with dotted line - how2matplotlib.com')
plt.xlabel('X-axis')
plt.ylabel('Y-axis')
plt.legend()
plt.grid(True)
plt.show()
Output:
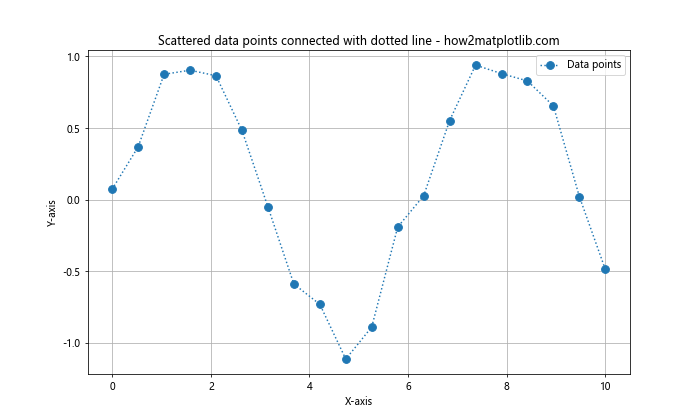
在这个例子中,我们创建了一些带有随机噪声的数据点,然后用点线连接它们。这种方法可以同时显示individual数据点和整体趋势。
7. 在子图中使用不同的点线样式
当我们需要在一个图形中比较多个数据集时,使用子图是一个好方法。我们可以在每个子图中使用不同的点线样式来增加可读性。让我们看一个例子:
import matplotlib.pyplot as plt
import numpy as np

x = np.linspace(0, 10, 100)
y1 = np.sin(x)
y2 = np.cos(x)

fig, (ax1, ax2) = plt.subplots(2, 1, figsize=(10, 8))

ax1.plot(x, y1, linestyle=':', color='red')
ax1.set_title('Sine wave with dotted line - how2matplotlib.com')
ax1.set_xlabel('X-axis')
ax1.set_ylabel('Y-axis')
ax1.grid(True)

ax2.plot(x, y2, linestyle=(0, (5, 2)), color='blue')
ax2.set_title('Cosine wave with custom dotted line - how2matplotlib.com')
ax2.set_xlabel('X-axis')
ax2.set_ylabel('Y-axis')
ax2.grid(True)

plt.tight_layout()
plt.show()
Output:
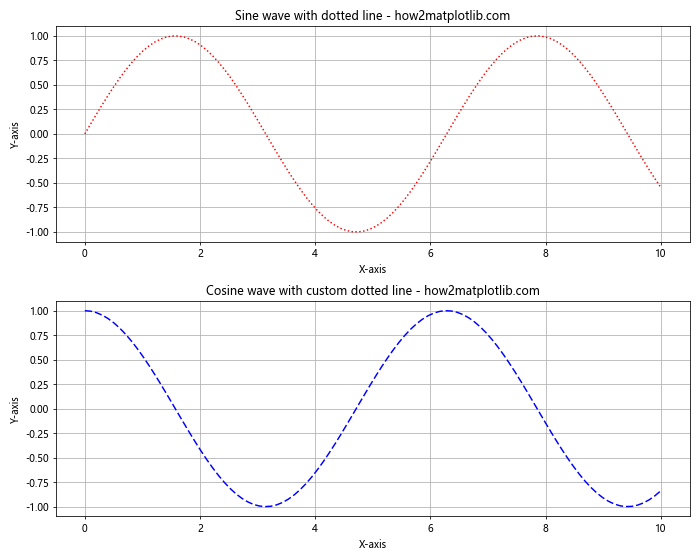
在这个例子中,我们创建了两个子图,一个使用标准的点线样式,另一个使用自定义的点线样式。这种方法允许我们在同一个图形中比较不同的数据集和线条样式。
8. 使用点线绘制误差范围
点线也可以用来表示数据的误差范围或置信区间。这在科学和统计可视化中特别有用。让我们看一个例子:
import matplotlib.pyplot as plt
import numpy as np

x = np.linspace(0, 10, 50)
y = np.sin(x) + np.random.normal(0, 0.1, 50)
error = 0.2 + 0.1 * np.random.random(50)

plt.figure(figsize=(10, 6))
plt.errorbar(x, y, yerr=error, fmt='o', linestyle=':', capsize=5, label='Data with error')
plt.title('Data points with error bars using dotted lines - how2matplotlib.com')
plt.xlabel('X-axis')
plt.ylabel('Y-axis')
plt.legend()
plt.grid(True)
plt.show()
Output:
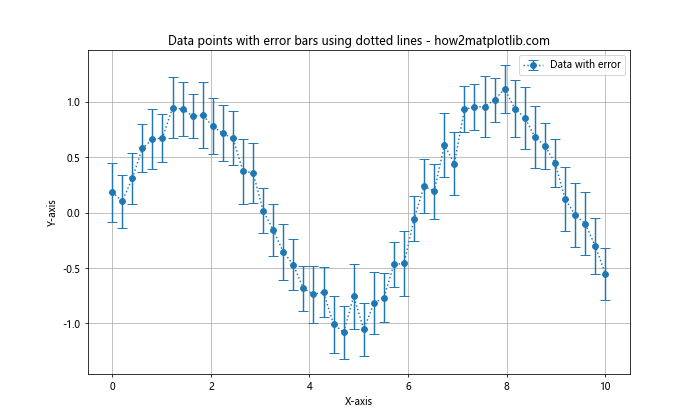
在这个例子中,我们使用errorbar函数绘制了带有误差棒的数据点,并使用点线连接这些点。这种方法可以清晰地显示数据的不确定性。
9. 在填充区域中使用点线边界
点线不仅可以用于绘制线条,还可以用作填充区域的边界。这在显示数据范围或比较不同数据集时非常有用。让我们看一个例子:
import matplotlib.pyplot as plt
import numpy as np

x = np.linspace(0, 10, 100)
y1 = np.sin(x)
y2 = np.sin(x) + 0.5

plt.figure(figsize=(10, 6))
plt.fill_between(x, y1, y2, alpha=0.3, label='Filled area')
plt.plot(x, y1, linestyle=':', color='red', label='Lower bound')
plt.plot(x, y2, linestyle=':', color='blue', label='Upper bound')
plt.title('Filled area with dotted line boundaries - how2matplotlib.com')
plt.xlabel('X-axis')
plt.ylabel('Y-axis')
plt.legend()
plt.grid(True)
plt.show()
Output:
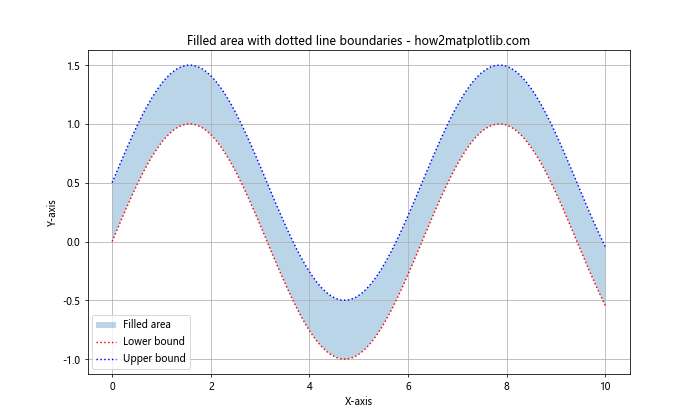
在这个例子中,我们使用fill_between函数填充了两条正弦曲线之间的区域,并使用点线绘制了上下边界。这种方法可以有效地显示数据的范围或变化。
10. 在极坐标图中使用点线
点线样式不仅限于笛卡尔坐标系,它们也可以在极坐标图中使用。这在绘制周期性数据或角度相关的数据时特别有用。让我们看一个例子:
import matplotlib.pyplot as plt
import numpy as np

theta = np.linspace(0, 2*np.pi, 100)
r = np.sin(4*theta)

plt.figure(figsize=(8, 8))
ax = plt.subplot(111, projection='polar')
ax.plot(theta, r, linestyle=':', linewidth=2)
ax.set_title('Polar plot with dotted line - how2matplotlib.com')
plt.show()
Output:
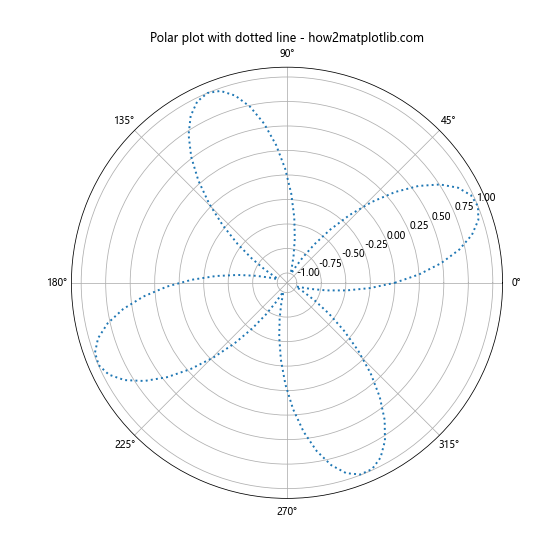
在这个例子中,我们在极坐标系中绘制了一个四叶玫瑰线,使用点线样式。这种方法可以在保持极坐标图特性的同时,增加图形的可读性。
11. 使用点线绘制网格
除了用于数据线,点线还可以用于绘制网格线。这可以帮助读者更容易地解读图表中的数据。让我们看一个例子:
import matplotlib.pyplot as plt
import numpy as np

x = np.linspace(0, 10, 100)
y = np.sin(x)

plt.figure(figsize=(10, 6))
plt.plot(x, y, label='Sine wave')
plt.title('Plot with dotted grid lines - how2matplotlib.com')
plt.xlabel('X-axis')
plt.ylabel('Y-axis')
plt.legend()
plt.grid(True, linestyle=':', color='gray', alpha=0.5)
plt.show()
Output:
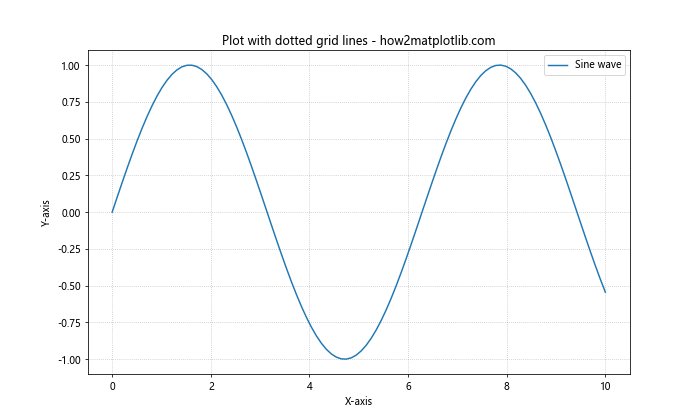
在这个例子中,我们使用grid函数添加了点线样式的网格。通过调整颜色和透明度,我们可以创建一个不会干扰主要数据线的subtle网格。
12. 在箱线图中使用点线
点线样式也可以应用于统计图表,如箱线图。这可以帮助区分不同的数据组或强调特定的统计特征。让我们看一个例子:
import matplotlib.pyplot as plt
import numpy as np

data = [np.random.normal(0, std, 100) for std in range(1, 4)]

fig, ax = plt.subplots(figsize=(10, 6))
bp = ax.boxplot(data, patch_artist=True)

for median in bp['medians']:
    median.set(color='red', linewidth=2, linestyle=':')

plt.title('Boxplot with dotted median lines - how2matplotlib.com')
plt.xlabel('Groups')
plt.ylabel('Values')
plt.show()
Output:
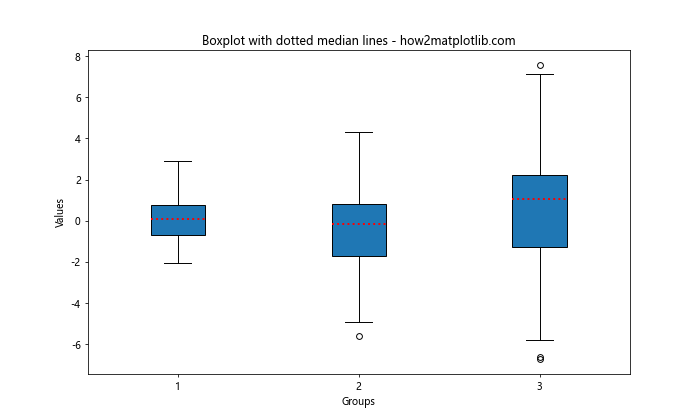
在这个例子中,我们创建了一个箱线图,并将中位数线的样式设置为红色点线。这种方法可以突出显示中位数,使其更容易被识别。
13. 在时间序列图中使用点线
点线在时间序列数据的可视化中也很有用,特别是当我们想要区分不同时间段或强调某些时间点时。让我们看一个例子:
import matplotlib.pyplot as plt
import numpy as np
import pandas as pd

dates = pd.date_range(start='2023-01-01', end='2023-12-31', freq='D')
values = np.cumsum(np.random.randn(len(dates)))

plt.figure(figsize=(12, 6))
plt.plot(dates, values, linestyle=':')
plt.axvline(x=pd.Timestamp('2023-07-01'), color='red', linestyle='--', label='Mid-year')
plt.title('Time series with dotted line and reference line - how2matplotlib.com')
plt.xlabel('Date')
plt.ylabel('Cumulative Value')
plt.legend()
plt.grid(True)
plt.show()
Output:
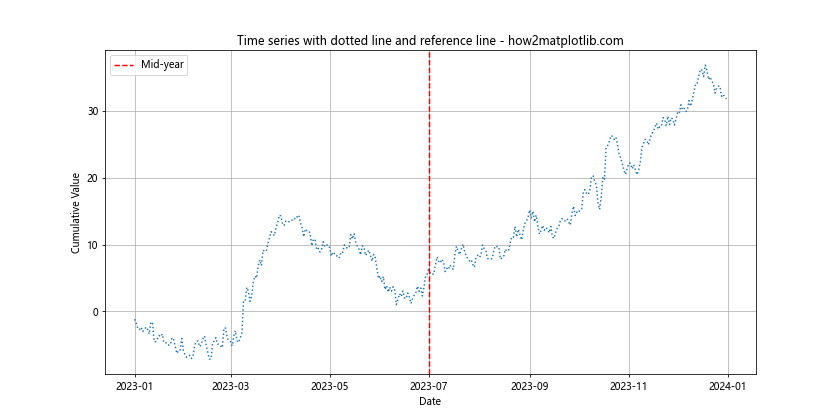
在这个例子中,我们使用点线绘制了一个时间序列数据,并添加了一条虚线来标记年中点。这种组合可以帮助读者更好地理解数据的时间趋势和重要时间点。
14. 在3D图中使用点线
点线样式也可以应用于3D图形,为复杂的三维数据可视化添加更多的层次感。让我们看一个例子:
import matplotlib.pyplot as plt
import numpy as np

fig = plt.figure(figsize=(10, 8))
ax = fig.add_subplot(111, projection='3d')

theta = np.linspace(-4 * np.pi, 4 * np.pi, 100)
z = np.linspace(-2, 2, 100)
r = z**2 + 1
x = r * np.sin(theta)
y = r * np.cos(theta)

ax.plot(x, y, z, linestyle=':', label='Parametric curve')
ax.set_title('3D plot with dotted line - how2matplotlib.com')
ax.set_xlabel('X-axis')
ax.set_ylabel('Y-axis')
ax.set_zlabel('Z-axis')
ax.legend()
plt.show()
Output:
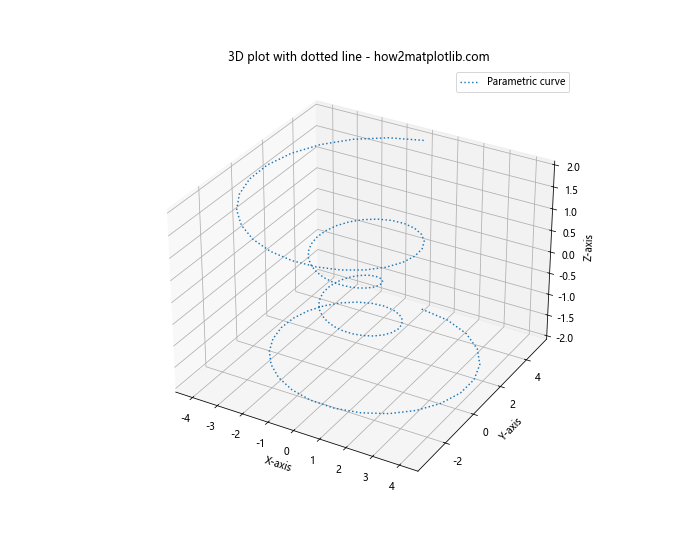
在这个例子中,我们创建了一个3D参数曲线,并使用点线样式来绘制它。这种方法可以在保持3D效果的同时,增加曲线的可读性。
15. 使用点线创建自定义图例
点线样式也可以用于创建自定义的图例,这在需要解释复杂图表或多个数据系列时特别有用。让我们看一个例子:
import matplotlib.pyplot as plt
import numpy as np

x = np.linspace(0, 10, 100)
y1 = np.sin(x)
y2 = np.cos(x)

plt.figure(figsize=(10, 6))
plt.plot(x, y1, label='Sine')
plt.plot(x, y2, label='Cosine')

# 创建自定义图例
plt.plot([], [], color='red', linestyle=':', label='Important region')
plt.axvspan(4, 6, alpha=0.2, color='red')

plt.title('Custom legend with dotted line - how2matplotlib.com')
plt.xlabel('X-axis')
plt.ylabel('Y-axis')
plt.legend()
plt.grid(True)
plt.show()
Output:
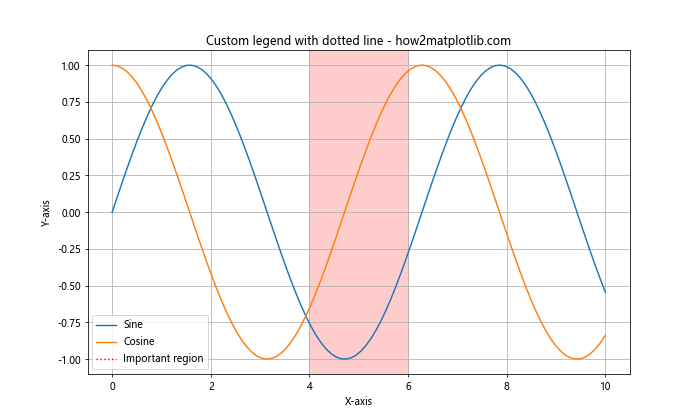
在这个例子中,我们不仅绘制了正弦和余弦曲线,还添加了一个自定义的图例项,使用点线来表示重要区域。这种方法可以帮助我们解释图表中的特殊元素或区域。
16. 在热图中使用点线边界
虽然热图主要使用颜色来表示数据,但我们可以使用点线来强调某些单元格或区域。这在需要突出显示特定数据点或模式时非常有用。让我们看一个例子:
import matplotlib.pyplot as plt
import numpy as np

data = np.random.rand(10, 10)
mask = np.zeros_like(data)
mask[2:5, 2:5] = True

plt.figure(figsize=(10, 8))
plt.imshow(data, cmap='viridis')
plt.colorbar()

# 使用点线标记特定区域
for i in range(10):
    for j in range(10):
        if mask[i, j]:
            plt.plot([j-0.5, j+0.5, j+0.5, j-0.5, j-0.5],
                     [i-0.5, i-0.5, i+0.5, i+0.5, i-0.5],
                     linestyle=':', color='white')

plt.title('Heatmap with dotted line boundaries - how2matplotlib.com')
plt.xlabel('X-axis')
plt.ylabel('Y-axis')
plt.show()
Output:
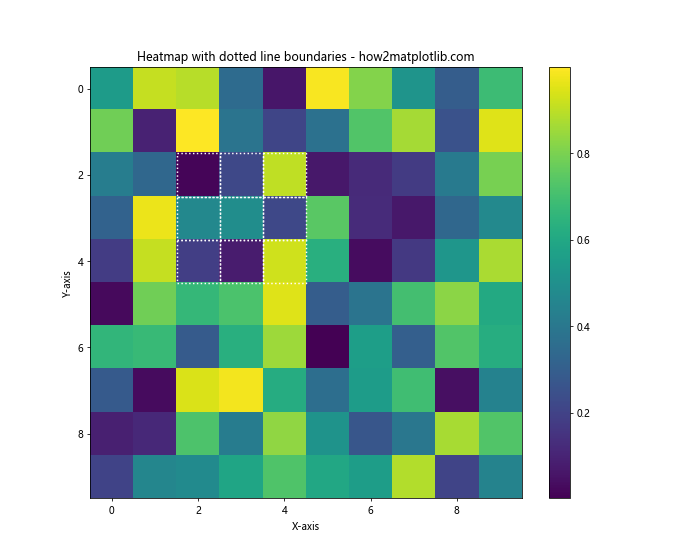
在这个例子中,我们创建了一个热图,并使用白色点线标记了特定的区域。这种方法可以在保持热图整体效果的同时,突出显示感兴趣的区域。
17. 在等高线图中使用点线
点线样式也可以应用于等高线图,用于区分不同级别的等高线或强调特定的等高线。让我们看一个例子:
import matplotlib.pyplot as plt
import numpy as np

x = np.linspace(-3, 3, 100)
y = np.linspace(-3, 3, 100)
X, Y = np.meshgrid(x, y)
Z = np.sin(X) * np.cos(Y)

plt.figure(figsize=(10, 8))
CS = plt.contour(X, Y, Z, levels=10, linestyles=['-', ':'])
plt.clabel(CS, inline=True, fontsize=10)
plt.title('Contour plot with alternating solid and dotted lines - how2matplotlib.com')
plt.xlabel('X-axis')
plt.ylabel('Y-axis')
plt.colorbar(CS)
plt.show()
Output:
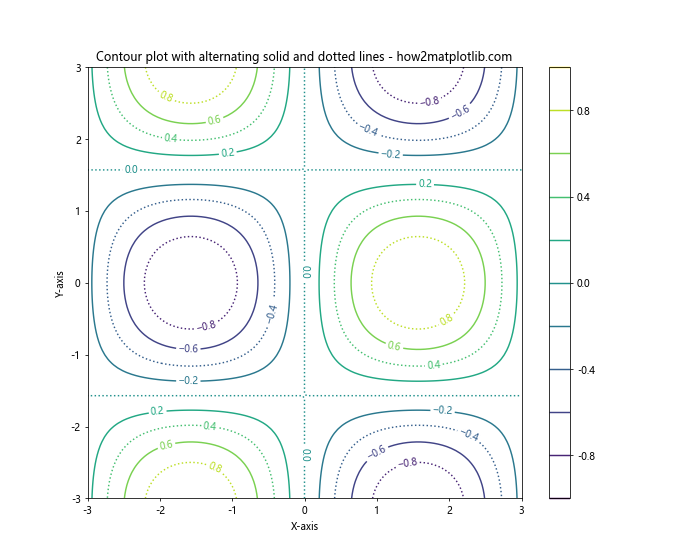
在这个例子中,我们创建了一个等高线图,其中交替使用实线和点线来表示不同的等高线。这种方法可以增加等高线图的可读性,使不同级别的等高线更容易区分。
18. 在饼图中使用点线边界
虽然饼图通常使用实线边界,但使用点线可以创造出独特的视觉效果,特别是当我们想要强调某些扇区时。让我们看一个例子:
import matplotlib.pyplot as plt

sizes = [30, 20, 25, 15, 10]
labels = ['A', 'B', 'C', 'D', 'E']
explode = (0.1, 0, 0, 0, 0)  # 突出显示第一个扇区

plt.figure(figsize=(10, 8))
plt.pie(sizes, explode=explode, labels=labels, autopct='%1.1f%%',
        shadow=True, startangle=90, wedgeprops={'linestyle': ':'})
plt.title('Pie chart with dotted line boundaries - how2matplotlib.com')
plt.axis('equal')  # 保持饼图为圆形
plt.show()
Output:
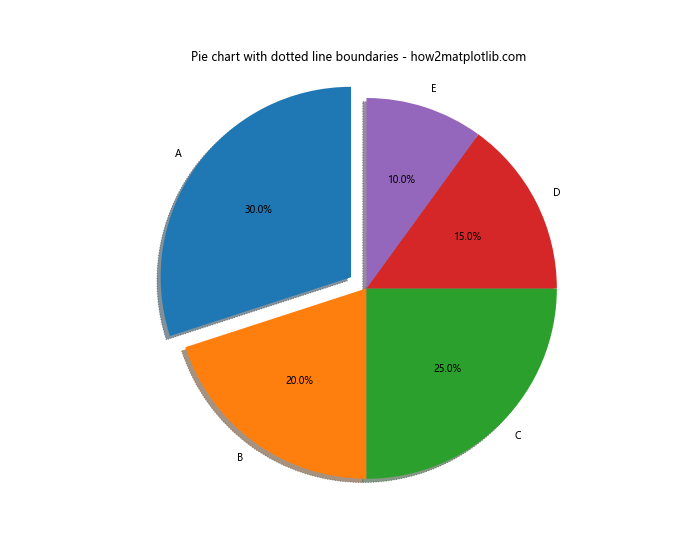
在这个例子中,我们创建了一个饼图,并将所有扇区的边界设置为点线样式。这种方法可以创造出一种独特的视觉效果,同时保持饼图的清晰度和可读性。
19. 在极坐标条形图中使用点线
点线样式也可以应用于极坐标条形图,这种图表通常用于显示周期性数据或角度分布。让我们看一个例子:
import matplotlib.pyplot as plt
import numpy as np

N = 8
theta = np.linspace(0.0, 2 * np.pi, N, endpoint=False)
radii = 10 * np.random.rand(N)
width = np.pi / 4 * np.random.rand(N)

plt.figure(figsize=(10, 10))
ax = plt.subplot(111, projection='polar')
bars = ax.bar(theta, radii, width=width, bottom=0.0)

for bar in bars:
    bar.set_edgecolor('black')
    bar.set_linestyle(':')

ax.set_title('Polar bar plot with dotted line edges - how2matplotlib.com')
plt.show()
Output:
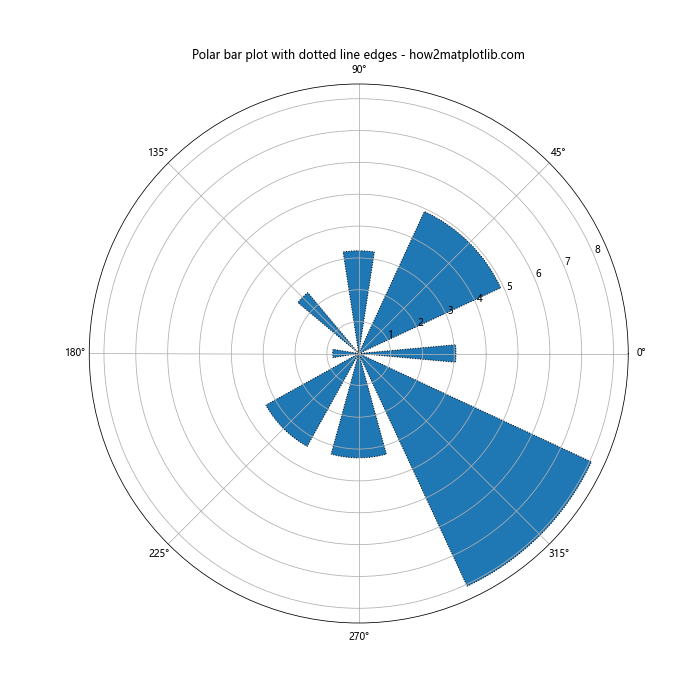
在这个例子中,我们创建了一个极坐标条形图,并将每个条形的边缘设置为黑色点线。这种方法可以增加图表的视觉吸引力,同时保持数据的清晰表示。
20. 在误差椭圆中使用点线
在统计分析和数据可视化中,误差椭圆常用于表示二维数据的不确定性。使用点线可以使这些椭圆更加突出,而不会干扰主要的数据点。让我们看一个例子:
import matplotlib.pyplot as plt
import numpy as np
from matplotlib.patches import Ellipse

def confidence_ellipse(x, y, ax, n_std=3.0, facecolor='none', **kwargs):
    cov = np.cov(x, y)
    pearson = cov[0, 1]/np.sqrt(cov[0, 0] * cov[1, 1])
    ell_radius_x = np.sqrt(1 + pearson)
    ell_radius_y = np.sqrt(1 - pearson)
    ellipse = Ellipse((0, 0), width=ell_radius_x * 2, height=ell_radius_y * 2,
                      facecolor=facecolor, **kwargs)
    scale_x = np.sqrt(cov[0, 0]) * n_std
    scale_y = np.sqrt(cov[1, 1]) * n_std
    transf = plt.gca().transData
    ellipse.set_transform(transf)
    ellipse.center = (np.mean(x), np.mean(y))
    ax.add_patch(ellipse)

np.random.seed(0)
x = np.random.normal(0, 1, 100)
y = np.random.normal(0, 1, 100)

fig, ax = plt.subplots(figsize=(10, 8))
ax.scatter(x, y, s=5)

confidence_ellipse(x, y, ax, edgecolor='red', linestyle=':')

ax.set_title('Scatter plot with dotted confidence ellipse - how2matplotlib.com')
ax.set_xlabel('X-axis')
ax.set_ylabel('Y-axis')
plt.show()
Output:
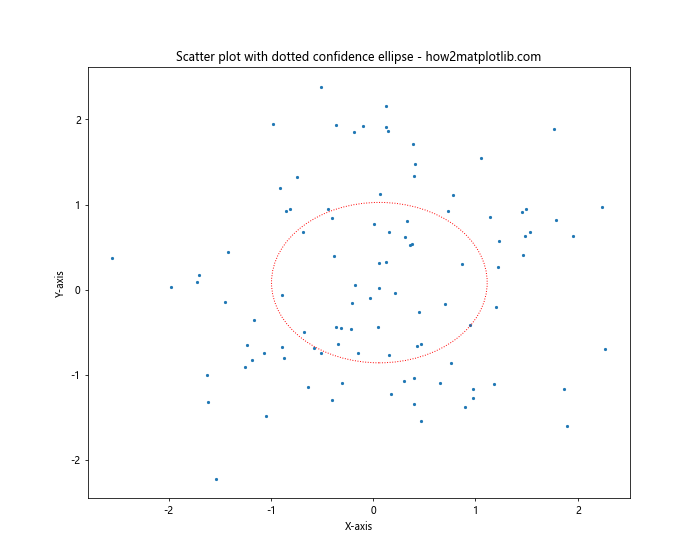
在这个例子中,我们创建了一个散点图,并添加了一个使用红色点线绘制的置信椭圆。这种方法可以清晰地显示数据的分布和不确定性,而不会干扰散点的可见性。
结论
通过以上20个详细的例子,我们深入探讨了Matplotlib中点线样式的多种应用场景和技巧。从基本的线图到复杂的统计可视化,点线样式都展现出了其强大的表现力和灵活性。
点线不仅可以用来区分不同的数据系列,还可以用于强调特定的数据特征、创建视觉层次、表示不确定性,以及增强图表的整体美观性。通过调整点线的密度、颜色、宽度等属性,我们可以创造出丰富多样的视觉效果,以满足各种数据可视化需求。
在实际应用中,选择合适的点线样式应该考虑数据的性质、图表的目的以及目标受众。适当使用点线可以显著提高图表的可读性和信息传达效率。同时,我们也应该注意不要过度使用点线,以免造成视觉混乱。
最后,希望这篇文章能够帮助读者更好地理解和运用Matplotlib中的点线样式,从而创作出更加精美、有效的数据可视化作品。随着数据可视化在各个领域的重要性日益增加,掌握这些技巧将成为数据分析和科学研究中的宝贵技能。
 极客笔记
极客笔记