如何在matplotlib中将图例位置放在图形的外部
参考:matplotlib legend position outside
在使用matplotlib进行数据可视化时,经常会用到图例(legend)来标识不同数据系列的含义。有时候,图例会占据太多空间,需要将其放在图形的外部位置。本文将详细介绍如何在matplotlib中将图例位置放在图形的外部。
1. 在右上角放置图例
import matplotlib.pyplot as plt

x = [1, 2, 3, 4, 5]
y1 = [1, 2, 3, 4, 5]
y2 = [5, 4, 3, 2, 1]

plt.plot(x, y1, label='Line 1')
plt.plot(x, y2, label='Line 2')
plt.legend(loc='upper right', bbox_to_anchor=(1, 1))
plt.show()
Output:
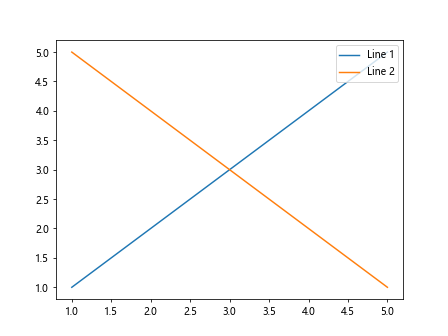
在上面的示例中,我们使用bbox_to_anchor参数将图例放置在右上角。
2. 在左下角放置图例
import matplotlib.pyplot as plt

x = [1, 2, 3, 4, 5]
y1 = [1, 2, 3, 4, 5]
y2 = [5, 4, 3, 2, 1]

plt.plot(x, y1, label='Line 1')
plt.plot(x, y2, label='Line 2')
plt.legend(loc='lower left', bbox_to_anchor=(0, 0))
plt.show()
Output:
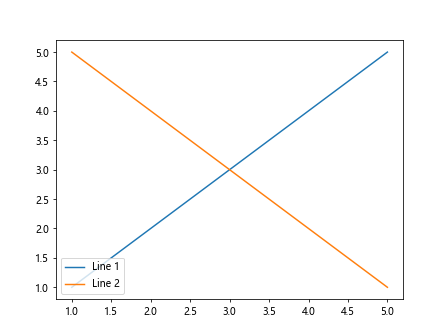
通过设置loc='lower left'和bbox_to_anchor=(0, 0)参数,可以将图例放在左下角。
3. 在左上角放置图例
import matplotlib.pyplot as plt

x = [1, 2, 3, 4, 5]
y1 = [1, 2, 3, 4, 5]
y2 = [5, 4, 3, 2, 1]

plt.plot(x, y1, label='Line 1')
plt.plot(x, y2, label='Line 2')
plt.legend(loc='upper left', bbox_to_anchor=(0, 1))
plt.show()
Output:
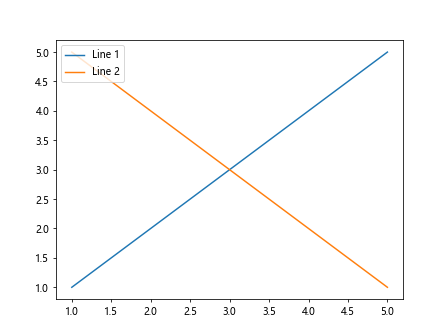
设置loc='upper left'和bbox_to_anchor=(0, 1)参数可以将图例放在左上角。
4. 在右下角放置图例
import matplotlib.pyplot as plt

x = [1, 2, 3, 4, 5]
y1 = [1, 2, 3, 4, 5]
y2 = [5, 4, 3, 2, 1]

plt.plot(x, y1, label='Line 1')
plt.plot(x, y2, label='Line 2')
plt.legend(loc='lower right', bbox_to_anchor=(1, 0))
plt.show()
Output:
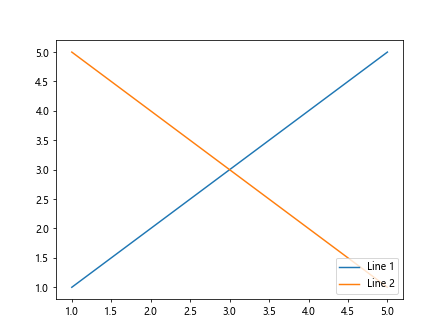
通过设置loc='lower right'和bbox_to_anchor=(1, 0)参数,可以将图例放在右下角。
5. 在指定位置放置图例
import matplotlib.pyplot as plt

x = [1, 2, 3, 4, 5]
y1 = [1, 2, 3, 4, 5]
y2 = [5, 4, 3, 2, 1]

plt.plot(x, y1, label='Line 1')
plt.plot(x, y2, label='Line 2')
plt.legend(loc='center', bbox_to_anchor=(0.5, 0.5))
plt.show()
Output:
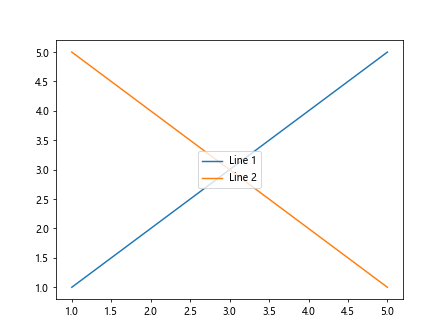
通过设置loc='center'和bbox_to_anchor=(0.5, 0.5)参数,可以将图例放在图形的中心位置。
结论
通过使用bbox_to_anchor参数,我们可以将matplotlib图例放置在图形的外部位置,以便更好地展示数据可视化结果。
 极客笔记
极客笔记