Matplotlib中绘制虚线网格的全面指南
Matplotlib是Python中最流行的数据可视化库之一,它提供了丰富的绘图功能。在数据可视化中,网格线是一个重要的元素,可以帮助读者更好地理解和解读图表。本文将详细介绍如何在Matplotlib中绘制虚线网格,包括基本用法、自定义样式、局部网格、以及高级技巧等内容。
1. 基本网格绘制
在Matplotlib中,我们可以使用plt.grid()函数来添加网格线。默认情况下,网格线是实线的。但是,我们可以通过设置参数来将其改为虚线。
1.1 添加默认网格
首先,让我们看一个最基本的添加网格的例子:
import matplotlib.pyplot as plt
import numpy as np

x = np.linspace(0, 10, 100)
y = np.sin(x)

plt.figure(figsize=(10, 6))
plt.plot(x, y, label='sin(x)')
plt.title('How to add grid in Matplotlib - how2matplotlib.com')
plt.xlabel('X axis')
plt.ylabel('Y axis')
plt.legend()
plt.grid(True)
plt.show()
Output:
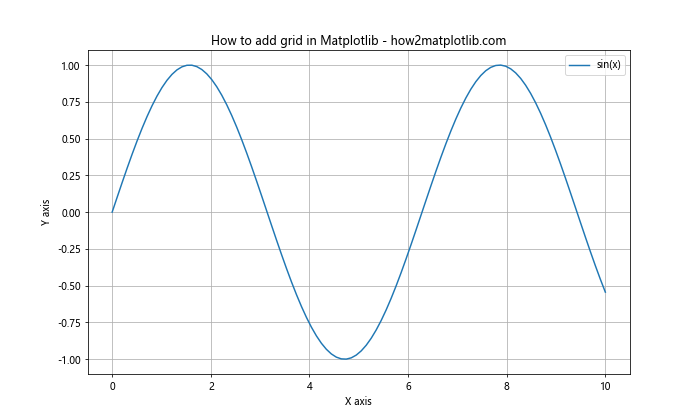
在这个例子中,我们首先创建了一个简单的正弦曲线图。然后,通过调用plt.grid(True)来添加默认的网格线。这将在图表上添加实线网格。
1.2 将网格改为虚线
要将网格改为虚线,我们需要在grid()函数中设置linestyle参数:
import matplotlib.pyplot as plt
import numpy as np

x = np.linspace(0, 10, 100)
y = np.sin(x)

plt.figure(figsize=(10, 6))
plt.plot(x, y, label='sin(x)')
plt.title('Dashed grid in Matplotlib - how2matplotlib.com')
plt.xlabel('X axis')
plt.ylabel('Y axis')
plt.legend()
plt.grid(True, linestyle='--')
plt.show()
Output:
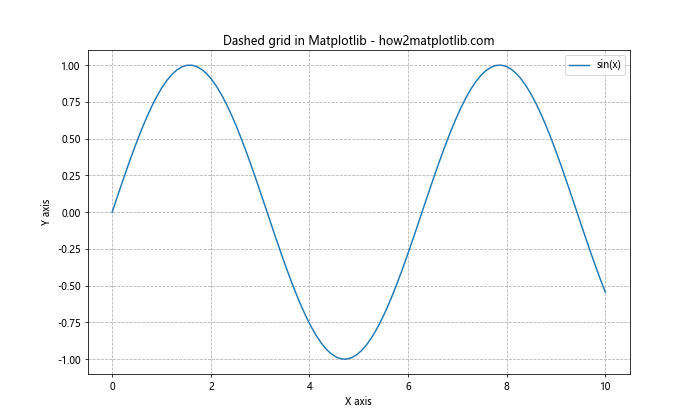
在这个例子中,我们通过设置linestyle='--'来将网格线改为虚线。'--'是表示虚线的一种常用方式。
2. 自定义网格样式
Matplotlib提供了多种方式来自定义网格的样式,包括颜色、线宽、透明度等。
2.1 设置网格颜色
我们可以通过color参数来设置网格的颜色:
import matplotlib.pyplot as plt
import numpy as np

x = np.linspace(0, 10, 100)
y = np.sin(x)

plt.figure(figsize=(10, 6))
plt.plot(x, y, label='sin(x)')
plt.title('Colored dashed grid - how2matplotlib.com')
plt.xlabel('X axis')
plt.ylabel('Y axis')
plt.legend()
plt.grid(True, linestyle='--', color='red')
plt.show()
Output:
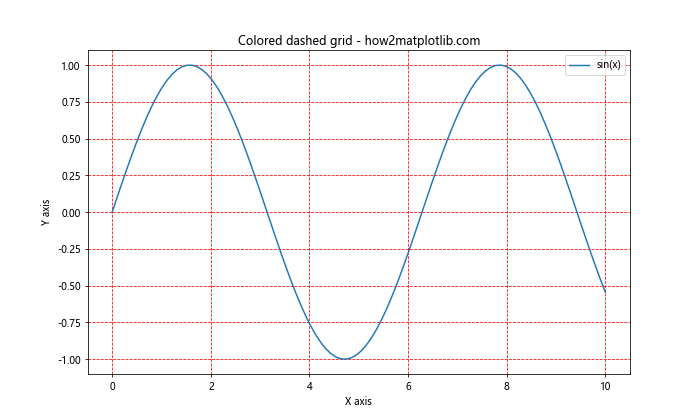
在这个例子中,我们将网格线的颜色设置为红色。你可以使用任何有效的颜色名称或RGB值。
2.2 调整线宽和透明度
我们还可以通过linewidth和alpha参数来调整线宽和透明度:
import matplotlib.pyplot as plt
import numpy as np

x = np.linspace(0, 10, 100)
y = np.sin(x)

plt.figure(figsize=(10, 6))
plt.plot(x, y, label='sin(x)')
plt.title('Customized dashed grid - how2matplotlib.com')
plt.xlabel('X axis')
plt.ylabel('Y axis')
plt.legend()
plt.grid(True, linestyle='--', color='gray', linewidth=0.5, alpha=0.7)
plt.show()
Output:
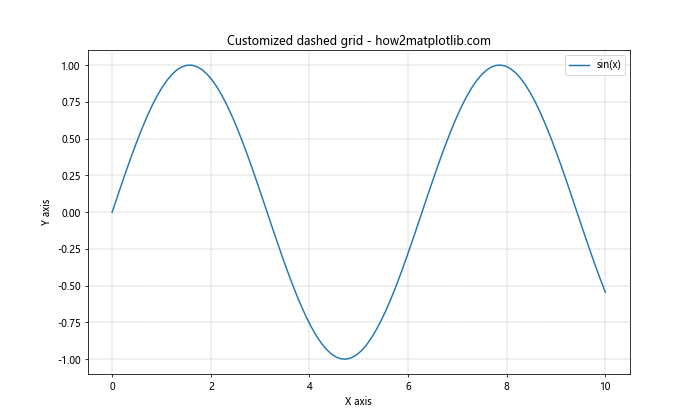
在这个例子中,我们设置了灰色的虚线网格,线宽为0.5,透明度为0.7。这样的设置可以使网格不那么突兀,更好地融入背景。
3. 主次网格
Matplotlib允许我们同时显示主网格和次网格,这在某些情况下非常有用。
3.1 添加主次网格
以下是一个同时显示主网格和次网格的例子:
import matplotlib.pyplot as plt
import numpy as np

x = np.linspace(0, 10, 100)
y = np.sin(x)

fig, ax = plt.subplots(figsize=(10, 6))
ax.plot(x, y, label='sin(x)')
ax.set_title('Major and minor grids - how2matplotlib.com')
ax.set_xlabel('X axis')
ax.set_ylabel('Y axis')
ax.legend()

ax.grid(True, linestyle='--', which='major', color='gray', alpha=0.5)
ax.grid(True, linestyle=':', which='minor', color='gray', alpha=0.3)
ax.minorticks_on()

plt.show()
Output:
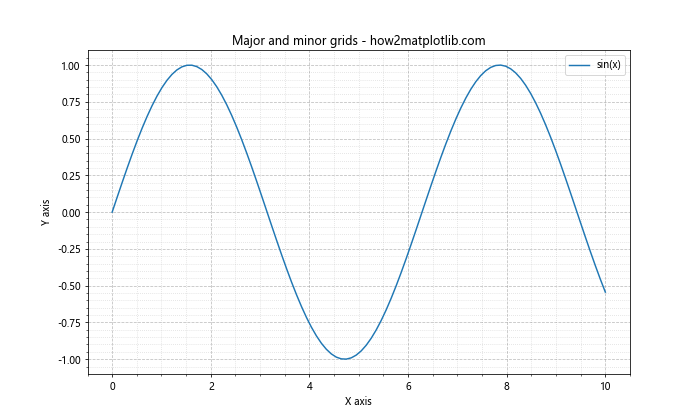
在这个例子中,我们使用了ax.grid()方法来分别设置主网格和次网格。主网格使用虚线('--'),次网格使用点线(':')。我们还调用了ax.minorticks_on()来显示次刻度。
3.2 自定义主次网格间隔
我们可以通过设置主次刻度的位置来自定义网格的间隔:
import matplotlib.pyplot as plt
import numpy as np
from matplotlib.ticker import MultipleLocator

x = np.linspace(0, 10, 100)
y = np.sin(x)

fig, ax = plt.subplots(figsize=(10, 6))
ax.plot(x, y, label='sin(x)')
ax.set_title('Custom grid intervals - how2matplotlib.com')
ax.set_xlabel('X axis')
ax.set_ylabel('Y axis')
ax.legend()

ax.xaxis.set_major_locator(MultipleLocator(2))
ax.xaxis.set_minor_locator(MultipleLocator(0.5))
ax.yaxis.set_major_locator(MultipleLocator(0.5))
ax.yaxis.set_minor_locator(MultipleLocator(0.1))

ax.grid(True, linestyle='--', which='major', color='gray', alpha=0.5)
ax.grid(True, linestyle=':', which='minor', color='gray', alpha=0.3)

plt.show()
Output:
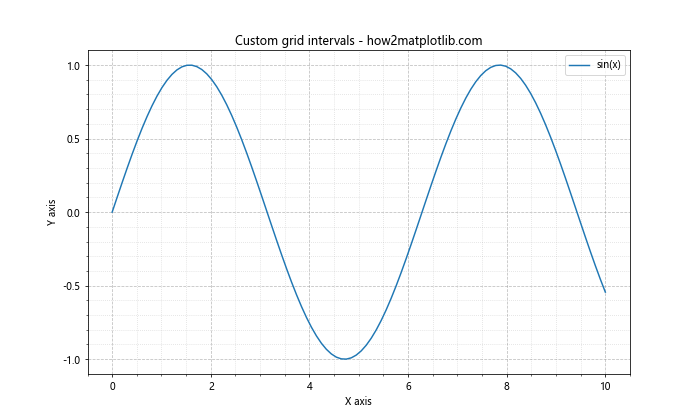
在这个例子中,我们使用MultipleLocator来设置主次刻度的间隔。X轴的主刻度间隔为2,次刻度间隔为0.5;Y轴的主刻度间隔为0.5,次刻度间隔为0.1。
4. 局部网格
有时候,我们可能只想在图表的某些部分显示网格。Matplotlib允许我们实现这种局部网格。
4.1 只显示X轴或Y轴网格
我们可以通过设置axis参数来只显示X轴或Y轴的网格:
import matplotlib.pyplot as plt
import numpy as np

x = np.linspace(0, 10, 100)
y = np.sin(x)

fig, (ax1, ax2) = plt.subplots(1, 2, figsize=(12, 5))

ax1.plot(x, y, label='sin(x)')
ax1.set_title('X-axis grid only - how2matplotlib.com')
ax1.set_xlabel('X axis')
ax1.set_ylabel('Y axis')
ax1.legend()
ax1.grid(True, linestyle='--', axis='x')

ax2.plot(x, y, label='sin(x)')
ax2.set_title('Y-axis grid only - how2matplotlib.com')
ax2.set_xlabel('X axis')
ax2.set_ylabel('Y axis')
ax2.legend()
ax2.grid(True, linestyle='--', axis='y')

plt.tight_layout()
plt.show()
Output:
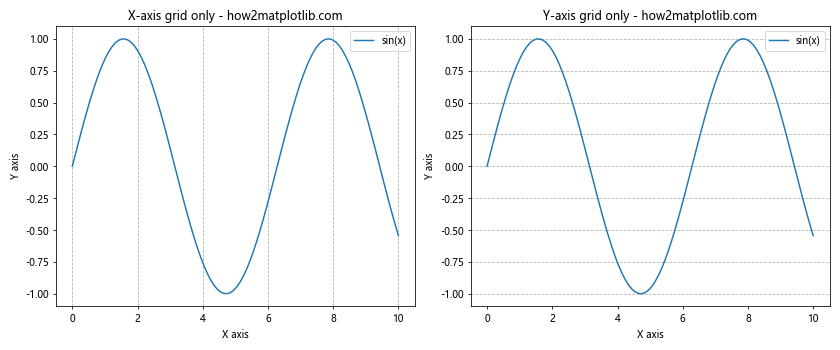
在这个例子中,我们创建了两个子图。左边的子图只显示X轴的网格,右边的子图只显示Y轴的网格。
4.2 在特定区域显示网格
我们还可以通过设置轴的范围来在特定区域显示网格:
import matplotlib.pyplot as plt
import numpy as np

x = np.linspace(0, 10, 100)
y = np.sin(x)

fig, ax = plt.subplots(figsize=(10, 6))
ax.plot(x, y, label='sin(x)')
ax.set_title('Grid in specific region - how2matplotlib.com')
ax.set_xlabel('X axis')
ax.set_ylabel('Y axis')
ax.legend()

ax.set_xlim(2, 8)
ax.set_ylim(-0.5, 0.5)
ax.grid(True, linestyle='--')

plt.show()
Output:
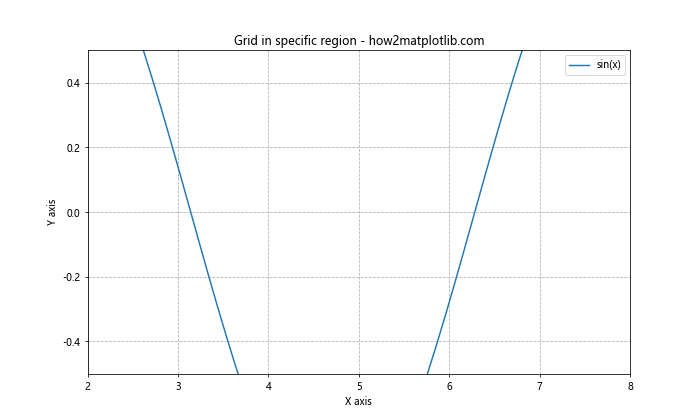
在这个例子中,我们通过set_xlim()和set_ylim()方法设置了轴的范围,这样网格只会在指定的区域内显示。
5. 网格与其他图表元素的结合
网格可以与其他图表元素结合使用,以增强数据的可读性。
5.1 网格与填充区域
我们可以结合使用网格和填充区域来突出显示某些数据范围:
import matplotlib.pyplot as plt
import numpy as np

x = np.linspace(0, 10, 100)
y1 = np.sin(x)
y2 = np.cos(x)

fig, ax = plt.subplots(figsize=(10, 6))
ax.plot(x, y1, label='sin(x)')
ax.plot(x, y2, label='cos(x)')
ax.fill_between(x, y1, y2, where=(y1 > y2), alpha=0.3, color='green')
ax.set_title('Grid with filled area - how2matplotlib.com')
ax.set_xlabel('X axis')
ax.set_ylabel('Y axis')
ax.legend()

ax.grid(True, linestyle='--', alpha=0.7)

plt.show()
Output:
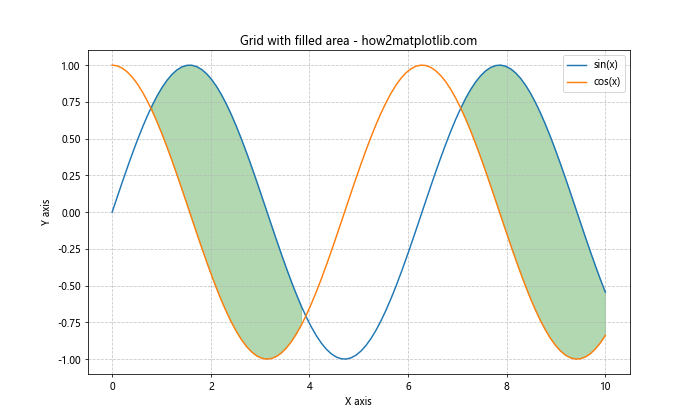
在这个例子中,我们绘制了正弦和余弦函数,并在正弦大于余弦的区域进行了填充。网格线有助于更清晰地看到填充区域的范围。
5.2 网格与条形图
网格在条形图中也很有用,可以帮助读者更准确地判断数值:
import matplotlib.pyplot as plt
import numpy as np

categories = ['A', 'B', 'C', 'D', 'E']
values = [3, 7, 2, 5, 8]

fig, ax = plt.subplots(figsize=(10, 6))
ax.bar(categories, values)
ax.set_title('Bar chart with grid - how2matplotlib.com')
ax.set_xlabel('Categories')
ax.set_ylabel('Values')

ax.grid(True, linestyle='--', axis='y', alpha=0.7)

plt.show()
Output:
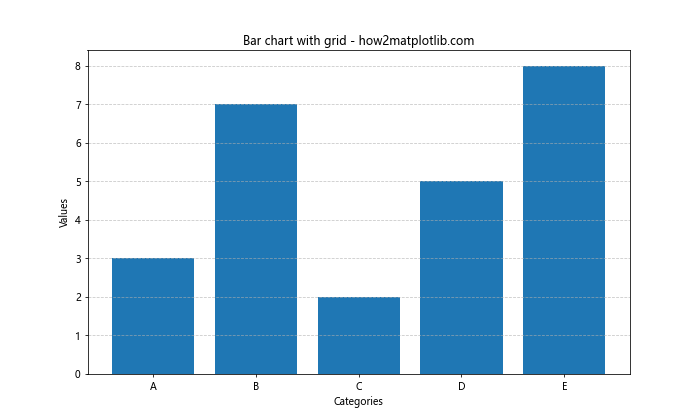
在这个条形图例子中,我们只在Y轴添加了网格线,这有助于读者更准确地判断每个条形的高度。
6. 高级网格技巧
除了基本的网格设置,Matplotlib还提供了一些高级的网格绘制技巧。
6.1 自定义网格线样式
我们可以使用更复杂的线型来自定义网格线的样式:
import matplotlib.pyplot as plt
import numpy as np

x = np.linspace(0, 10, 100)
y = np.sin(x)

fig, ax = plt.subplots(figsize=(10, 6))
ax.plot(x, y, label='sin(x)')
ax.set_title('Custom grid line style - how2matplotlib.com')
ax.set_xlabel('X axis')
ax.set_ylabel('Y axis')
ax.legend()

ax.grid(True, linestyle=(0, (5, 2, 1, 2)), color='gray', linewidth=1.5)

plt.show()
Output:
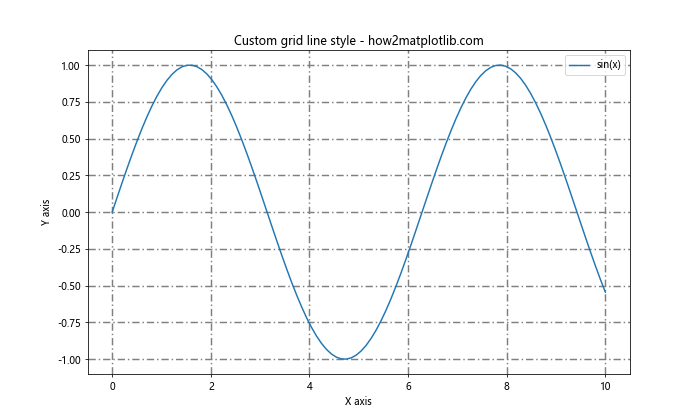
在这个例子中,我们使用了一个元组来定义线型。(0, (5, 2, 1, 2))表示一个由5个点的线段、2个点的空白、1个点的线段、2个点的空白组成的重复模式。
6.2 极坐标系中的网格
Matplotlib也支持在极坐标系中绘制网格:
import matplotlib.pyplot as plt
import numpy as np

r = np.arange(0, 2, 0.01)
theta = 2 * np.pi * r

fig, ax = plt.subplots(figsize=(8, 8), subplot_kw=dict(projection='polar'))
ax.plot(theta, r)
ax.set_title('Polar plot with grid - how2matplotlib.com')

ax.grid(True, linestyle='--')

plt.show()
Output:
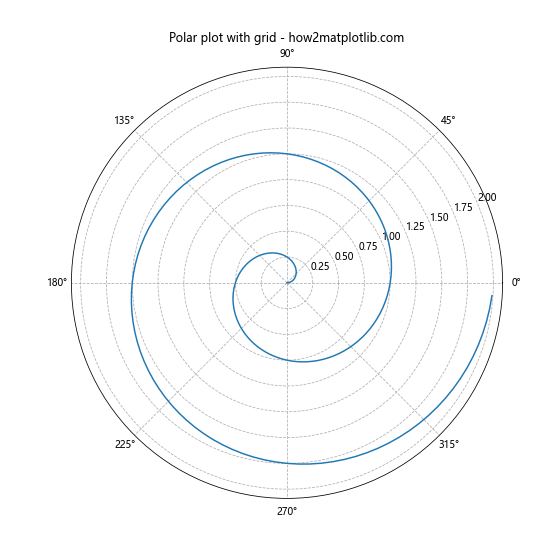
在这个例子中,我们在极坐标系中绘制了一个螺旋线,并添加了虚线网格。极坐标系的网格是由同心圆和径向线组成的。
6.3 3D图表中的网格
Matplotlib还支持在3D图表中添加网格:
import matplotlib.pyplot as plt
import numpy as np

fig = plt.figure(figsize=(10, 8))
ax = fig.add_subplot(111, projection='3d')

x = np.arange(-5, 5, 0.25)
y = np.arange(-5, 5, 0.25)
X, Y = np.meshgrid(x, y)
Z = np.sin(np.sqrt(X**2 + Y**2))

surf = ax.plot_surface(X, Y, Z, cmap='viridis')
ax.set_title('3D surface plot with grid - how2matplotlib.com')

ax.grid(True, linestyle='--', alpha=0.6)

plt.show()
Output:
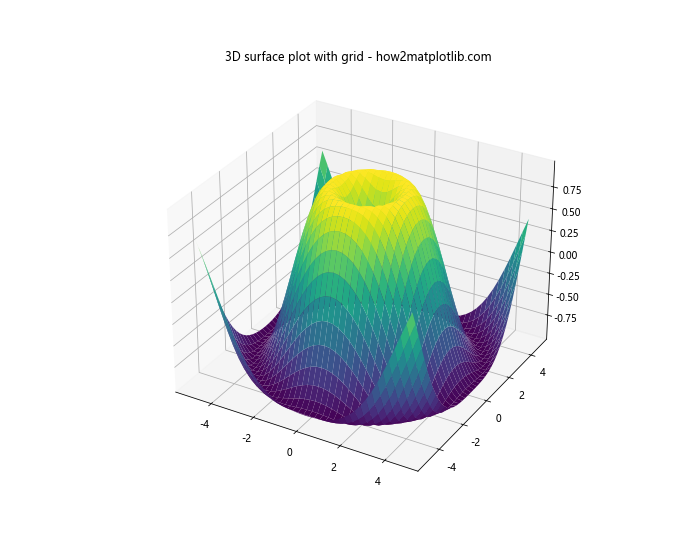
在这个3D表面图的例子中,我们添加了虚线网格。3D图表中的网格可以帮助读者更好地理解空间关系。
7. 网格与样式设置
Matplotlib的样式设置可以影响网格的默认外观。我们可以使用不同的样式来改变网格的默认外观。
7.1 使用内置样式
Matplotlib提供了多种内置样式,可以通过plt.style.use()来使用:
import matplotlib.pyplot as plt
import numpy as np

plt.style.use('ggplot')

x = np.linspace(0, 10, 100)
y = np.sin(x)

plt.figure(figsize=(10, 6))
plt.plot(x, y, label='sin(x)')
plt.title('Using ggplot style - how2matplotlib.com')
plt.xlabel('X axis')
plt.ylabel('Y axis')
plt.legend()
plt.grid(True, linestyle='--')
plt.show()
Output:
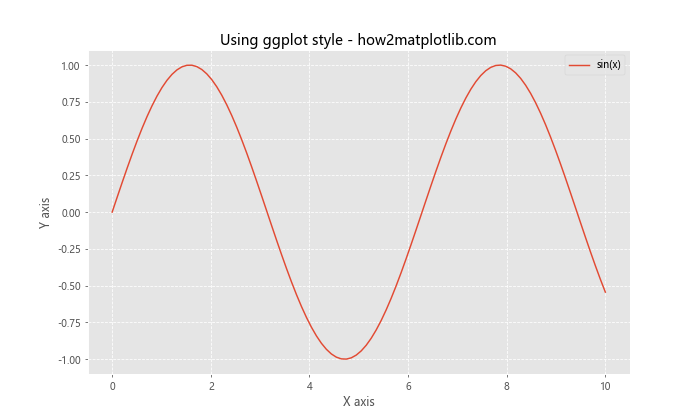
在这个例子中,我们使用了’ggplot’样式,这会改变整个图表的外观,包括网格线的样式。
7.2 自定义RC参数
我们还可以通过修改RC参数来全局设置网格样式:
import matplotlib.pyplot as plt
import numpy as np

plt.rcParams['grid.linestyle'] = '--'
plt.rcParams['grid.color'] = 'gray'
plt.rcParams['grid.alpha'] = 0.5

x = np.linspace(0, 10, 100)
y = np.sin(x)

plt.figure(figsize=(10, 6))
plt.plot(x, y, label='sin(x)')
plt.title('Custom RC parameters - how2matplotlib.com')
plt.xlabel('X axis')
plt.ylabel('Y axis')
plt.legend()
plt.grid(True)
plt.show()
Output:
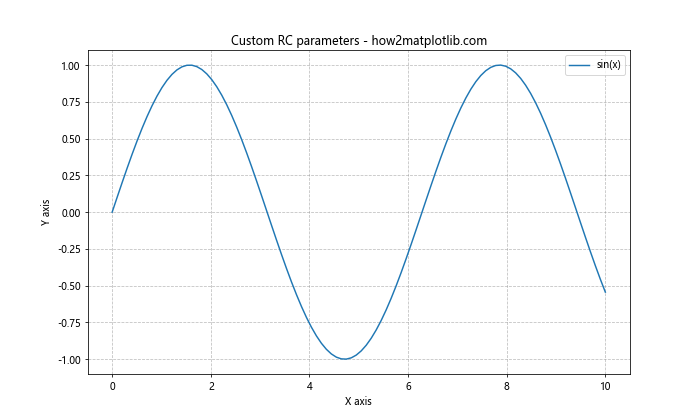
在这个例子中,我们通过修改RC参数来设置默认的网格样式。这样,每次调用plt.grid(True)时都会使用这些设置。
8. 网格与多子图
在复杂的图表中,我们可能需要在多个子图中使用网格。
8.1 在所有子图中添加网格
以下是一个在多个子图中添加网格的例子:
import matplotlib.pyplot as plt
import numpy as np

x = np.linspace(0, 10, 100)

fig, axs = plt.subplots(2, 2, figsize=(12, 10))
fig.suptitle('Multiple subplots with grids - how2matplotlib.com')

axs[0, 0].plot(x, np.sin(x))
axs[0, 0].set_title('sin(x)')
axs[0, 0].grid(True, linestyle='--')

axs[0, 1].plot(x, np.cos(x))
axs[0, 1].set_title('cos(x)')
axs[0, 1].grid(True, linestyle='--')

axs[1, 0].plot(x, np.tan(x))
axs[1, 0].set_title('tan(x)')
axs[1, 0].grid(True, linestyle='--')

axs[1, 1].plot(x, np.exp(x))
axs[1, 1].set_title('exp(x)')
axs[1, 1].grid(True, linestyle='--')

plt.tight_layout()
plt.show()
Output:
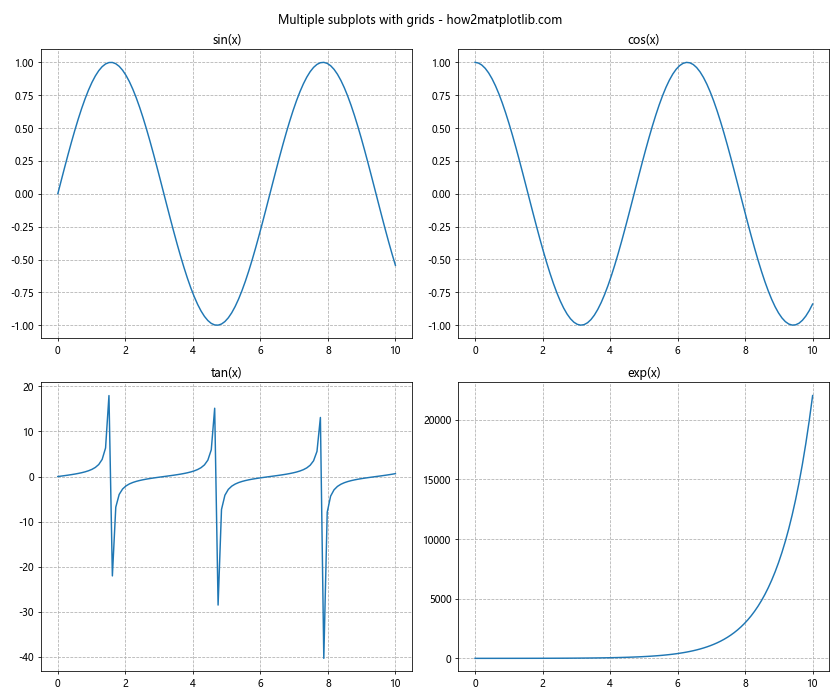
在这个例子中,我们创建了2×2的子图网格,并在每个子图中都添加了虚线网格。
8.2 不同子图使用不同的网格样式
我们还可以为不同的子图设置不同的网格样式:
import matplotlib.pyplot as plt
import numpy as np

x = np.linspace(0, 10, 100)

fig, axs = plt.subplots(2, 2, figsize=(12, 10))
fig.suptitle('Subplots with different grid styles - how2matplotlib.com')

axs[0, 0].plot(x, np.sin(x))
axs[0, 0].set_title('Dashed grid')
axs[0, 0].grid(True, linestyle='--', color='gray')

axs[0, 1].plot(x, np.cos(x))
axs[0, 1].set_title('Dotted grid')
axs[0, 1].grid(True, linestyle=':', color='blue')

axs[1, 0].plot(x, np.tan(x))
axs[1, 0].set_title('Solid grid')
axs[1, 0].grid(True, linestyle='-', color='red', alpha=0.3)

axs[1, 1].plot(x, np.exp(x))
axs[1, 1].set_title('No grid')

plt.tight_layout()
plt.show()
Output:
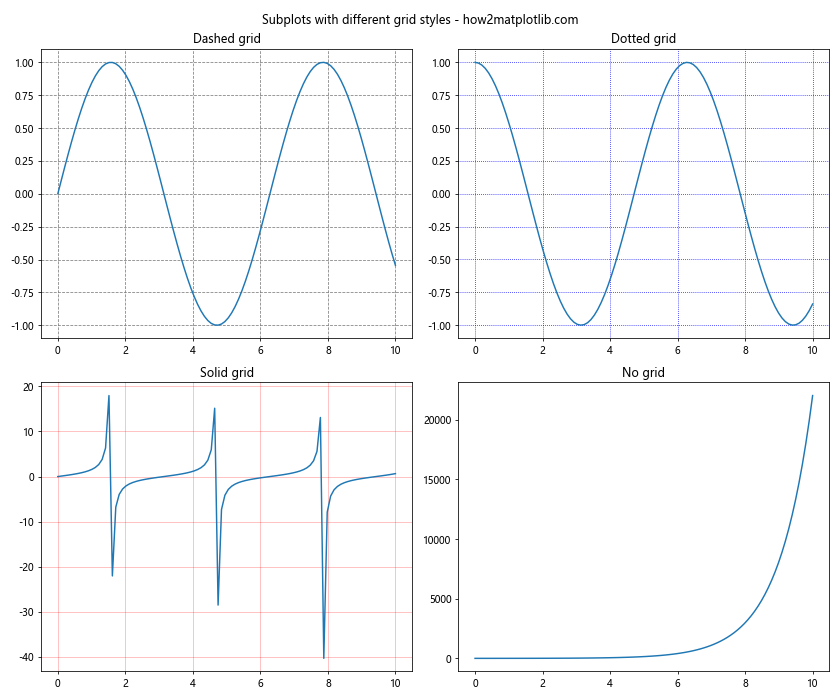
在这个例子中,我们为每个子图设置了不同的网格样式,包括虚线、点线、实线,以及一个没有网格的子图。
9. 网格与坐标轴刻度
网格线通常与坐标轴刻度对齐。我们可以通过调整刻度来影响网格的布局。
9.1 自定义刻度和网格
以下是一个自定义刻度和网格的例子:
import matplotlib.pyplot as plt
import numpy as np

x = np.linspace(0, 10, 100)
y = np.sin(x)

fig, ax = plt.subplots(figsize=(10, 6))
ax.plot(x, y)
ax.set_title('Custom ticks and grid - how2matplotlib.com')
ax.set_xlabel('X axis')
ax.set_ylabel('Y axis')

ax.set_xticks(np.arange(0, 11, 2))
ax.set_yticks(np.arange(-1, 1.1, 0.5))

ax.grid(True, linestyle='--', which='major', color='gray', alpha=0.5)
ax.grid(True, linestyle=':', which='minor', color='gray', alpha=0.3)
ax.minorticks_on()

plt.show()
Output:
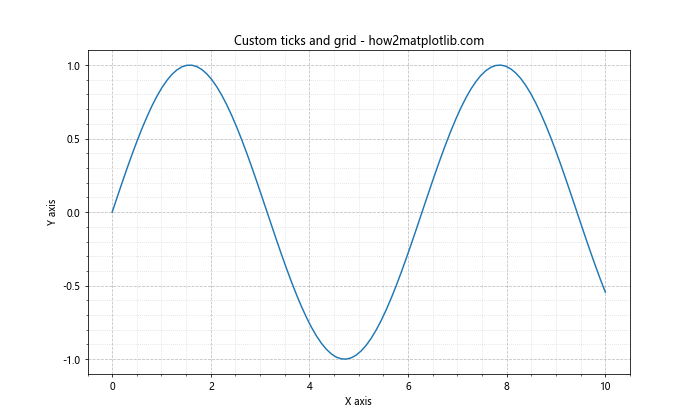
在这个例子中,我们自定义了X轴和Y轴的主刻度,并添加了主网格和次网格。
9.2 对数刻度的网格
对于对数刻度,网格的布局会有所不同:
import matplotlib.pyplot as plt
import numpy as np

x = np.logspace(0, 3, 50)
y = x**2

fig, ax = plt.subplots(figsize=(10, 6))
ax.loglog(x, y)
ax.set_title('Logarithmic scale with grid - how2matplotlib.com')
ax.set_xlabel('X axis (log scale)')
ax.set_ylabel('Y axis (log scale)')

ax.grid(True, linestyle='--', which='major', color='gray', alpha=0.5)
ax.grid(True, linestyle=':', which='minor', color='gray', alpha=0.3)

plt.show()
Output:
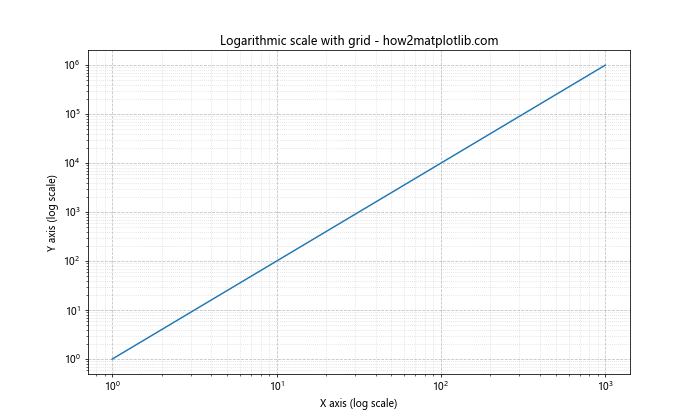
在这个例子中,我们使用了对数刻度,并添加了主网格和次网格。在对数刻度中,网格线的间隔是不均匀的。
10. 网格与图例
当图表中包含图例时,我们需要注意网格线不要影响图例的可读性。
10.1 调整图例位置避免与网格重叠
以下是一个调整图例位置以避免与网格重叠的例子:
import matplotlib.pyplot as plt
import numpy as np

x = np.linspace(0, 10, 100)

fig, ax = plt.subplots(figsize=(10, 6))
ax.plot(x, np.sin(x), label='sin(x)')
ax.plot(x, np.cos(x), label='cos(x)')
ax.set_title('Legend placement with grid - how2matplotlib.com')
ax.set_xlabel('X axis')
ax.set_ylabel('Y axis')

ax.grid(True, linestyle='--', alpha=0.7)
ax.legend(loc='upper right', bbox_to_anchor=(1.1, 1))

plt.tight_layout()
plt.show()
Output:
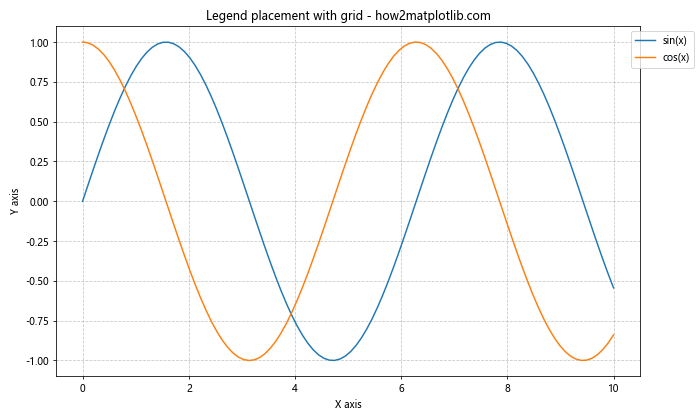
在这个例子中,我们使用bbox_to_anchor参数将图例放置在图表的右上角外侧,以避免与网格线重叠。
10.2 设置图例背景
另一种方法是为图例设置背景色:
import matplotlib.pyplot as plt
import numpy as np

x = np.linspace(0, 10, 100)

fig, ax = plt.subplots(figsize=(10, 6))
ax.plot(x, np.sin(x), label='sin(x)')
ax.plot(x, np.cos(x), label='cos(x)')
ax.set_title('Legend with background - how2matplotlib.com')
ax.set_xlabel('X axis')
ax.set_ylabel('Y axis')

ax.grid(True, linestyle='--', alpha=0.7)
legend = ax.legend(loc='upper right')
legend.get_frame().set_facecolor('white')
legend.get_frame().set_alpha(0.8)

plt.show()
Output:
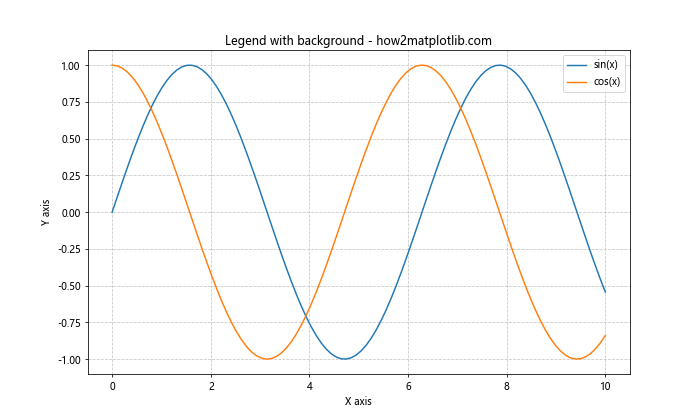
在这个例子中,我们为图例设置了白色背景,并设置了一定的透明度,这样可以确保图例文字清晰可读,同时不会完全遮挡背景的网格线。
结语
通过本文的详细介绍,我们深入探讨了Matplotlib中绘制虚线网格的各种方法和技巧。从基本的网格添加到高级的自定义样式,从单一图表到复杂的多子图布局,我们涵盖了多个方面。网格作为数据可视化中的重要元素,可以极大地提高图表的可读性和理解性。
虚线网格相比实线网格,往往能够在提供参考线的同时,不会过分干扰主要数据的展示。通过调整网格的样式、颜色、透明度等属性,我们可以在数据清晰度和美观性之间找到平衡。
在实际应用中,选择合适的网格样式应该根据具体的数据类型和可视化目的来决定。例如,对于密集的数据点,可能需要更细致的网格;而对于趋势分析,可能只需要主要的参考线。
最后,希望这篇文章能够帮助你更好地掌握Matplotlib中虚线网格的使用,从而创建出更加清晰、专业的数据可视化图表。记住,优秀的数据可视化不仅仅是展示数据,更是讲述数据背后的故事。恰当的网格设置可以成为你讲好这个故事的有力工具。
 极客笔记
极客笔记