Matplotlib 图形尺寸设置:像素精确控制
参考:matplotlib figure size in pixels
Matplotlib 是 Python 中最流行的数据可视化库之一,它提供了强大而灵活的工具来创建各种类型的图表和绘图。在使用 Matplotlib 时,控制图形的尺寸是一个重要的方面,特别是当我们需要精确控制输出图像的像素大小时。本文将深入探讨如何在 Matplotlib 中设置和调整图形尺寸,以像素为单位进行精确控制。
1. 基本概念
在开始之前,我们需要了解一些基本概念:
- Figure:整个图形窗口
- Axes:图形中的坐标系
- DPI(Dots Per Inch):每英寸点数,用于定义图像的分辨率
在 Matplotlib 中,图形的实际尺寸是由 Figure 的大小(以英寸为单位)和 DPI 共同决定的。像素尺寸可以通过以下公式计算:
像素宽度 = Figure宽度(英寸) * DPI
像素高度 = Figure高度(英寸) * DPI
让我们从一个基本的例子开始:
import matplotlib.pyplot as plt

fig, ax = plt.subplots(figsize=(8, 6), dpi=100)
ax.plot([1, 2, 3, 4], [1, 4, 2, 3])
ax.set_title("How2matplotlib.com Basic Example")
plt.show()
Output:
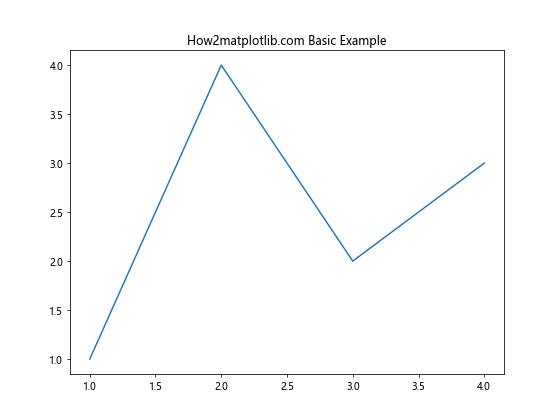
在这个例子中,我们创建了一个 8×6 英寸的图形,DPI 设置为 100。因此,最终的图像尺寸将是 800×600 像素。
2. 使用 figsize 参数
figsize 参数是控制图形尺寸的最直接方法。它接受一个元组,指定图形的宽度和高度(以英寸为单位)。
import matplotlib.pyplot as plt

fig, ax = plt.subplots(figsize=(10, 5))  # 10 inches wide, 5 inches tall
ax.plot([1, 2, 3, 4], [1, 4, 2, 3])
ax.set_title("How2matplotlib.com Figure Size Example")
plt.show()
Output:
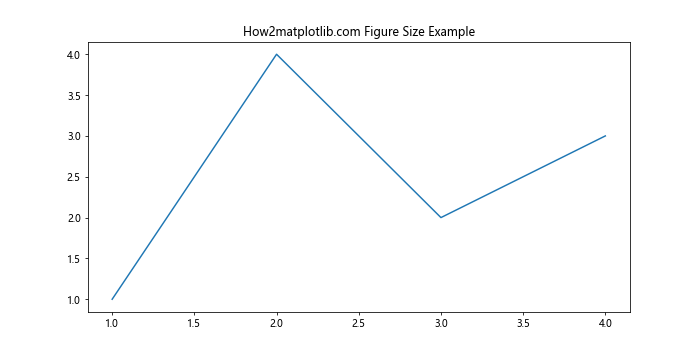
这个例子创建了一个 10×5 英寸的图形。默认 DPI 为 100,所以实际像素尺寸为 1000×500。
3. 设置 DPI
DPI 决定了每英寸包含多少个像素。通过调整 DPI,我们可以在保持相同英寸尺寸的情况下改变像素尺寸。
import matplotlib.pyplot as plt

fig, ax = plt.subplots(figsize=(8, 6), dpi=200)  # Higher DPI for more pixels
ax.plot([1, 2, 3, 4], [1, 4, 2, 3])
ax.set_title("How2matplotlib.com High DPI Example")
plt.show()
Output:
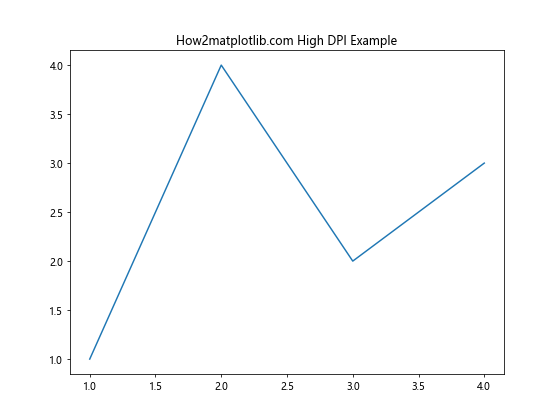
这个例子创建了一个 8×6 英寸的图形,但 DPI 设置为 200,所以实际像素尺寸为 1600×1200。
4. 使用 plt.figure() 函数
除了 plt.subplots(),我们还可以使用 plt.figure() 函数来创建图形并设置尺寸。
import matplotlib.pyplot as plt

plt.figure(figsize=(12, 4), dpi=100)
plt.plot([1, 2, 3, 4], [1, 4, 2, 3])
plt.title("How2matplotlib.com plt.figure() Example")
plt.show()
Output:
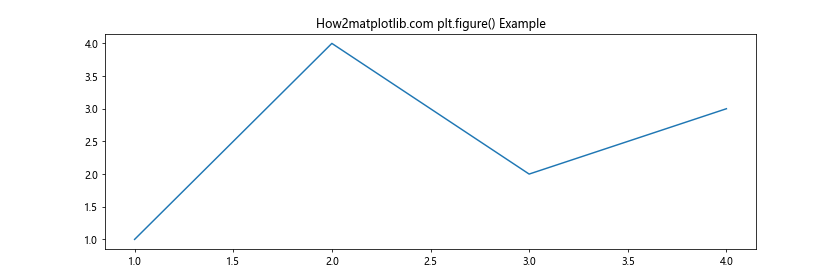
这个例子创建了一个 12×4 英寸的图形,像素尺寸为 1200×400。
5. 精确控制像素尺寸
如果我们需要精确的像素尺寸,可以通过计算来设置 figsize 和 dpi:
import matplotlib.pyplot as plt

desired_width = 800  # pixels
desired_height = 600  # pixels
dpi = 100
figsize = (desired_width / dpi, desired_height / dpi)

fig, ax = plt.subplots(figsize=figsize, dpi=dpi)
ax.plot([1, 2, 3, 4], [1, 4, 2, 3])
ax.set_title("How2matplotlib.com Precise Pixel Size Example")
plt.show()
Output:
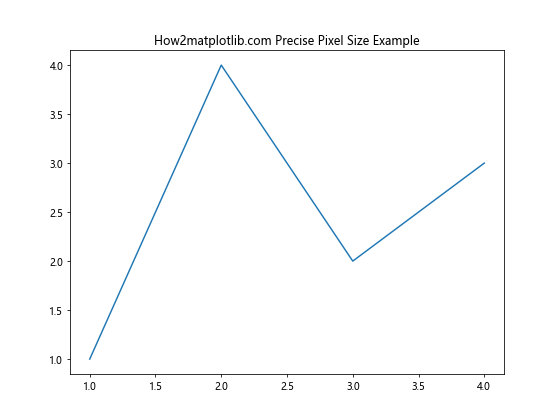
这个例子创建了一个精确为 800×600 像素的图形。
6. 调整现有图形的尺寸
有时我们可能需要在创建图形后调整其尺寸:
import matplotlib.pyplot as plt

fig, ax = plt.subplots()
ax.plot([1, 2, 3, 4], [1, 4, 2, 3])
ax.set_title("How2matplotlib.com Resize Example")

# Resize the figure
fig.set_size_inches(10, 5)
fig.set_dpi(150)

plt.show()
Output:
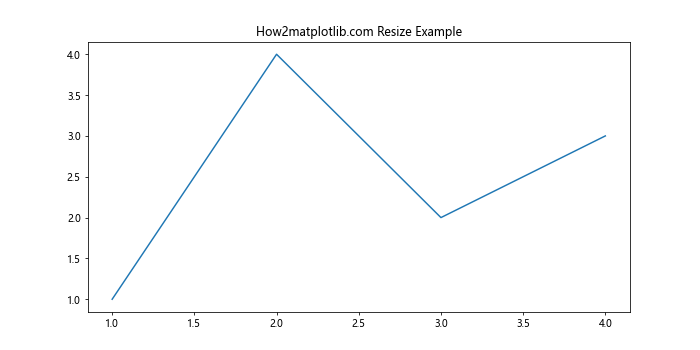
这个例子首先创建了一个默认尺寸的图形,然后将其调整为 10×5 英寸,DPI 为 150。
7. 保存特定像素尺寸的图像
当保存图像时,我们可以指定输出文件的 DPI,从而控制像素尺寸:
import matplotlib.pyplot as plt

fig, ax = plt.subplots(figsize=(8, 6))
ax.plot([1, 2, 3, 4], [1, 4, 2, 3])
ax.set_title("How2matplotlib.com Save Example")

# Save with specific DPI
plt.savefig('how2matplotlib_example.png', dpi=200)
这个例子创建了一个 8×6 英寸的图形,并以 200 DPI 保存,resulting in a 1600×1200 pixel image.
8. 使用 bbox_inches 参数
bbox_inches 参数可以用来裁剪图形,只保留实际内容:
import matplotlib.pyplot as plt

fig, ax = plt.subplots(figsize=(10, 8))
ax.plot([1, 2, 3, 4], [1, 4, 2, 3])
ax.set_title("How2matplotlib.com Tight Layout Example")

plt.tight_layout()
plt.savefig('how2matplotlib_tight.png', bbox_inches='tight', dpi=100)
这个例子使用 bbox_inches='tight' 来裁剪多余的空白区域,确保保存的图像只包含实际内容。
9. 处理多个子图
当处理多个子图时,控制整体图形尺寸和每个子图的尺寸都很重要:
import matplotlib.pyplot as plt

fig, (ax1, ax2) = plt.subplots(1, 2, figsize=(12, 5))
ax1.plot([1, 2, 3, 4], [1, 4, 2, 3])
ax2.plot([1, 2, 3, 4], [3, 2, 4, 1])
ax1.set_title("How2matplotlib.com Subplot 1")
ax2.set_title("How2matplotlib.com Subplot 2")

plt.tight_layout()
plt.show()
Output:
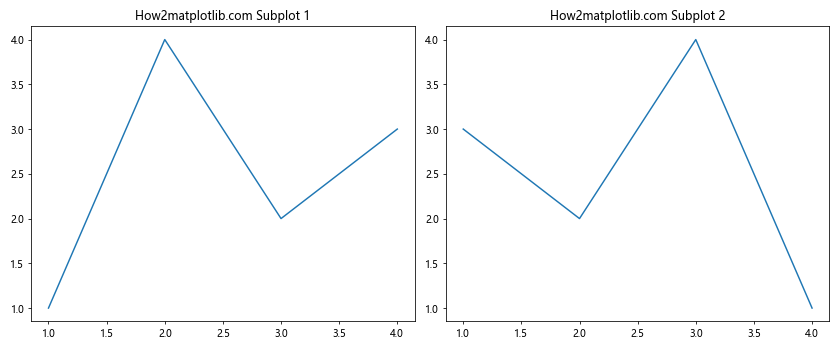
这个例子创建了一个包含两个子图的图形,总尺寸为 12×5 英寸。
10. 使用 constrained_layout
constrained_layout 是一个自动调整布局的工具,可以帮助优化图形中的空间利用:
import matplotlib.pyplot as plt

fig, (ax1, ax2) = plt.subplots(1, 2, figsize=(12, 5), constrained_layout=True)
ax1.plot([1, 2, 3, 4], [1, 4, 2, 3])
ax2.plot([1, 2, 3, 4], [3, 2, 4, 1])
ax1.set_title("How2matplotlib.com Constrained Layout 1")
ax2.set_title("How2matplotlib.com Constrained Layout 2")

plt.show()
Output:
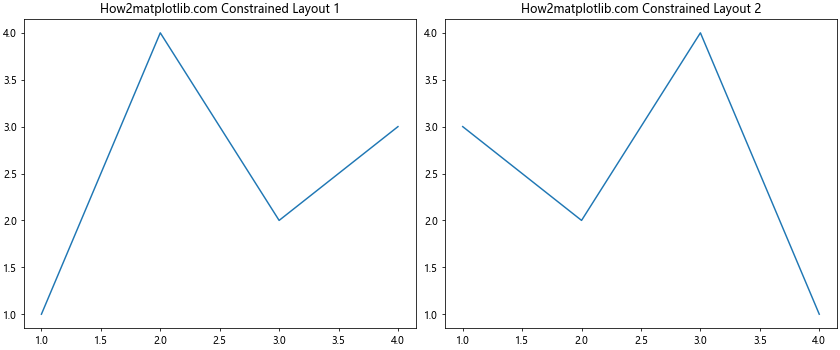
这个例子使用 constrained_layout=True 来自动调整子图之间的间距和边距。
11. 响应式图形尺寸
在某些情况下,我们可能希望图形尺寸能够根据显示环境自动调整:
import matplotlib.pyplot as plt

fig, ax = plt.subplots(figsize=(8, 6))
ax.plot([1, 2, 3, 4], [1, 4, 2, 3])
ax.set_title("How2matplotlib.com Responsive Example")

plt.rcParams['figure.autolayout'] = True
plt.show()
Output:
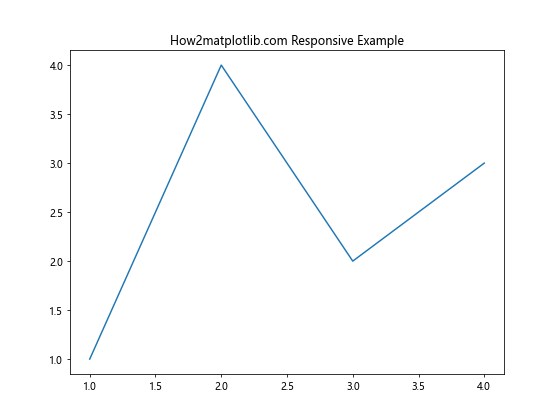
这个例子设置 figure.autolayout = True,使图形能够自动调整以适应不同的显示环境。
12. 使用英寸和厘米
Matplotlib 默认使用英寸,但我们也可以使用厘米:
import matplotlib.pyplot as plt

cm = 1/2.54  # centimeters in inches
fig, ax = plt.subplots(figsize=(20*cm, 15*cm))
ax.plot([1, 2, 3, 4], [1, 4, 2, 3])
ax.set_title("How2matplotlib.com Centimeter Example")
plt.show()
Output:
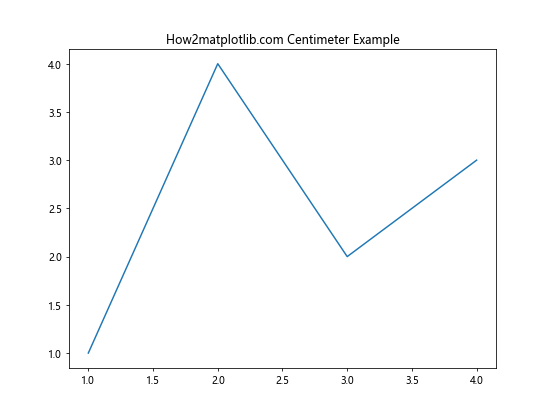
这个例子创建了一个 20×15 厘米的图形。
13. 调整图形边距
控制图形边距可以帮助我们更好地利用可用空间:
import matplotlib.pyplot as plt

fig, ax = plt.subplots(figsize=(8, 6))
ax.plot([1, 2, 3, 4], [1, 4, 2, 3])
ax.set_title("How2matplotlib.com Margin Example")

# Adjust margins
plt.subplots_adjust(left=0.15, right=0.95, top=0.95, bottom=0.15)
plt.show()
Output:
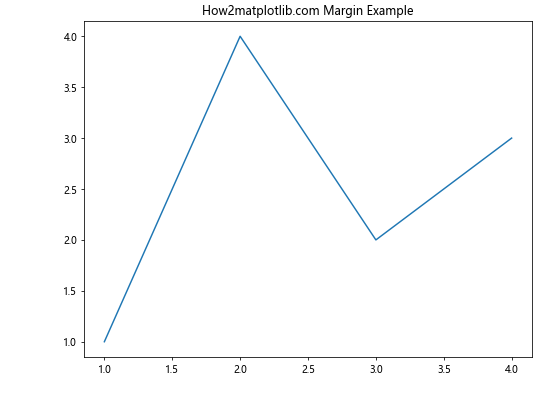
这个例子调整了图形的边距,使绘图区域更加紧凑。
14. 使用 GridSpec 进行复杂布局
对于更复杂的布局,我们可以使用 GridSpec:
import matplotlib.pyplot as plt
import matplotlib.gridspec as gridspec

fig = plt.figure(figsize=(12, 8))
gs = gridspec.GridSpec(2, 2, width_ratios=[1, 2], height_ratios=[2, 1])

ax1 = fig.add_subplot(gs[0, 0])
ax2 = fig.add_subplot(gs[0, 1])
ax3 = fig.add_subplot(gs[1, :])

ax1.plot([1, 2, 3], [1, 2, 3])
ax2.plot([1, 2, 3], [3, 2, 1])
ax3.plot([1, 2, 3, 4], [1, 4, 2, 3])

ax1.set_title("How2matplotlib.com GridSpec 1")
ax2.set_title("How2matplotlib.com GridSpec 2")
ax3.set_title("How2matplotlib.com GridSpec 3")

plt.tight_layout()
plt.show()
Output:
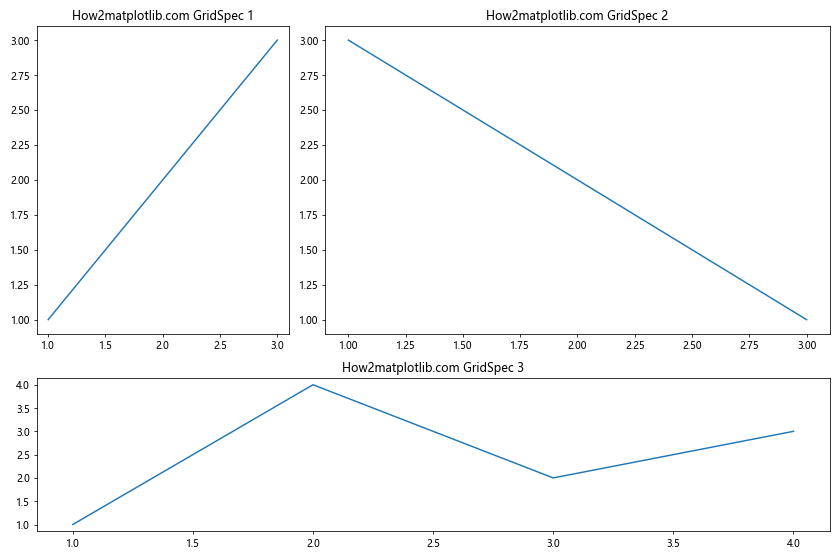
这个例子使用 GridSpec 创建了一个复杂的布局,包含三个不同大小的子图。
15. 动态调整图形尺寸
有时我们可能需要根据数据动态调整图形尺寸:
import matplotlib.pyplot as plt
import numpy as np

data = np.random.rand(10, 10)
fig, ax = plt.subplots()
im = ax.imshow(data)

# Adjust figure size based on data shape
aspect = data.shape[0] / data.shape[1]
fig.set_size_inches(8, 8 * aspect)

ax.set_title("How2matplotlib.com Dynamic Size Example")
plt.colorbar(im)
plt.show()
Output:
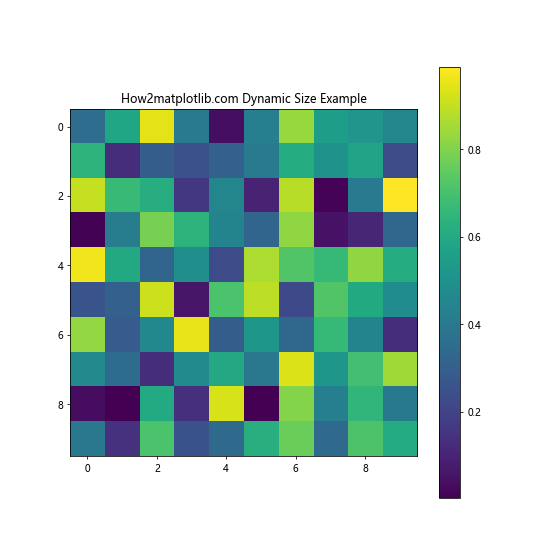
这个例子根据数据的形状动态调整图形的高度,保持宽度不变。
结论
控制 Matplotlib 图形的像素尺寸是创建高质量可视化的重要方面。通过调整 figsize、DPI 和其他相关参数,我们可以精确控制输出图像的大小和分辨率。无论是为了适应特定的显示需求,还是为了确保图形在不同媒体上的一致性,掌握这些技巧都将大大提高我们使用 Matplotlib 的效率和灵活性。
记住,图形的最终外观不仅取决于其尺寸,还取决于内容的布局、字体大小、线条粗细等因素。因此,在设置图形尺寸时,也要考虑这些元素,以确保最终的可视化效果既美观又信息丰富。
通过本文介绍的各种方法和技巧,你应该能够自如地控制 Matplotlib 图形的像素尺寸,创建出精确符合你需求的数据可视化作品。无论是用于学术论文、商业报告还是网页展示,这些知识都将帮助你制作出专业水准的图表。
 极客笔记
极客笔记