Matplotlib中绘制虚线及其间距控制详解
参考:matplotlib dashed line spacing
Matplotlib是Python中最流行的数据可视化库之一,它提供了丰富的绘图功能,包括绘制各种类型的线条。在数据可视化中,虚线是一种常用的线型,可以用来区分不同的数据系列或强调特定的信息。本文将详细介绍如何在Matplotlib中绘制虚线,以及如何控制虚线的间距,以满足各种可视化需求。
1. Matplotlib中的基本虚线绘制
在Matplotlib中,我们可以通过设置线型参数来绘制虚线。最常用的方法是使用linestyle或其简写形式ls参数。
1.1 使用预定义的线型
Matplotlib提供了几种预定义的虚线类型:
'--':虚线':':点线'-.':点划线
以下是一个简单的示例,展示了如何绘制这些基本的虚线类型:
import matplotlib.pyplot as plt
import numpy as np

x = np.linspace(0, 10, 100)
y1 = np.sin(x)
y2 = np.cos(x)
y3 = np.tan(x)

plt.figure(figsize=(10, 6))
plt.plot(x, y1, linestyle='--', label='Dashed (how2matplotlib.com)')
plt.plot(x, y2, linestyle=':', label='Dotted (how2matplotlib.com)')
plt.plot(x, y3, linestyle='-.', label='Dash-dot (how2matplotlib.com)')

plt.title('Basic Dashed Line Types in Matplotlib')
plt.xlabel('X-axis')
plt.ylabel('Y-axis')
plt.legend()
plt.grid(True)
plt.show()
Output:
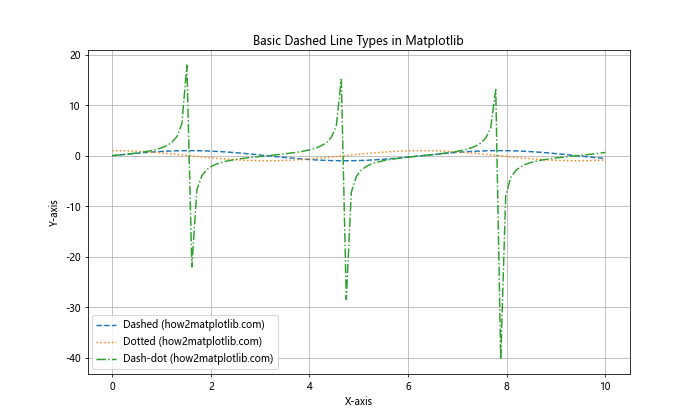
在这个示例中,我们使用numpy生成了三个不同的函数曲线,并使用不同的虚线样式绘制它们。linestyle参数分别设置为'--'、':'和'-.',分别表示虚线、点线和点划线。
1.2 使用自定义线型
除了预定义的线型,Matplotlib还允许我们自定义虚线的样式。我们可以使用一个包含偶数个元素的元组来定义线段和间隔的长度。
import matplotlib.pyplot as plt
import numpy as np

x = np.linspace(0, 10, 100)
y = np.sin(x)

plt.figure(figsize=(10, 6))
plt.plot(x, y, linestyle=(0, (5, 5)), label='Custom dashed (how2matplotlib.com)')
plt.plot(x, y + 1, linestyle=(0, (5, 2, 1, 2)), label='Custom dash-dot (how2matplotlib.com)')
plt.plot(x, y - 1, linestyle=(0, (1, 1)), label='Custom dotted (how2matplotlib.com)')

plt.title('Custom Dashed Line Styles in Matplotlib')
plt.xlabel('X-axis')
plt.ylabel('Y-axis')
plt.legend()
plt.grid(True)
plt.show()
Output:
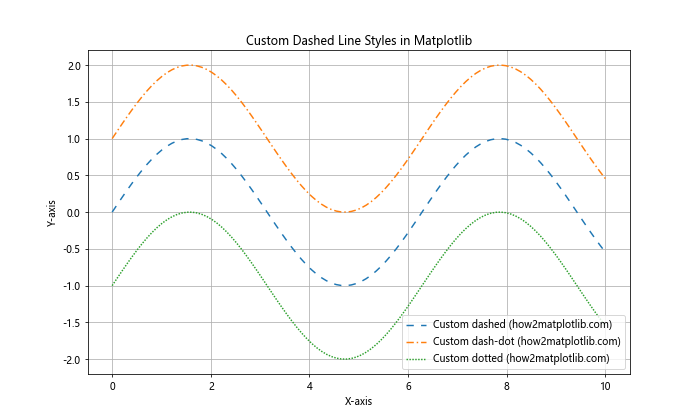
在这个示例中,我们使用了三种自定义的线型:
– (0, (5, 5)):表示线段长度为5,间隔长度为5的虚线。
– (0, (5, 2, 1, 2)):表示一个更复杂的模式,线段长度为5,间隔2,点长度1,再间隔2。
– (0, (1, 1)):表示线段长度为1,间隔长度为1的点线。
这种方法给了我们更大的灵活性来定制虚线的外观。
2. 控制虚线间距
虚线的间距对于图表的可读性和美观性都有重要影响。Matplotlib提供了多种方法来精确控制虚线的间距。
2.1 使用dashes参数
dashes参数允许我们更精细地控制虚线的模式。它接受一个包含偶数个元素的序列,其中奇数位置的元素表示线段长度,偶数位置的元素表示间隔长度。
import matplotlib.pyplot as plt
import numpy as np

x = np.linspace(0, 10, 100)
y = np.sin(x)

plt.figure(figsize=(10, 6))
plt.plot(x, y, linestyle='--', dashes=[6, 2], label='Dashes [6, 2] (how2matplotlib.com)')
plt.plot(x, y + 0.5, linestyle='--', dashes=[2, 2, 10, 2], label='Dashes [2, 2, 10, 2] (how2matplotlib.com)')
plt.plot(x, y - 0.5, linestyle='--', dashes=[8, 4, 2, 4, 2, 4], label='Dashes [8, 4, 2, 4, 2, 4] (how2matplotlib.com)')

plt.title('Controlling Dashed Line Spacing with dashes Parameter')
plt.xlabel('X-axis')
plt.ylabel('Y-axis')
plt.legend()
plt.grid(True)
plt.show()
Output:
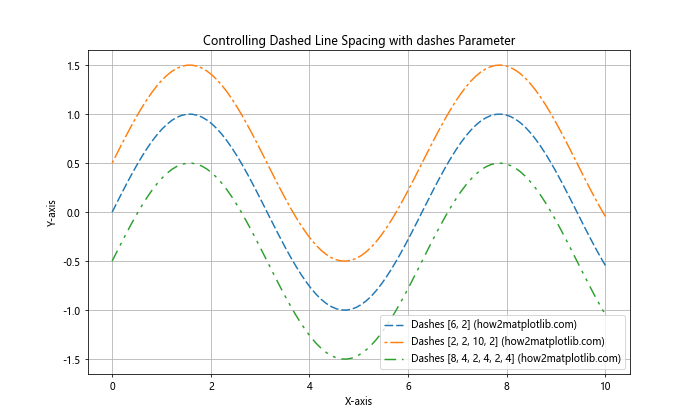
在这个示例中,我们使用dashes参数创建了三种不同的虚线模式:
– [6, 2]:线段长度为6,间隔长度为2。
– [2, 2, 10, 2]:短线段长度为2,短间隔为2,长线段长度为10,长间隔为2。
– [8, 4, 2, 4, 2, 4]:一个更复杂的模式,交替使用不同长度的线段和间隔。
2.2 使用DashPattern对象
从Matplotlib 3.4版本开始,引入了DashPattern对象,它提供了一种更灵活的方式来定义虚线模式。
import matplotlib.pyplot as plt
import numpy as np
from matplotlib.lines import Line2D

x = np.linspace(0, 10, 100)
y = np.sin(x)

plt.figure(figsize=(10, 6))
line1, = plt.plot(x, y, linestyle='--', label='Default dashed (how2matplotlib.com)')
line2, = plt.plot(x, y + 0.5, linestyle='--', label='Custom dashed (how2matplotlib.com)')
line3, = plt.plot(x, y - 0.5, linestyle='--', label='Scaled dashed (how2matplotlib.com)')

# 使用DashPattern对象自定义虚线模式
custom_dashes = Line2D.get_dash_pattern(line2)
scaled_dashes = Line2D.get_dash_pattern(line3)
line2.set_dashes(custom_dashes.scaled(2))  # 将默认虚线模式放大2倍
line3.set_dashes(scaled_dashes.scaled(0.5))  # 将默认虚线模式缩小一半

plt.title('Using DashPattern Object to Control Dashed Line Spacing')
plt.xlabel('X-axis')
plt.ylabel('Y-axis')
plt.legend()
plt.grid(True)
plt.show()
在这个示例中,我们首先绘制了三条默认的虚线。然后,我们使用Line2D.get_dash_pattern()方法获取默认的虚线模式,并使用scaled()方法来调整虚线的比例。这允许我们在不改变虚线基本模式的情况下,轻松地调整其间距。
3. 高级虚线技巧
除了基本的虚线控制,Matplotlib还提供了一些高级技巧,可以让我们创建更复杂和有趣的虚线效果。
3.1 使用循环色彩的虚线
我们可以结合虚线和颜色循环,创建一种独特的视觉效果:
import matplotlib.pyplot as plt
import numpy as np
from matplotlib.collections import LineCollection

x = np.linspace(0, 10, 100)
y = np.sin(x)

points = np.array([x, y]).T.reshape(-1, 1, 2)
segments = np.concatenate([points[:-1], points[1:]], axis=1)

fig, ax = plt.subplots(figsize=(10, 6))
lc = LineCollection(segments, linestyles='dashed', cmap='viridis')
lc.set_array(x)
lc.set_linewidth(2)

line = ax.add_collection(lc)
fig.colorbar(line, ax=ax)

ax.set_xlim(x.min(), x.max())
ax.set_ylim(y.min(), y.max())
plt.title('Dashed Line with Cyclic Colors (how2matplotlib.com)')
plt.xlabel('X-axis')
plt.ylabel('Y-axis')
plt.show()
Output:
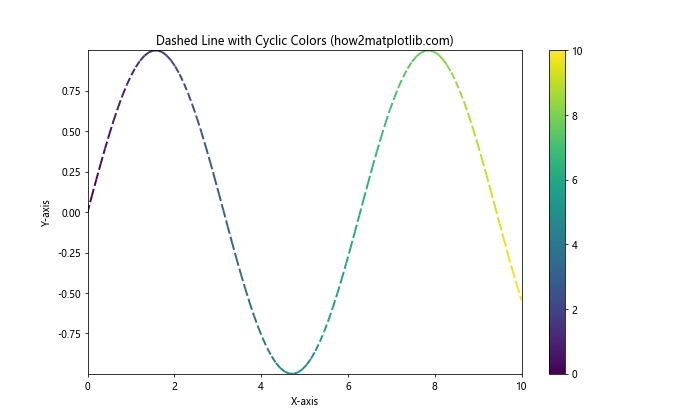
在这个示例中,我们使用LineCollection创建了一条虚线,其颜色随x轴的值变化。这种技术可以用来在单条线上同时展示两个维度的信息。
3.2 动态调整虚线间距
有时,我们可能需要根据数据的特征动态调整虚线的间距。以下是一个根据y值动态调整虚线间距的示例:
import matplotlib.pyplot as plt
import numpy as np

def dynamic_dashes(x, y):
    return [max(1, int(5 * abs(y))), max(1, int(3 * (1 - abs(y))))]

x = np.linspace(0, 10, 100)
y = np.sin(x)

fig, ax = plt.subplots(figsize=(10, 6))

line, = ax.plot(x, y, linestyle='--', color='blue', label='Dynamic dashed (how2matplotlib.com)')
line.set_dashes([1, 1])  # 初始化虚线样式

def update_dashes(line):
    segments = line.get_segments()
    for i, segment in enumerate(segments):
        x, y = segment.mean(axis=0)
        line.set_dashes(dynamic_dashes(x, y))
        break  # 只更新第一个段落,以简化示例

update_dashes(line)

plt.title('Dynamically Adjusted Dashed Line Spacing')
plt.xlabel('X-axis')
plt.ylabel('Y-axis')
plt.legend()
plt.grid(True)
plt.show()
在这个示例中,我们定义了一个dynamic_dashes函数,它根据y值的绝对值动态计算虚线的间距。然后,我们使用update_dashes函数来更新线条的虚线样式。这种方法可以用来强调数据中的特定特征或趋势。
3.3 组合多种线型
有时,我们可能想在同一条线上组合多种线型,以传达更复杂的信息:
import matplotlib.pyplot as plt
import numpy as np

x = np.linspace(0, 10, 100)
y = np.sin(x)

fig, ax = plt.subplots(figsize=(10, 6))

# 创建基本线条
line, = ax.plot(x, y, color='blue', label='Combined line styles (how2matplotlib.com)')

# 定义不同的线型段落
solid_mask = (x < 3) | (x > 7)
dashed_mask = (x >= 3) & (x <= 5)
dotted_mask = (x > 5) & (x <= 7)

# 应用不同的线型
line.set_linestyle('-')
ax.plot(x[solid_mask], y[solid_mask], color='blue', linestyle='-')
ax.plot(x[dashed_mask], y[dashed_mask], color='blue', linestyle='--')
ax.plot(x[dotted_mask], y[dotted_mask], color='blue', linestyle=':')

plt.title('Combining Multiple Line Styles in One Line')
plt.xlabel('X-axis')
plt.ylabel('Y-axis')
plt.legend()
plt.grid(True)
plt.show()
Output:
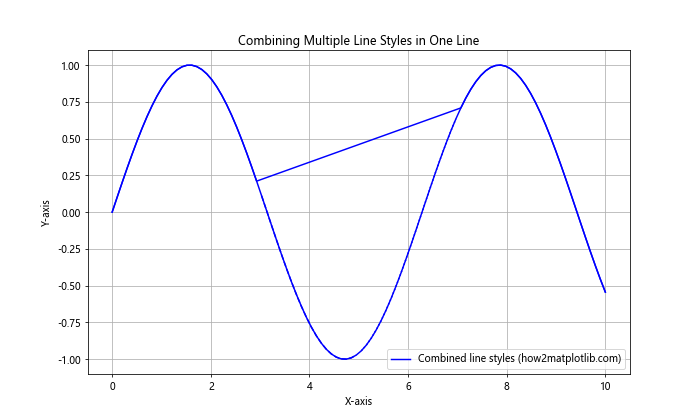
在这个示例中,我们根据x值的范围,将一条线分成了三个部分,分别使用实线、虚线和点线。这种技术可以用来在单条线上表示不同的数据特征或状态。
4. 虚线在数据可视化中的应用
虚线在数据可视化中有许多实际应用,下面我们将探讨一些常见的用例。
4.1 使用虚线表示预测或未来趋势
在时间序列分析中,虚线常用来表示预测或未来的趋势:
import matplotlib.pyplot as plt
import numpy as np

np.random.seed(42)
x = np.arange(0, 50)
y_actual = np.cumsum(np.random.randn(50))
y_forecast = y_actual[-1] + np.cumsum(np.random.randn(20))

plt.figure(figsize=(12, 6))
plt.plot(x, y_actual, label='Actual data (how2matplotlib.com)')
plt.plot(np.arange(49, 70), y_forecast, linestyle='--', label='Forecast (how2matplotlib.com)')

plt.axvline(x=49, color='r', linestyle=':', label='Present (how2matplotlib.com)')

plt.title('Using Dashed Lines to Represent Forecasts')
plt.xlabel('Time')
plt.ylabel('Value')
plt.legend()
plt.grid(True)
plt.show()
在这个示例中,我们使用实线表示实际数据,虚线表示预测数据,并用一条竖直的点线标记当前时间点。这种可视化方法可以清晰地区分历史数据和预测数据。
4.2 使用虚线表示置信区间或误差范围
虚线也常用于表示数据的不确定性,如置信区间或误差范围:
import matplotlib.pyplot as plt
import numpy as np

x = np.linspace(0, 10, 100)
y = np.sin(x)
y_err = 0.2 plt.figure(figsize=(10, 6))
plt.plot(x, y, label='Mean (how2matplotlib.com)')
plt.fill_between(x, y-y_err, y+y_err, alpha=0.2)
plt.plot(x, y-y_err, linestyle='--', color='gray', label='Error range (how2matplotlib.com)')
plt.plot(x, y+y_err, linestyle='--', color='gray')

plt.title('Using Dashed Lines to Represent Error Ranges')
plt.xlabel('X-axis')
plt.ylabel('Y-axis')
plt.legend()
plt.grid(True)
plt.show()
在这个示例中,我们使用实线表示平均值,虚线表示误差范围的上下界。同时,我们还使用半透明的填充区域来强调误差范围。这种可视化方法可以直观地展示数据的不确定性。
4.3 使用虚线区分不同数据系列
在比较多个数据系列时,使用不同的线型可以帮助区分它们:
import matplotlib.pyplot as plt
import numpy as np

x = np.linspace(0, 10, 100)
y1 = np.sin(x)
y2 = np.cos(x)
y3 = np.tan(x)

plt.figure(figsize=(10, 6))
plt.plot(x, y1, label='Sin (how2matplotlib.com)')
plt.plot(x, y2, linestyle='--', label='Cos (how2matplotlib.com)')
plt.plot(x, y3, linestyle=':', label='Tan (how2matplotlib.com)')

plt.title('Using Different Line Styles to Distinguish Data Series')
plt.xlabel('X-axis')
plt.ylabel('Y-axis')
plt.legend()
plt.grid(True)
plt.ylim(-2, 2)  # 限制y轴范围以便更好地观察
plt.show()
Output:
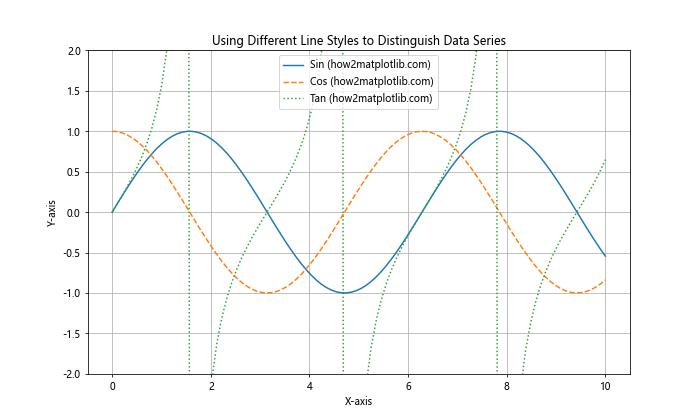
在这个示例中,我们使用实线、虚线和点线来区分三个不同的三角函数。这种方法在需要在同一图表中比较多个数据系列时特别有用。
5. 虚线在特殊图表类型中的应用
虚线不仅可以用于普通的线图,还可以应用于其他类型的图表,以增强其可读性和信息传递能力。
5.1 在散点图中使用虚线
虚线可以用来在散点图中添加趋势线或分界线:
import matplotlib.pyplot as plt
import numpy as np

np.random.seed(42)
x = np.random.rand(50)
y = 2 * x + 1 + np.random.randn(50) * 0.2

plt.figure(figsize=(10, 6))
plt.scatter(x, y, label='Data points (how2matplotlib.com)')

# 添加趋势线
z = np.polyfit(x, y, 1)
p = np.poly1d(z)
plt.plot(x, p(x), linestyle='--', color='r', label='Trend line (how2matplotlib.com)')

# 添加平均值线
plt.axhline(y=y.mean(), color='g', linestyle=':', label='Mean (how2matplotlib.com)')

plt.title('Using Dashed Lines in Scatter Plots')
plt.xlabel('X-axis')
plt.ylabel('Y-axis')
plt.legend()
plt.grid(True)
plt.show()
Output:
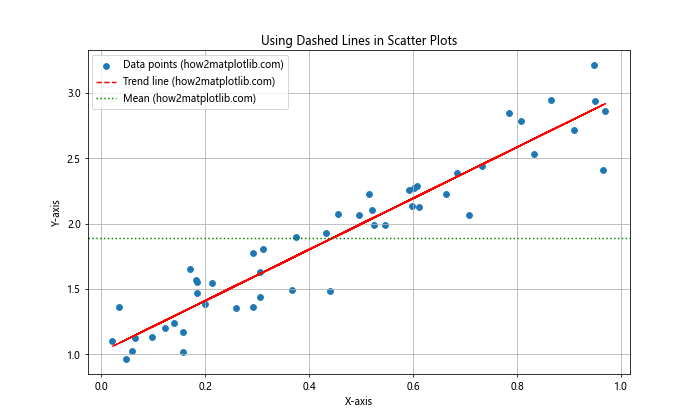
在这个示例中,我们使用虚线表示数据的线性趋势,使用点线表示y值的平均值。这种方法可以帮助观察者快速理解数据的整体趋势和分布。
5.2 在柱状图中使用虚线
虚线可以用来在柱状图中添加参考线或目标线:
import matplotlib.pyplot as plt
import numpy as np

categories = ['A', 'B', 'C', 'D', 'E']
values = np.random.randint(50, 100, 5)
target = 75

plt.figure(figsize=(10, 6))
plt.bar(categories, values, label='Values (how2matplotlib.com)')
plt.axhline(y=target, color='r', linestyle='--', label='Target (how2matplotlib.com)')

plt.title('Using Dashed Lines in Bar Charts')
plt.xlabel('Categories')
plt.ylabel('Values')
plt.legend()
plt.grid(True, axis='y')
plt.show()
Output:
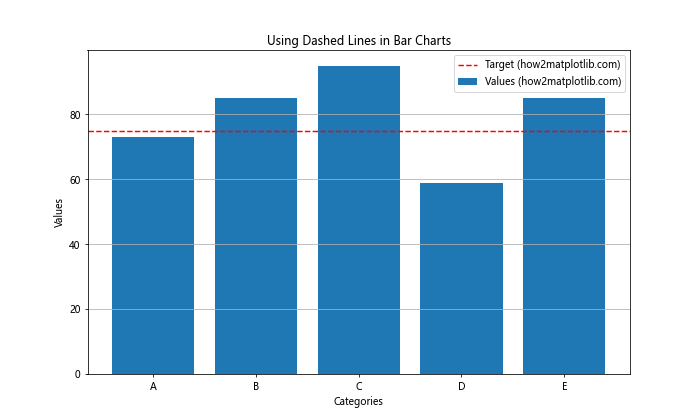
在这个示例中,我们使用虚线表示一个目标值。这可以帮助读者快速识别哪些类别达到或超过了目标。
5.3 在箱线图中使用虚线
虚线可以用来在箱线图中添加额外的统计信息:
import matplotlib.pyplot as plt
import numpy as np

np.random.seed(42)
data = [np.random.normal(0, std, 100) for std in range(1, 4)]

fig, ax = plt.subplots(figsize=(10, 6))
bp = ax.boxplot(data, patch_artist=True)

# 添加平均值线
means = [np.mean(d) for d in data]
ax.plot(range(1, len(data) + 1), means, 'r--', label='Mean (how2matplotlib.com)')

# 为每个箱子添加标签
for i, mean in enumerate(means):
    ax.text(i + 1, mean, f'{mean:.2f}', horizontalalignment='center', verticalalignment='bottom')

plt.title('Using Dashed Lines in Box Plots')
plt.xlabel('Groups')
plt.ylabel('Values')
plt.legend()
plt.grid(True, axis='y')
plt.show()
Output:
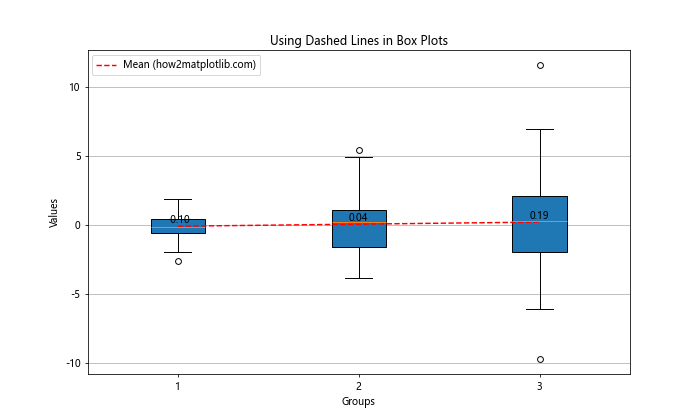
在这个示例中,我们使用虚线表示每组数据的平均值。这可以帮助读者比较中位数(箱子中的线)和平均值之间的关系。
6. 虚线样式的最佳实践
在使用虚线时,有一些最佳实践可以帮助我们创建更有效和美观的可视化:
6.1 保持一致性
在同一个图表或一系列相关图表中,保持虚线样式的一致性是很重要的。例如,如果你使用虚线表示预测数据,那么在所有相关图表中都应该使用相同的虚线样式来表示预测数据。
import matplotlib.pyplot as plt
import numpy as np

x = np.linspace(0, 10, 100)
y1 = np.sin(x)
y2 = np.cos(x)

fig, (ax1, ax2) = plt.subplots(1, 2, figsize=(15, 6))

# 第一个子图
ax1.plot(x, y1, label='Actual (how2matplotlib.com)')
ax1.plot(x, y1 + 0.5, linestyle='--', label='Forecast (how2matplotlib.com)')
ax1.set_title('Chart 1')
ax1.legend()

# 第二个子图
ax2.plot(x, y2, label='Actual (how2matplotlib.com)')
ax2.plot(x, y2 - 0.5, linestyle='--', label='Forecast (how2matplotlib.com)')
ax2.set_title('Chart 2')
ax2.legend()

plt.suptitle('Consistent Use of Dashed Lines Across Charts')
plt.tight_layout()
plt.show()
Output:
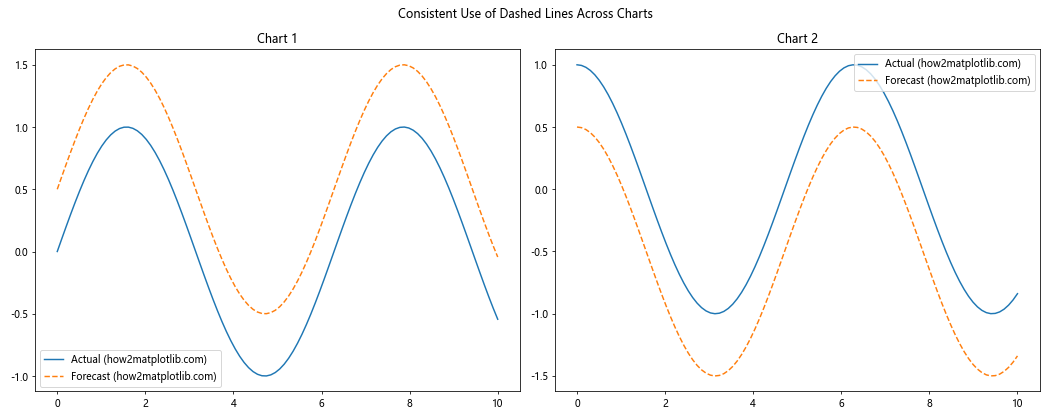
在这个示例中,我们在两个子图中都使用相同的虚线样式来表示预测数据,保持了视觉上的一致性。
6.2 避免过度使用
虽然虚线可以传达额外的信息,但过度使用可能会使图表变得混乱。通常,建议在一个图表中限制使用不超过2-3种不同的线型。
import matplotlib.pyplot as plt
import numpy as np

x = np.linspace(0, 10, 100)

plt.figure(figsize=(12, 6))

# 好的做法:使用有限的线型
plt.subplot(121)
plt.plot(x, np.sin(x), label='Sin (how2matplotlib.com)')
plt.plot(x, np.cos(x), linestyle='--', label='Cos (how2matplotlib.com)')
plt.plot(x, -np.sin(x), linestyle=':', label='-Sin (how2matplotlib.com)')
plt.title('Good: Limited Line Styles')
plt.legend()

# 不好的做法:过度使用线型
plt.subplot(122)
plt.plot(x, np.sin(x), label='Sin (how2matplotlib.com)')
plt.plot(x, np.cos(x), linestyle='--', label='Cos (how2matplotlib.com)')
plt.plot(x, -np.sin(x), linestyle=':', label='-Sin (how2matplotlib.com)')
plt.plot(x, -np.cos(x), linestyle='-.', label='-Cos (how2matplotlib.com)')
plt.plot(x, np.tan(x), linestyle=(0, (3, 1, 1, 1)), label='Tan (how2matplotlib.com)')
plt.title('Bad: Too Many Line Styles')
plt.legend()

plt.tight_layout()
plt.show()
Output:
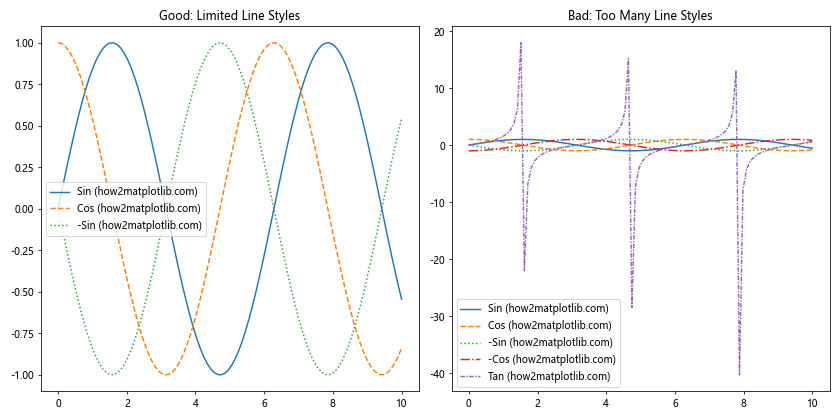
在这个示例中,左侧的图表使用了适量的线型,易于阅读和理解。而右侧的图表使用了过多的线型,可能会让读者感到困惑。
6.3 考虑色盲友好
在选择线型和颜色组合时,应考虑色盲读者的需求。使用不同的线型可以帮助色盲读者区分不同的数据系列。
import matplotlib.pyplot as plt
import numpy as np

x = np.linspace(0, 10, 100)

plt.figure(figsize=(10, 6))

plt.plot(x, np.sin(x), color='#1f77b4', label='Series 1 (how2matplotlib.com)')
plt.plot(x, np.cos(x), color='#ff7f0e', linestyle='--', label='Series 2 (how2matplotlib.com)')
plt.plot(x, -np.sin(x), color='#2ca02c', linestyle=':', label='Series 3 (how2matplotlib.com)')

plt.title('Color-blind Friendly Chart with Different Line Styles')
plt.xlabel('X-axis')
plt.ylabel('Y-axis')
plt.legend()
plt.grid(True)
plt.show()
Output:
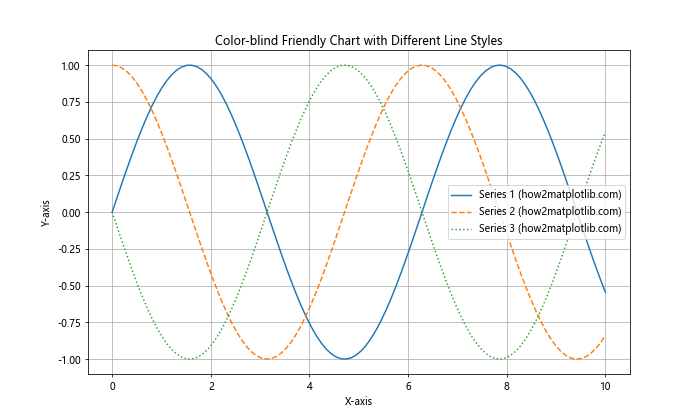
在这个示例中,我们不仅使用了不同的颜色,还使用了不同的线型。这样即使在黑白打印或对于色盲读者来说,也能轻松区分不同的数据系列。
7. 高级虚线技巧
对于那些希望进一步提升虚线使用技巧的用户,这里有一些高级技巧可以尝试:
7.1 创建自定义虚线模式
Matplotlib允许我们创建完全自定义的虚线模式,这可以用来表示特定的数据特征或创建独特的视觉效果:
import matplotlib.pyplot as plt
import numpy as np

x = np.linspace(0, 10, 100)
y = np.sin(x)

plt.figure(figsize=(10, 6))

# 创建一个复杂的自定义虚线模式
custom_pattern = [1, 1, 3, 1, 1, 4, 1, 1, 5, 1, 1, 6, 1, 1]
plt.plot(x, y, linestyle=(0, custom_pattern), linewidth=2, label='Custom pattern (how2matplotlib.com)')

plt.title('Advanced Custom Dashed Line Pattern')
plt.xlabel('X-axis')
plt.ylabel('Y-axis')
plt.legend()
plt.grid(True)
plt.show()
Output:
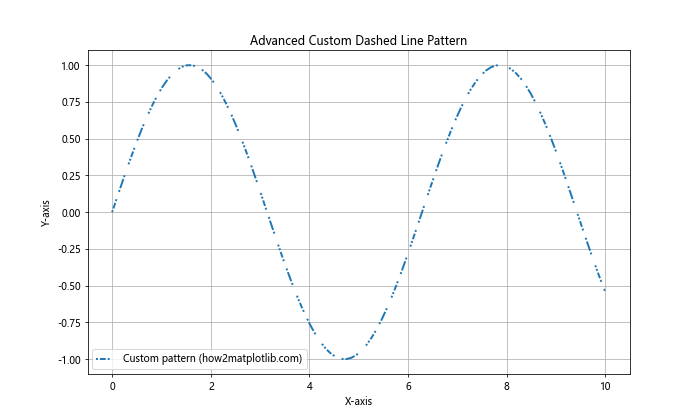
在这个示例中,我们创建了一个复杂的虚线模式,其中线段和间隔的长度逐渐增加。这种模式可以用来创造独特的视觉效果或表示数据的某种渐变特性。
7.2 动画虚线
通过动画,我们可以创建移动的虚线效果,这在某些情况下可以用来表示流动或进度:
import matplotlib.pyplot as plt
import numpy as np
from matplotlib.animation import FuncAnimation

fig, ax = plt.subplots(figsize=(10, 6))
x = np.linspace(0, 10, 100)
y = np.sin(x)
line, = ax.plot(x, y, linestyle='--', animated=True)

def update(frame):
    # 更新虚线的偏移量
    line.set_dashes([4, 2, 1, 2])  # 设置虚线模式
    line.set_dash_capstyle('round')
    line.set_dash_joinstyle('round')
    line.set_dashoffset(frame * 0.1)  # 动态更新偏移量
    return line,

ani = FuncAnimation(fig, update, frames=100, interval=50, blit=True)

plt.title('Animated Dashed Line (how2matplotlib.com)')
plt.xlabel('X-axis')
plt.ylabel('Y-axis')
plt.show()
这个示例创建了一个动画,其中虚线看起来在移动。这种效果可以用来表示数据流或强调某种方向性。
7.3 结合渐变色和虚线
我们可以结合渐变色和虚线来创建更复杂的视觉效果:
import matplotlib.pyplot as plt
import numpy as np
from matplotlib.collections import LineCollection

x = np.linspace(0, 10, 100)
y = np.sin(x)

points = np.array([x, y]).T.reshape(-1, 1, 2)
segments = np.concatenate([points[:-1], points[1:]], axis=1)

fig, ax = plt.subplots(figsize=(10, 6))

# 创建颜色映射
norm = plt.Normalize(y.min(), y.max())
lc = LineCollection(segments, cmap='viridis', norm=norm)
lc.set_array(y)
lc.set_linestyle('--')
line = ax.add_collection(lc)
fig.colorbar(line, ax=ax)

ax.set_xlim(x.min(), x.max())
ax.set_ylim(y.min(),y.max())
plt.title('Gradient Colored Dashed Line (how2matplotlib.com)')
plt.xlabel('X-axis')
plt.ylabel('Y-axis')
plt.show()
Output:
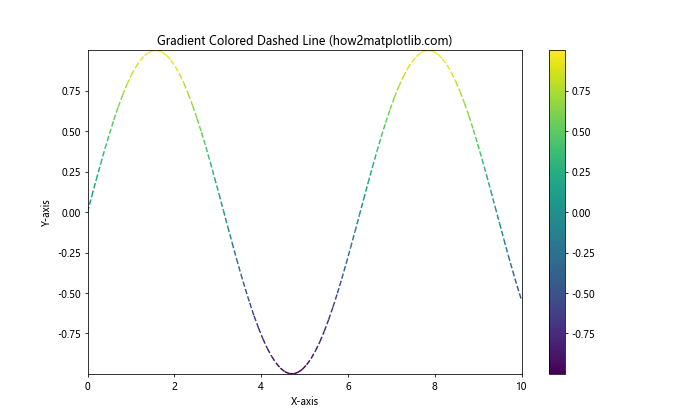
这个示例结合了渐变色和虚线,创造出一种独特的视觉效果。颜色的变化可以用来表示额外的数据维度,而虚线则可以强调线条的某些特性。
8. 虚线在数据分析中的应用
虚线不仅仅是一种视觉元素,它在数据分析中也有重要的应用。以下是一些在数据分析中使用虚线的例子:
8.1 时间序列分析中的季节性趋势
在时间序列分析中,虚线可以用来表示季节性趋势或周期性模式:
import matplotlib.pyplot as plt
import numpy as np

np.random.seed(42)
t = np.linspace(0, 4, 500)
y = np.sin(2 * np.pi * t) + 0.1 * np.random.randn(500)

plt.figure(figsize=(12, 6))
plt.plot(t, y, label='Observed data (how2matplotlib.com)')
plt.plot(t, np.sin(2 * np.pi * t), 'r--', label='Seasonal trend (how2matplotlib.com)')

plt.title('Time Series Analysis with Seasonal Trend')
plt.xlabel('Time')
plt.ylabel('Value')
plt.legend()
plt.grid(True)
plt.show()
Output:
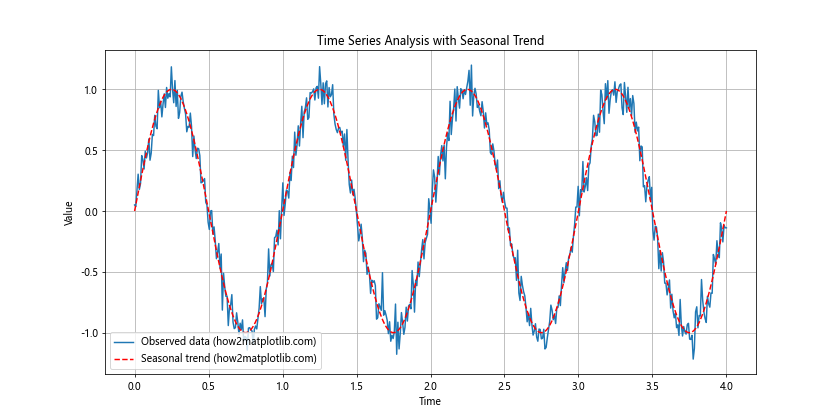
在这个示例中,我们使用虚线来表示时间序列数据的底层季节性趋势。这有助于分析师识别数据中的周期性模式。
8.2 回归分析中的置信区间
在回归分析中,虚线常用来表示预测的置信区间:
import matplotlib.pyplot as plt
import numpy as np
from scipy import stats

np.random.seed(42)
x = np.linspace(0, 10, 100)
y = 2 * x + 1 + np.random.normal(0, 2, 100)

slope, intercept, r_value, p_value, std_err = stats.linregress(x, y)
line = slope * x + intercept

plt.figure(figsize=(10, 6))
plt.scatter(x, y, label='Data (how2matplotlib.com)')
plt.plot(x, line, 'r', label='Regression line (how2matplotlib.com)')

# 计算并绘制置信区间
def predict(x, slope, intercept):
    return slope * x + intercept

predict_y = predict(x, slope, intercept)
pred_error = y - predict_y
degrees_of_freedom = len(x) - 2
residual_std_error = np.sqrt(np.sum(pred_error**2) / degrees_of_freedom)

plt.fill_between(x, predict_y - 1.96 * residual_std_error, predict_y + 1.96 * residual_std_error, alpha=0.2)
plt.plot(x, predict_y - 1.96 * residual_std_error, 'r--', label='95% Confidence Interval (how2matplotlib.com)')
plt.plot(x, predict_y + 1.96 * residual_std_error, 'r--')

plt.title('Regression Analysis with Confidence Intervals')
plt.xlabel('X-axis')
plt.ylabel('Y-axis')
plt.legend()
plt.grid(True)
plt.show()
Output:
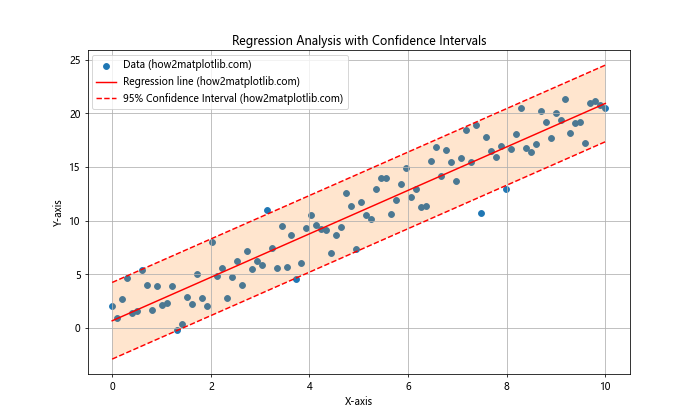
在这个示例中,我们使用虚线来表示回归分析的95%置信区间。这有助于分析师评估模型预测的可靠性。
8.3 对比分析中的基准线
在进行对比分析时,虚线可以用来表示基准线或参考值:
import matplotlib.pyplot as plt
import numpy as np

categories = ['A', 'B', 'C', 'D', 'E']
values = np.random.randint(60, 100, 5)
benchmark = 80

plt.figure(figsize=(10, 6))
plt.bar(categories, values, label='Performance (how2matplotlib.com)')
plt.axhline(y=benchmark, color='r', linestyle='--', label='Benchmark (how2matplotlib.com)')

for i, v in enumerate(values):
    plt.text(i, v, str(v), ha='center', va='bottom')

plt.title('Performance Comparison with Benchmark')
plt.xlabel('Categories')
plt.ylabel('Score')
plt.legend()
plt.grid(True, axis='y')
plt.show()
Output:
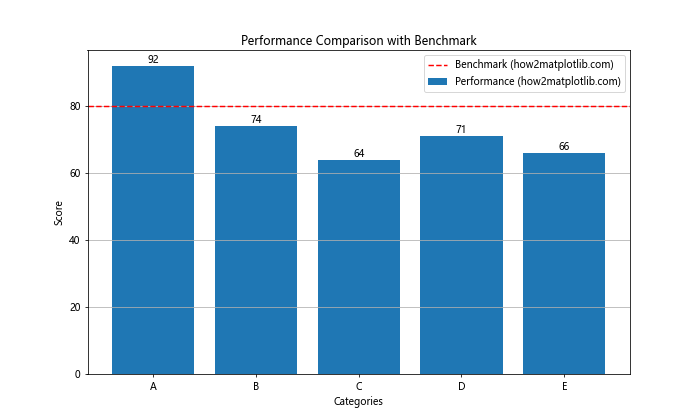
在这个示例中,我们使用虚线来表示一个基准值。这可以帮助分析师快速识别哪些类别的表现高于或低于基准。
9. 虚线在科学绘图中的应用
虚线在科学绘图中也有广泛的应用,特别是在表示理论模型、边界条件或不确定性时。
9.1 相变图中的边界线
在物理学或化学的相变图中,虚线常用来表示不确定的相边界:
import matplotlib.pyplot as plt
import numpy as np

def phase_boundary(x):
    return 100 * np.log(x) + 500

x = np.linspace(0.1, 10, 100)
y = phase_boundary(x)

plt.figure(figsize=(10, 6))
plt.plot(x, y, 'b-', label='Certain boundary (how2matplotlib.com)')
plt.plot(x, y + 50, 'r--', label='Uncertain boundary (how2matplotlib.com)')

plt.fill_between(x, y, color='lightblue', alpha=0.3, label='Phase A')
plt.fill_between(x, y, 1000, color='lightyellow', alpha=0.3, label='Phase B')

plt.title('Phase Diagram with Uncertain Boundary')
plt.xlabel('Pressure')
plt.ylabel('Temperature')
plt.legend()
plt.grid(True)
plt.ylim(0, 1000)
plt.show()
Output:
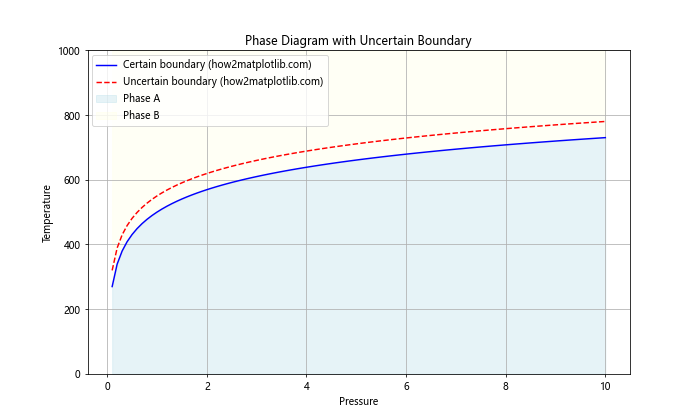
在这个示例中,我们使用实线表示确定的相边界,使用虚线表示不确定的相边界。这种表示方法在科学文献中很常见,可以直观地展示数据的可靠性。
9.2 理论模型与实验数据的对比
在比较理论模型和实验数据时,虚线常用来表示理论预测:
import matplotlib.pyplot as plt
import numpy as np

np.random.seed(42)
x = np.linspace(0, 10, 50)
y_theory = 2 * x + 1
y_experiment = 2 * x + 1 + np.random.normal(0, 1, 50)

plt.figure(figsize=(10, 6))
plt.scatter(x, y_experiment, label='Experimental data (how2matplotlib.com)')
plt.plot(x, y_theory, 'r--', label='Theoretical model (how2matplotlib.com)')

plt.title('Comparison of Theoretical Model and Experimental Data')
plt.xlabel('X-axis')
plt.ylabel('Y-axis')
plt.legend()
plt.grid(True)
plt.show()
Output:
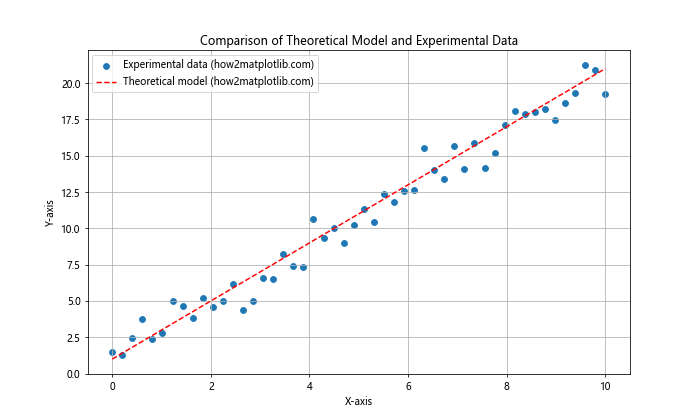
在这个示例中,我们使用散点图表示实验数据,使用虚线表示理论模型的预测。这种可视化方法可以帮助研究人员直观地评估理论模型与实际数据的吻合程度。
9.3 误差传播in误差棒图
在误差棒图中,虚线可以用来表示误差的传播:
import matplotlib.pyplot as plt
import numpy as np

x = np.array([1, 2, 3, 4, 5])
y = np.array([1, 4, 9, 16, 25])
yerr = np.array([0.1, 0.2, 0.3, 0.4, 0.5])

plt.figure(figsize=(10, 6))
plt.errorbar(x, y, yerr=yerr, fmt='o', capsize=5, label='Data points (how2matplotlib.com)')

# 添加误差传播线
for i in range(len(x)-1):
    plt.plot([x[i], x[i+1]], [y[i]+yerr[i], y[i+1]-yerr[i+1]], 'r--', alpha=0.5)
    plt.plot([x[i], x[i+1]], [y[i]-yerr[i], y[i+1]+yerr[i+1]], 'r--', alpha=0.5)

plt.title('Error Propagation in Error Bar Chart')
plt.xlabel('X-axis')
plt.ylabel('Y-axis')
plt.legend()
plt.grid(True)
plt.show()
Output:
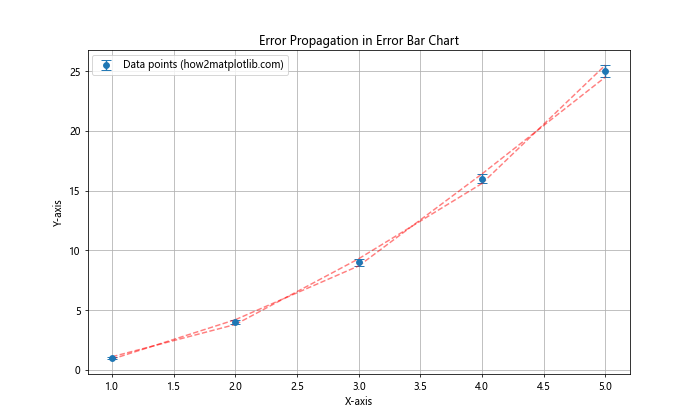
在这个示例中,我们使用虚线连接相邻数据点的误差范围,以可视化误差如何在数据点之间传播。这种表示方法在分析测量精度和数据可靠性时非常有用。
10. 结论
虚线在Matplotlib中是一个强大而灵活的工具,可以用来增强数据可视化的表现力和信息量。通过调整虚线的样式、间距和颜色,我们可以传达额外的信息,如数据的不确定性、预测趋势或不同数据系列之间的区别。
在本文中,我们详细探讨了如何在Matplotlib中创建和自定义虚线,包括基本的虚线绘制、间距控制、高级技巧以及在各种图表类型中的应用。我们还讨论了虚线在数据分析和科学绘图中的实际应用,以及一些最佳实践。
关键要点包括:
- Matplotlib提供了多种方法来创建虚线,从简单的预定义样式到完全自定义的模式。
- 虚线的间距可以通过多种方式控制,包括使用
dashes参数和DashPattern对象。 - 虚线可以与其他视觉元素(如颜色和透明度)结合使用,以创建更丰富的可视化效果。
- 在使用虚线时,保持一致性、避免过度使用,并考虑色盲友好的设计是重要的最佳实践。
- 虚线在数据分析和科学绘图中有广泛的应用,可以用来表示预测、置信区间、基准线等。
通过掌握这些技巧和概念,你可以更有效地使用Matplotlib中的虚线功能,创建既美观又信息丰富的数据可视化。无论是进行数据分析、科学研究还是商业报告,灵活运用虚线都能帮助你更好地传达数据背后的故事。
 极客笔记
极客笔记